BTC and ETH options trade close to their lowest levels all year
AI Summary
Show More
Quickly grasp the article's content and gauge market sentiment in just 30 seconds!
This week kicked off with a selloff in global bond markets, which in turn weighed on crypto risk sentiment.
Government bond yields at multi-decade highs were, in part, driven by inflationary concerns from the ongoing US-Iran conflict.
BTC briefly fell to $76K, a two-week low, while ETH tested the $2,100 support level.
Despite the weakening macro backdrop, BTC has traded with volatility levels close to year-to-date lows, something we see reflected in options positioning too.
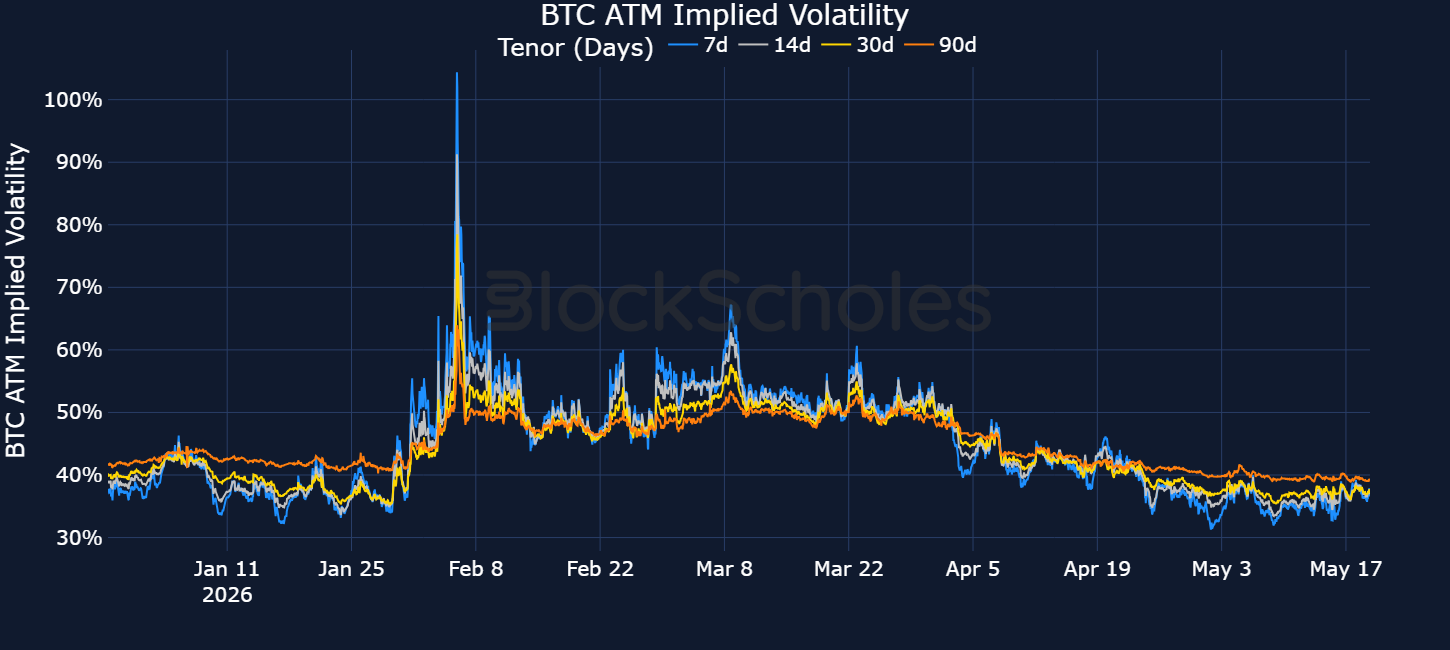
The risk premium priced in by BTC options is near its lowest all year, while 7-day at-the-money ETH implied volatility fell to 37%, its own YTD low last week.
The significantly low ATM implied volatility has occurred alongside an increase in the premium towards put options.
Traders are hedging against the potential of a further downside drop in spot prices, yet that panic isn’t being priced in ATM volatility.
READ MORE (published May 19th): Bybit Options Weekly Review: May 12–May 18
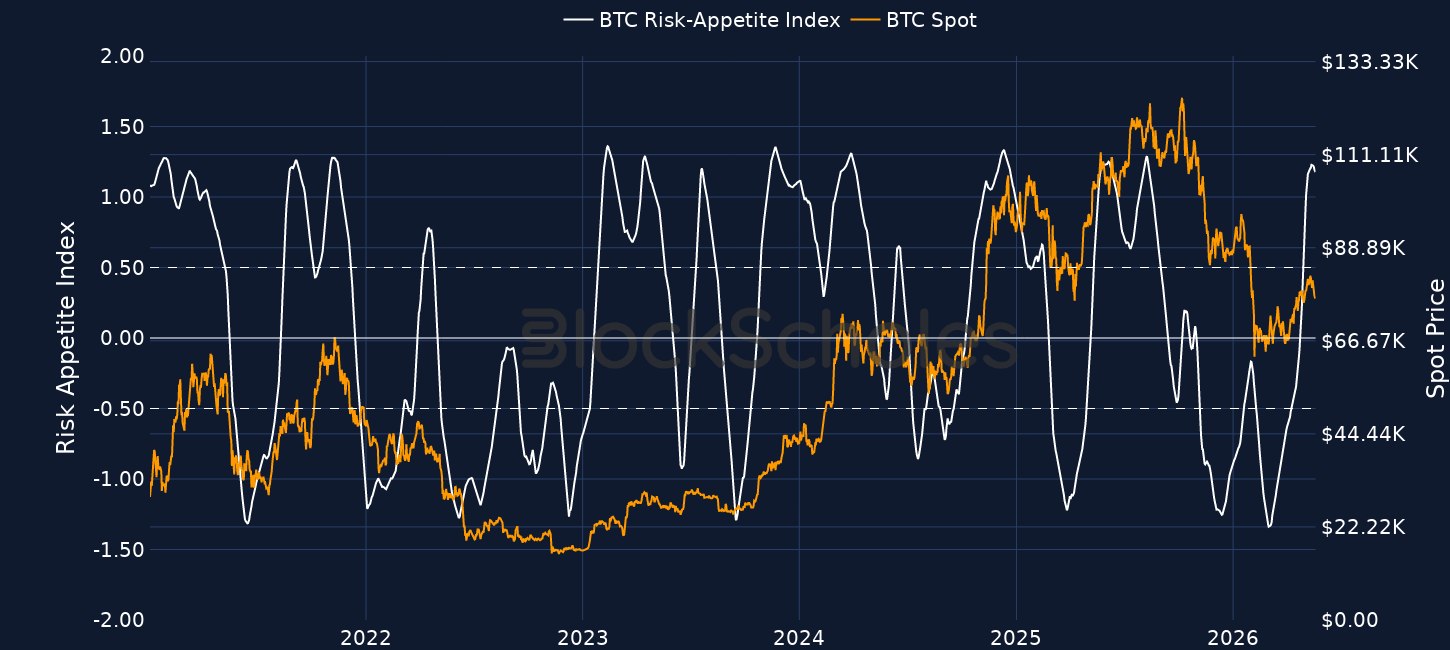
Block Scholes BTC Risk Appetite Index
Block Scholes ETH Risk Appetite Index
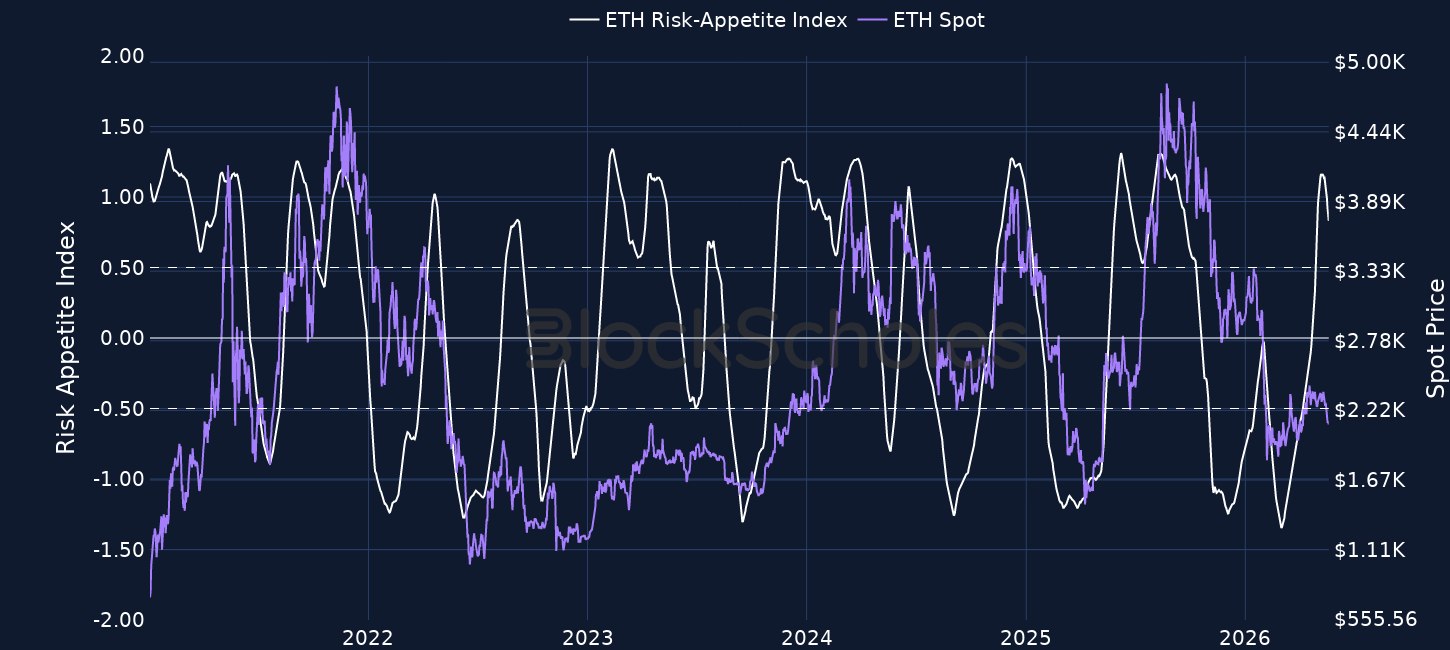
Block Scholes’ Risk Appetite Index measures the level of euphoria (above 1) or panic (below -1) in the spot market. Momentum in this index shows a strong relationship to spot returns.
LATEST CRYPTO TRENDS: Download this week's full report to learn more about ongoing Token BuyBacks and What's New in Defi.
Demand for optionality close to year-to-date lows
A repricing in risk appetite has seen BTC fall to $76k - a more than two-week low - and ETH fall briefly below the key psychological support level of $2,100.
That downturn in risk sentiment across both crypto spot prices and US equities has occurred against a noticeably more hawkish macro environment.
On the geopolitical front, a peace agreement between the US and Iran remains elusive - both sides have rejected the other’s most recent proposal, though President Trump has so far opted against renewing the US bombing campaign in the region.
Risk sentiment has also drifted lower as the effective shutdown of the Strait of Hormuz begins to take its toll on US consumer inflation.
According to the Bureau of Labor Statistics:
Headline Consumer Price Index (CPI) rose 3.8% year-on-year in April, the highest reading since May 2023 and 0.6% month-on-month.
Core CPI, which excludes the volatile food and energy components, rose 2.8% year-on-year, its highest level since September 2025.
According to the same release, the 3.8% month-on-month increase in energy prices accounted for over 40% of the 0.6% rise in the headline index between April and May.
READ MORE (published May 12th): US inflation PREVIEW - see forecasted reactions for BTC, gold, oil, and more.
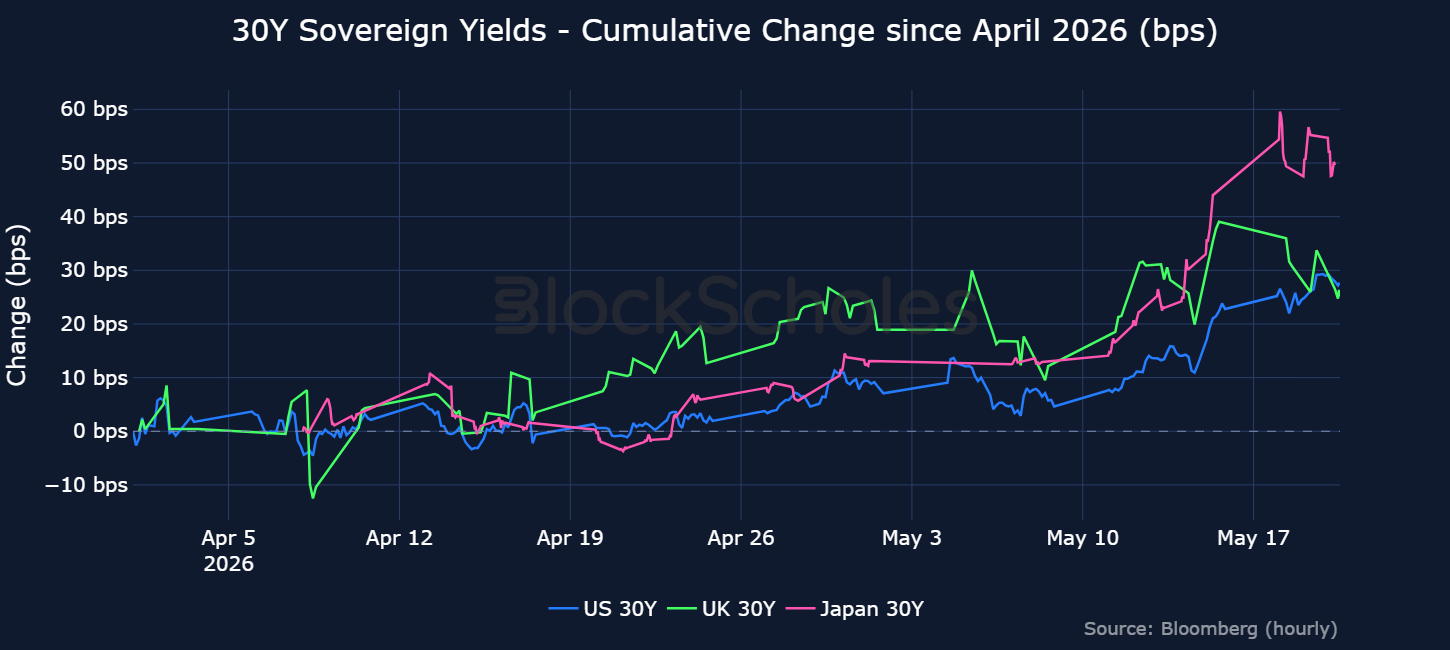
Fears that the energy crisis will continue to spill over into inflation have, among other idiosyncratic drivers, partly contributed to a global selloff in government bonds — pushing yields sharply higher from Japan to the US.
The 10-year US treasury yield — a key benchmark for many consumer loans and mortgages — made a run towards 4.7% in reaching its highest levels since January 2025.
Equally, 2-year yields, which closely monitor changes to monetary policy, broke above 4.1%, their highest since February 2025.
At the longer-end, 30-year yields are now at their highest since July 2007, which harks back to the eve of the Global Financial Crisis.
Japanese government bonds (JGBs) hit records of their own over the past week.
The 30-year JGB yield has jumped past 4%, an all-time high!
10-year JGB yields are at their highest level since 1996.
Note that, in the Bybit Learn X Block Scholes 2026 Annual Crypto Outlook report (published Jan 5th, 2026), we had already cited JGB bond yields are a key market risk to watch this year.
Markets are also repricing expectations for monetary policy and the potential for rate hikes by central banks, including the Fed, aimed at bringing inflation down.
Overnight interest-rate swaps are now almost certain (97.5% chance) of a rate hike by the January 2027 Fed meeting.
Macro factors remain the primary driver of crypto spot price action and, historically, large spikes in bond-market volatility have coincided with greater volatility in BTC's spot price.
Over the past month, the MOVE Index, which reflects the level of volatility in US Treasury futures, has jumped more than 15%.
While not quite at some of the highs we’ve seen earlier in the year, the current low-volatility environment in crypto markets does show a slight dislocation in its relationship to the MOVE Index.
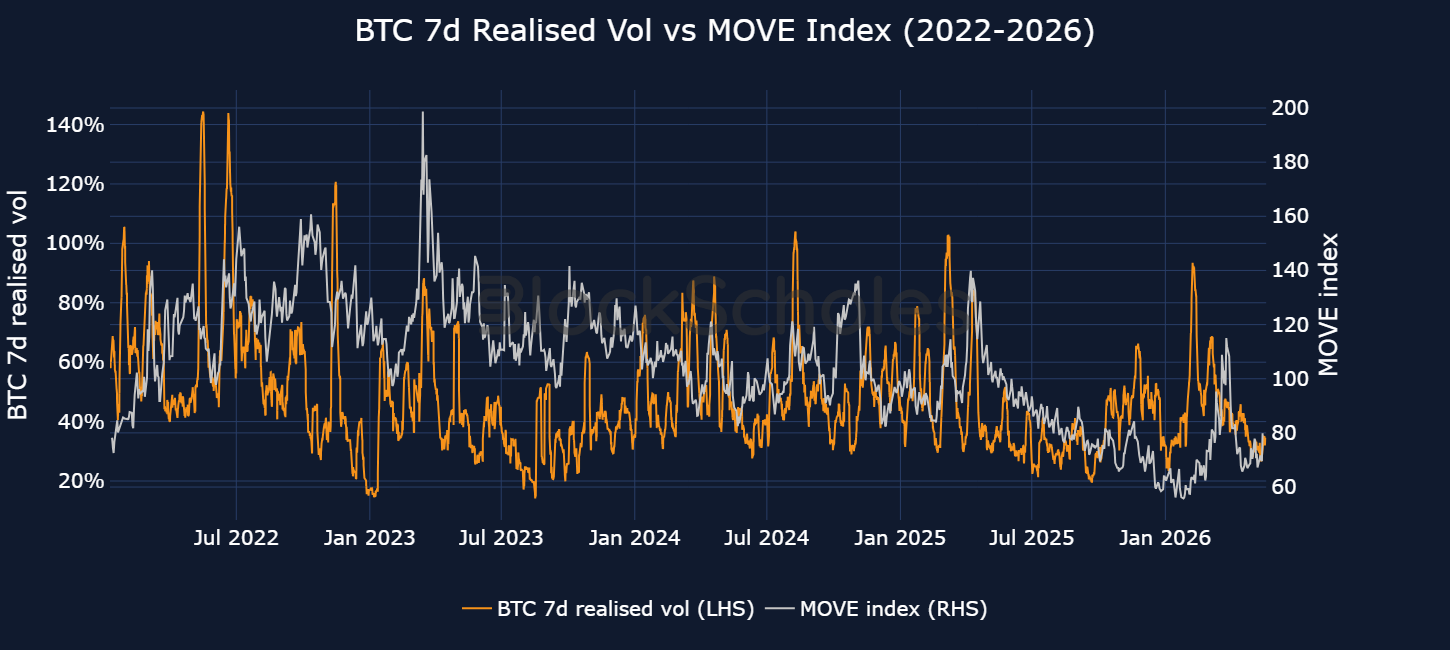
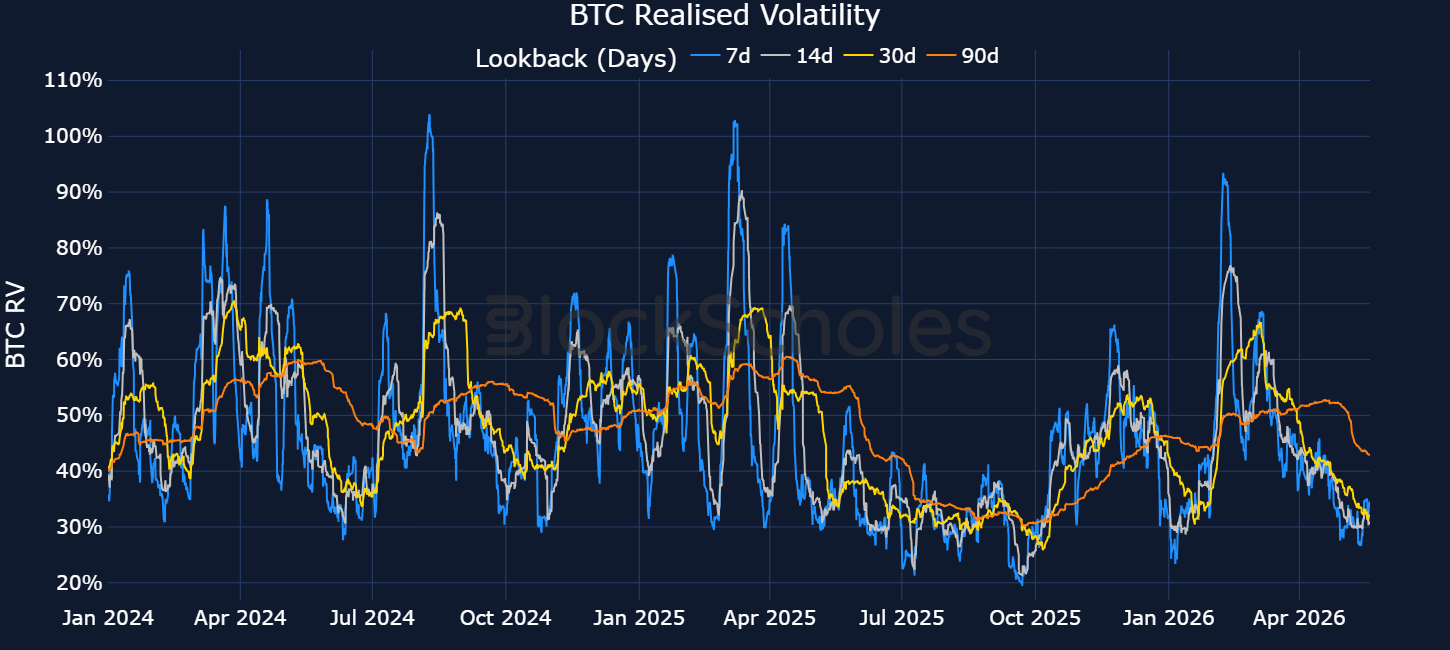
7-day BTC realised volatility is currently close to its year-to-date low, just below 30%, with spot price trading -12% YTD.
The most recent two major breakouts in realised volatility - in early February 2026 and early March 2026 - both coincided with a shift in the macro environment, which makes the current low-vol environment all the more surprising.
8 February 2026: 7-day realised volatility spiked to 91% after BTC’s largest single-day drop since the FTX collapse, three days earlier. That selloff occurred against a macro backdrop in which fears over AI valuations drove a sharp pullback in risk assets.
6 March 2026: 7-day realised volatility jumped to 69% — a move largely attributed to the start of the US-Iran war in late February.
That lack of volatility is also expressed in options markets.
At-the-money implied volatility — a forward-looking view of the volatility traders expect from BTC — is similarly close to its year-to-date low of 30%.
In other words, the risk premium priced in by BTC options is near its lowest all year, despite a macro backdrop with considerable uncertainty.
The low-volatility story is not specific to BTC.
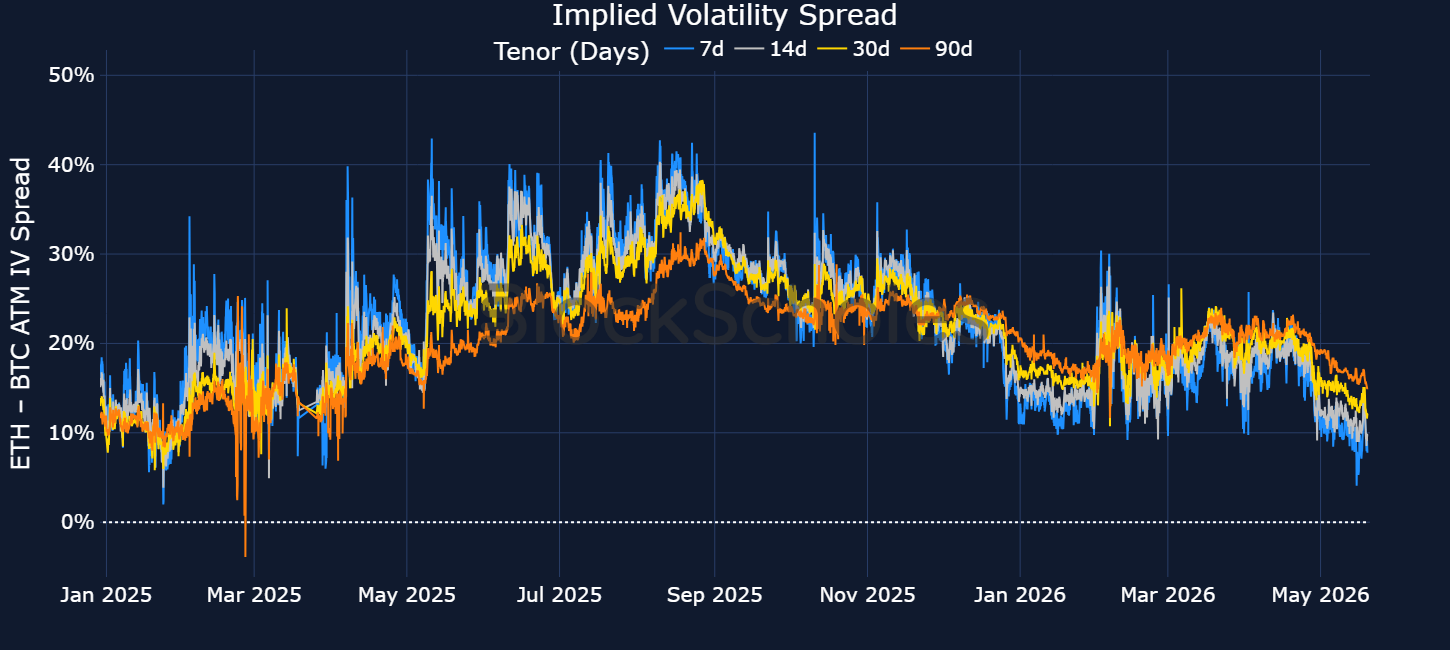
7-day ETH at-the-money implied volatility fell to 37% on 15 May 2026, the lowest level so far this year.
The compression in both BTC's and ETH's 7-day forward-looking volatility expectations has narrowed the spread between the two to its tightest since March 2025: on 15 May 2026, ETH vol was trading only 4.08 percentage points above 7-day BTC vol.
This marks another interesting dislocation.
Over their shared history, ETH volatility has almost always traded at a meaningful premium to BTC volatility — partly a reflection of its higher realised volatility.
For example, since 2024, the median ETH-BTC 7-day ATM IV spread has been 15 vol points. The recent 4.08 pp spread on May 15th therefore sits in the bottom 11th percentile of the distribution.
The surprisingly low BTC and ETH volatility environment becomes more striking when looking at the skew of the volatility smile.
Since the beginning of May, 7-day at-the-money implied volatility for BTC has traded sideways between 33% and 36%, while the 25-delta put-call skew has steepened to the downside from -3% to as low as -7%.
If options traders are nervous about a potential downturn in spot price and are demanding a premium for put options, that is not being reflected in at-the-money implied volatility.
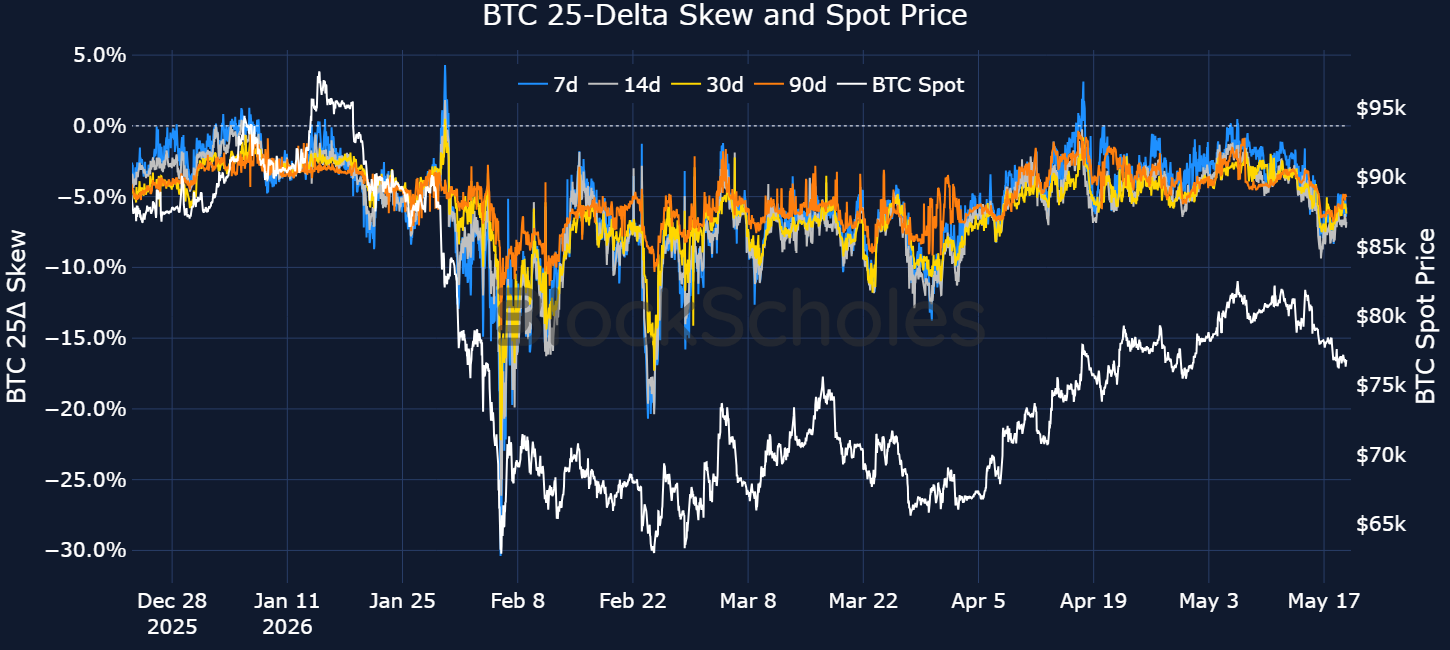
The dislocation between ATM implied volatility and skew suggests either the market realises it could be underpricing volatility expectations and we see options premiums snap higher, or skew reverts closer towards neutral levels.
DISCLAIMER: This article is provided for general information and reflects the author’s views only. It does not constitute investment advice, nor an offer or solicitation to buy or sell any financial instruments or digital assets. Your ability to access or use any products or services mentioned may be subject to the laws and regulatory requirements of your jurisdiction.
Grab Up to 100 USDT in Rewards
Also, enjoy 555% APR on Bybit Earn products!