3 Assets to Watch: May 11-15
AI Summary
Show More
Quickly grasp the article's content and gauge market sentiment in just 30 seconds!
Markets are once again kicking off the week by reacting to the weekend's developments surrounding the Middle East conflict.
Attempts to end the Middle East conflict reached an impasse after the US and Iran rejected each other's peace proposals.
Of course, cryptos reacted first, with Bitcoin submerging back below $82k once more
The NAS100 index is easing lower by 0.1%, though still holding around record highs
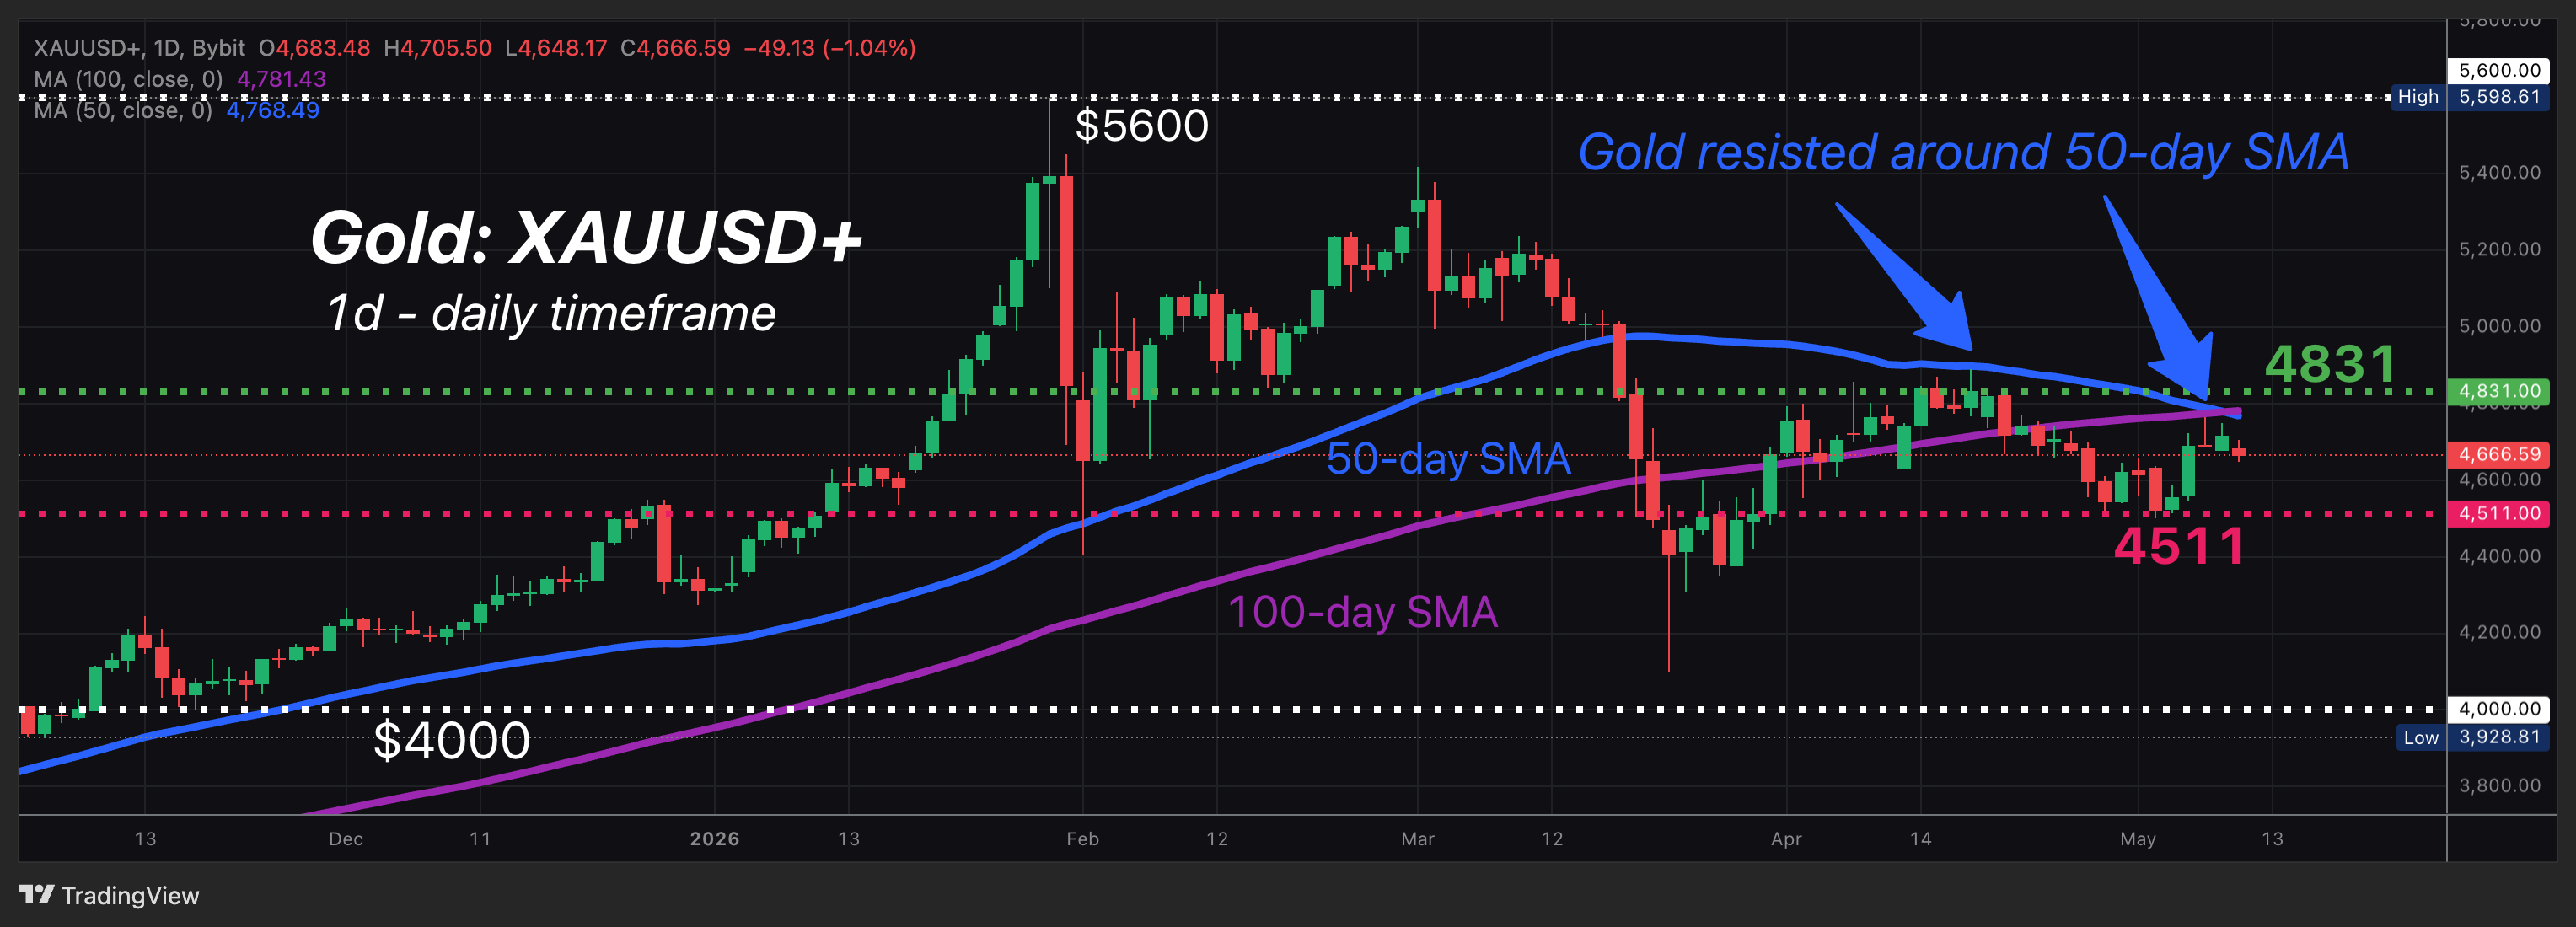
Spot gold (Bybit: XAUUSD+) is down 1%, having met resistance around its 50-day simple moving average (SMA) once more - just like it did back in mid-April.
As has been the case since end-Feb ...
Markets are bound to remain sensitive to the Iran war this week.
Key events to watch (besides the Iran war)
Even then, there are other major macro events that traders and investors have to tend to this week (May 11-15):
Monday, May 11: US Senate may vote on Kevin Warsh's nomination as Fed Chair
Tuesday, May 12: US consumer price index (CPI) a.k.a. Inflation
Thursday - Friday, May 14-15: President Donald Trump set to visit President Xi Jinping in China.
Friday, May 15: Jerome Powell's tenure as Fed Chair ends (Goodbye, Mr. “Good Afternoon”).
Key Assets to Watch:
1) Gold to re-test $4500 support?
We haven’t written much about gold of late, which has been adhering to a sideways range for the past couple of months.
However, from a technical perspective, traders would have noted that spot gold’s 50-day SMA has crossed below its 100-day counterpart - which could be interpreted as a “bearish signal” (i.e. a sign that prices may fall further).
POTENTIAL SCENARIOS
UPSIDE: Spot gold may revisit resistance around $4831 if the US releases lower-than-expected inflation data, while geopolitical tensions ease on the global stage - either on the Middle East front or during Trump’s visit to China - which weakens the US dollar while giving room for gold to move back higher.
DOWNSIDE: Spot gold may revisit support around $4511 if the US unveils higher-than-expected US inflation data, while geopolitical tensions spike once more on the global stage, strengthening the US dollar and ramping up inflation risks, which in turn drags spot gold lower.
At the time of writing, Bloomberg’s forecast model predicts a 74% chance that spot gold trades between $4516 - $4834 over the next one-week period.
2) HKTECH to hit 2-month high; test 100-day SMA resistance?
Bybit’s Hang Seng TECH Index Cash CFD (HKD) represents the 30 biggest tech companies listed in Hong Kong.
This stock index includes Asian tech giants that are set to unveil their respective earnings results this week:
Tue, May 12: JD.com (forecasted 1-day, post-earnings move of 4.7% up/down) - accounts for 5.5% of HKTECH
Wed, May 13: Tencent (forecasted 1-day, post-earnings move of 2.9% up/down) - accounts for 8% of HKTECH
Wed, May 13: Alibaba (forecasted 1-day, post-earnings move of 5.9% up/down) - accounts for 7.4% of HKTECH
With these 3 stocks accounting for over 20% of the HKTECH index ...
The markets’ reaction to their respective earnings may move the broader HKTECH index as well.
POTENTIAL SCENARIOS
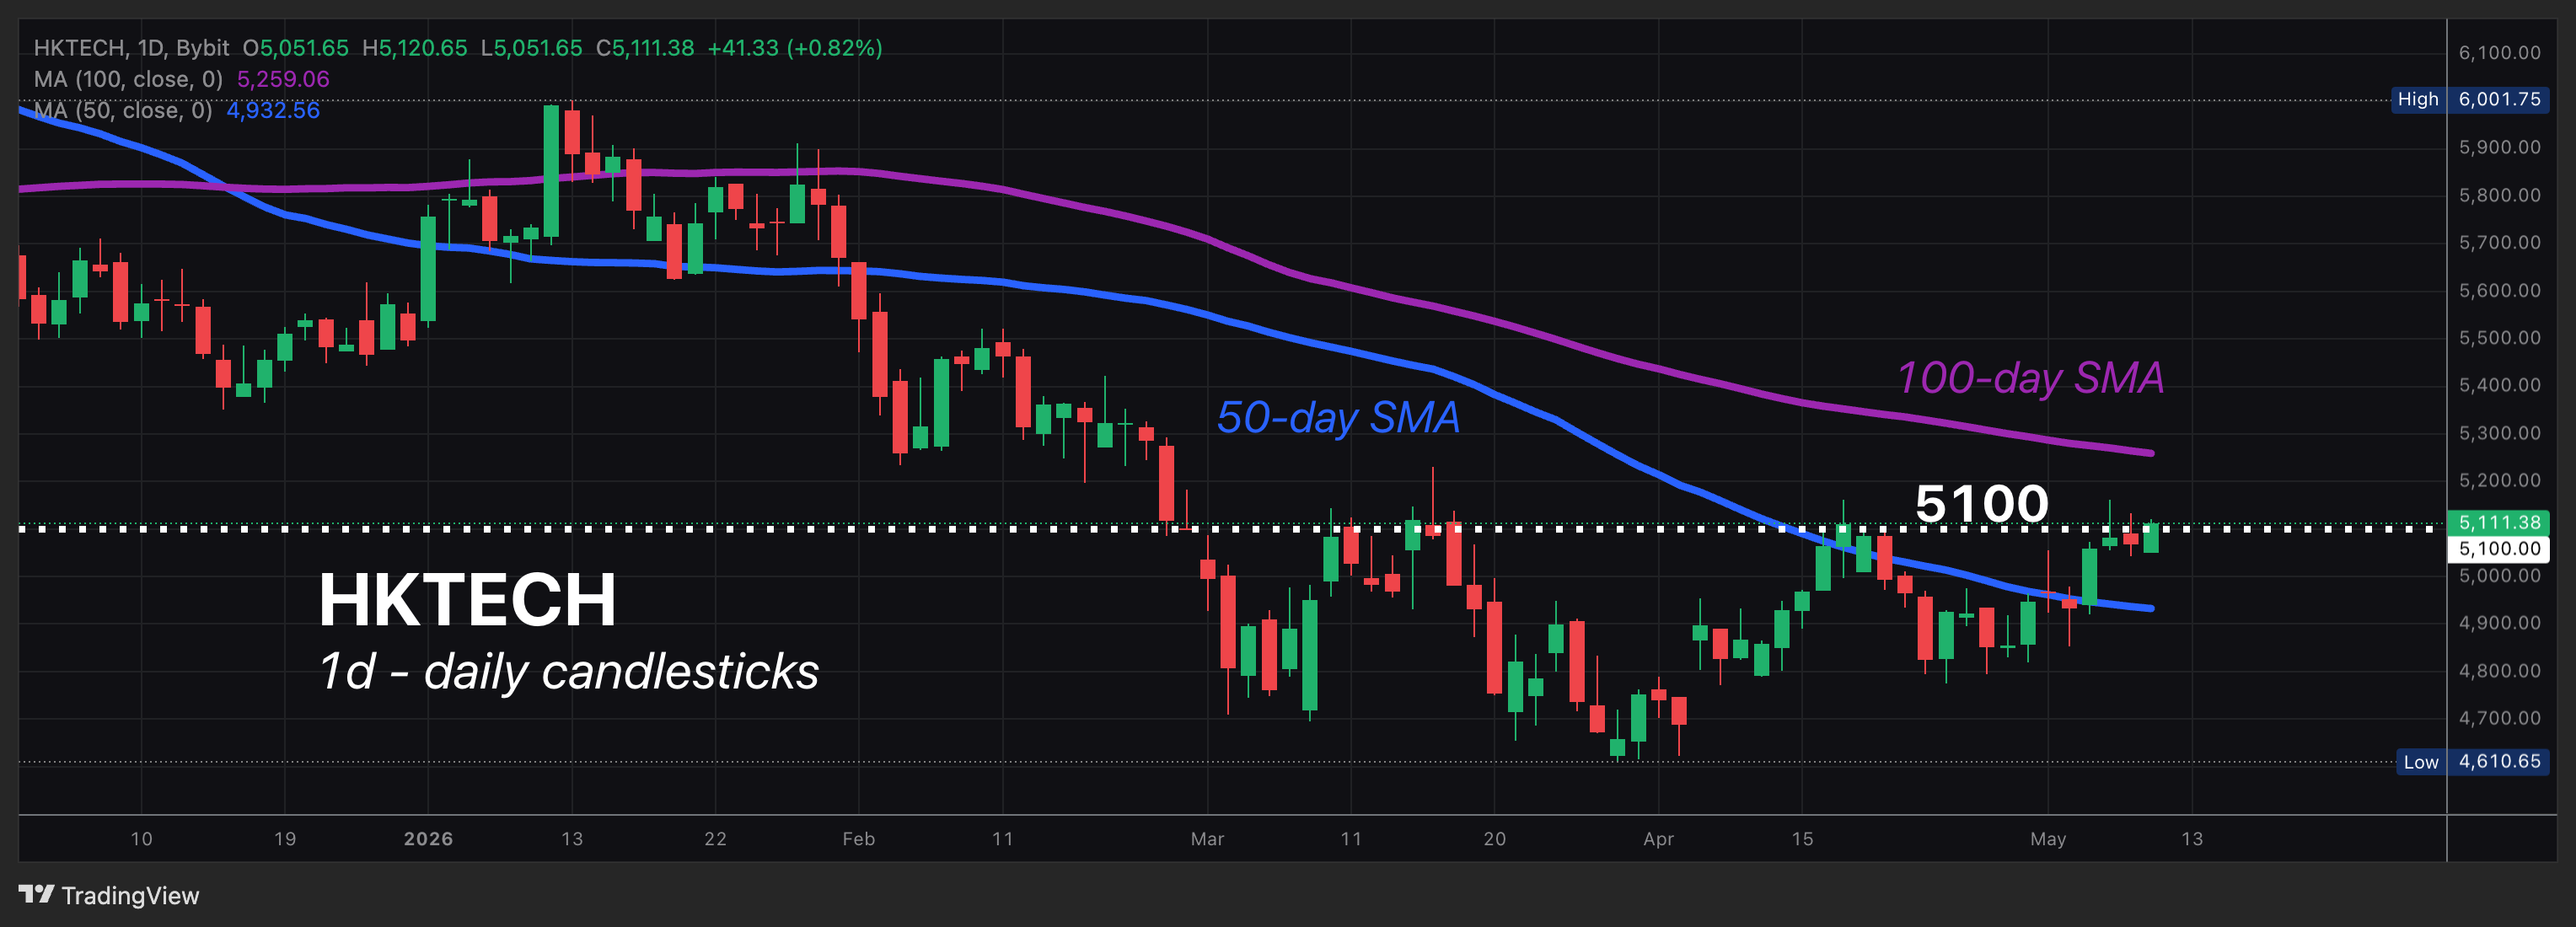
UPSIDE: A meaningful daily close above the 5100 level may see HKTECH hit a 2-month high and re-test its 100-day SMA for resistance, assuming risk-taking activities can be upheld across global markets while President Trump’s visit to China eases US-China tensions.
DOWNSIDE: Should the psychological 5100 region exert strong resistance once more - as it has on a couple of previous episodes since March - HKTECH may be dragged back down to test support around its 50-day SMA on rising risk aversion, especially if geopolitical tensions ramp up on the global stage once more.
3) SOLUSDT to hit 3-month high?
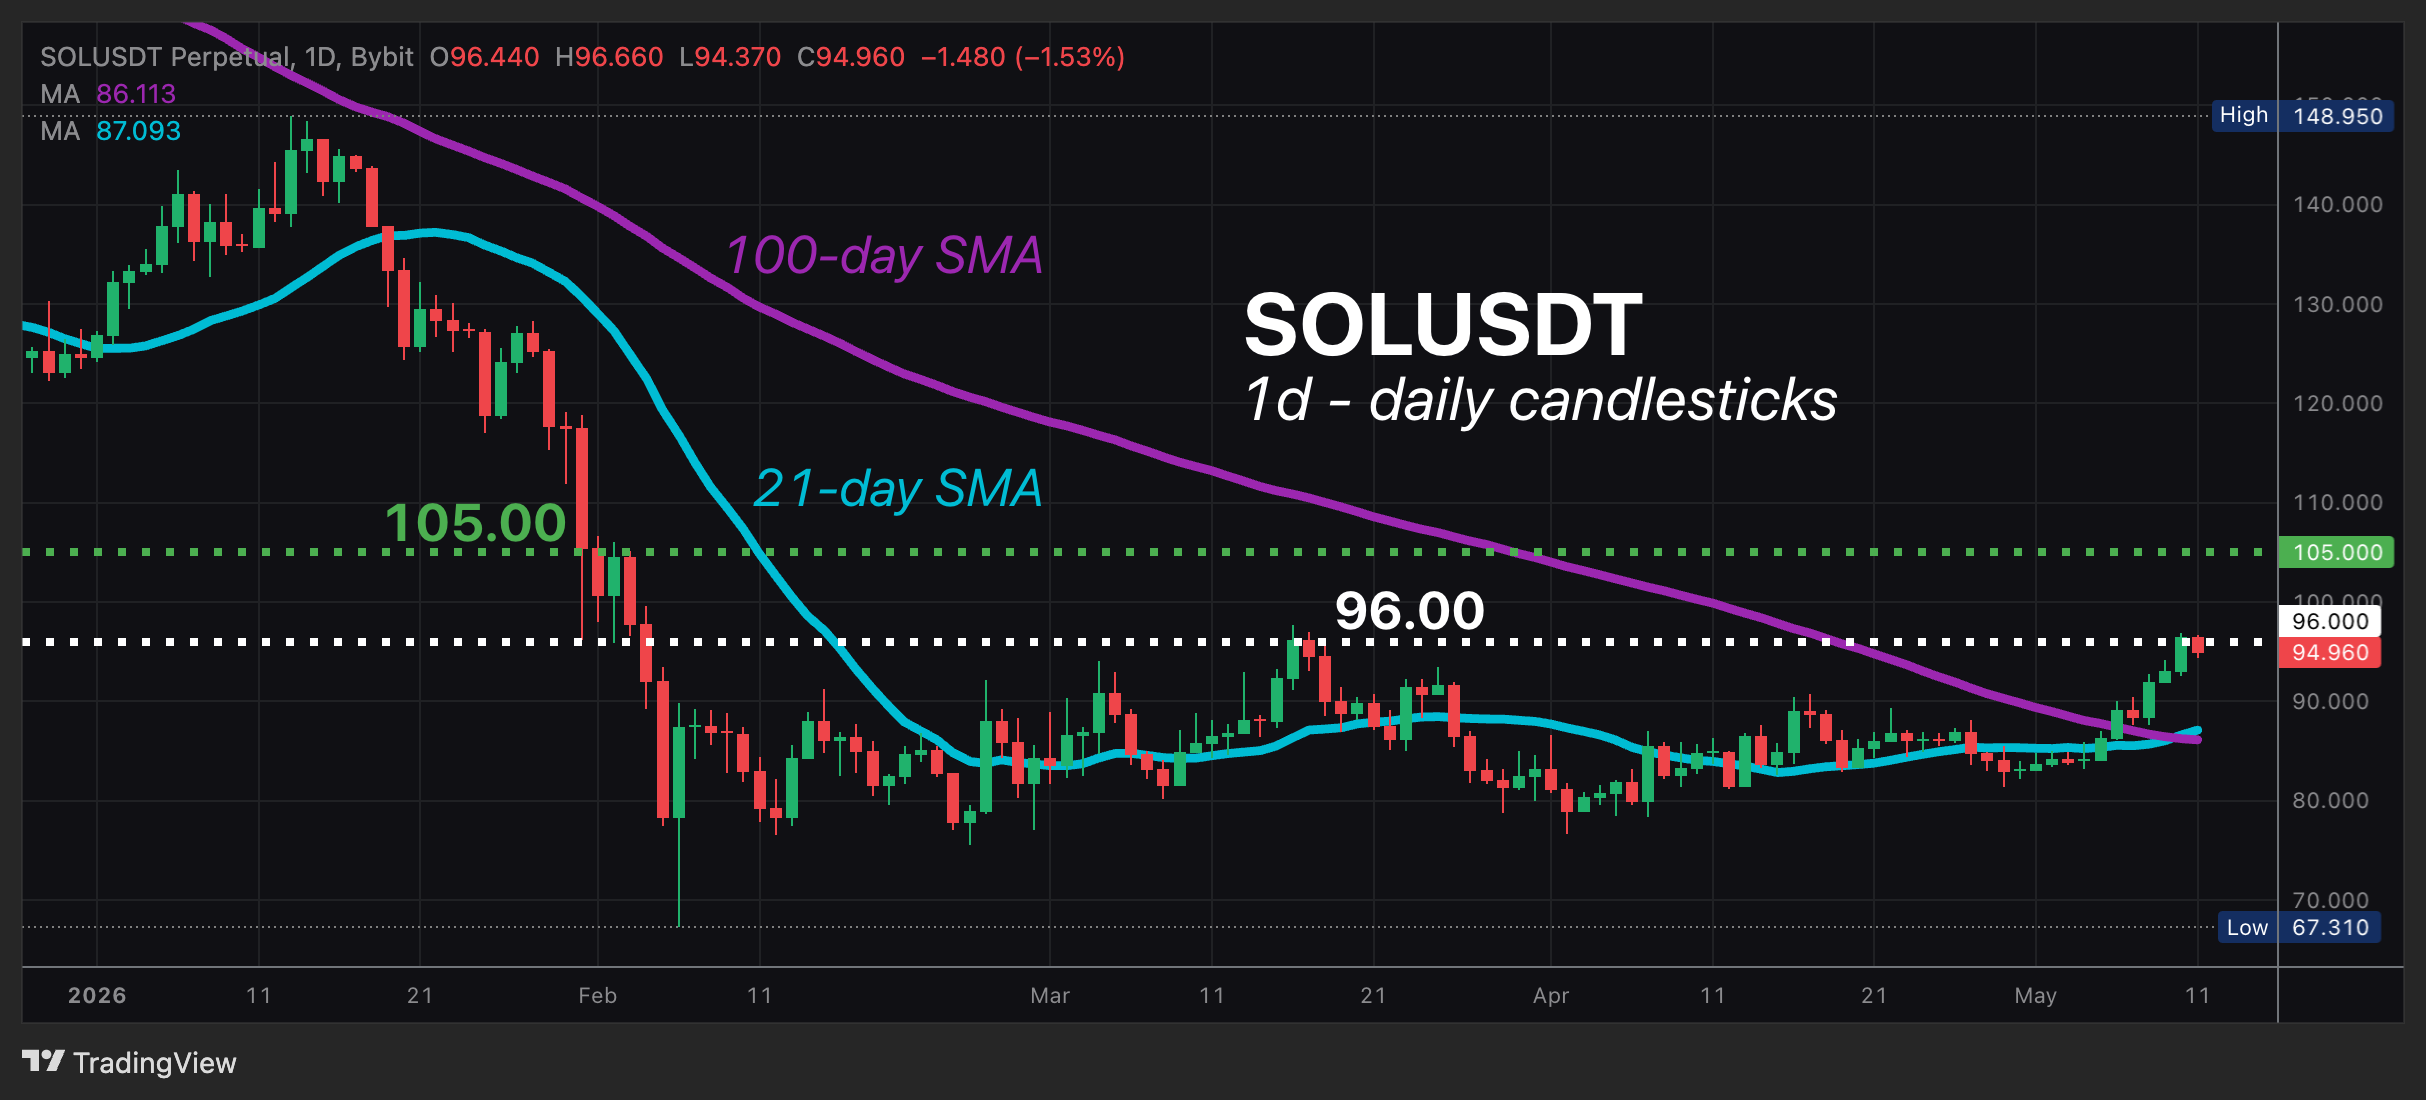
Solana bulls (those hoping prices will move higher) have once again been thwarted around the 96.00 psychological level - a key resistance level seen back in mid-March 2026.
Still, traders would note the quiet bullish signal stemming from its 21-day SMA that recently crossed above its 100-day counterpart.
Among the 10 biggest digital assets by market cap ...
Solana is the biggest gainer so far in May 2026, claiming a 13.9% month-to-date advance.
POTENTIAL SCENARIOS
UPSIDE: A meaningful daily close above the 96.00 level may see SOL print prices above $100 for the first time since early-February 2026, assuming market risk sentiment allows for altcoins to finally follow Bitcoin’s lead that has been rebounding since April.
DOWNSIDE: Should the 96 psychological level exert strong resistance once more, then SOLUSDT may re-test support around the psychological $90 level, with its 21-day and 100-day SMAs lying further south to potentially offer stronger support.
DISCLAIMER:
This article is provided for general information and reflects the author’s views only. It does not constitute investment advice, nor an offer or solicitation to buy or sell any financial instruments or digital assets. Your ability to access or use any products or services mentioned may be subject to the laws and regulatory requirements of your jurisdiction.