RECAP (Oct 12-16): Apple record high, JPMorgan hits target, Tesla rebounds off technical support - all as expected
AI Summary
Show More
Quickly grasp the article's content and gauge market sentiment in just 30 seconds!
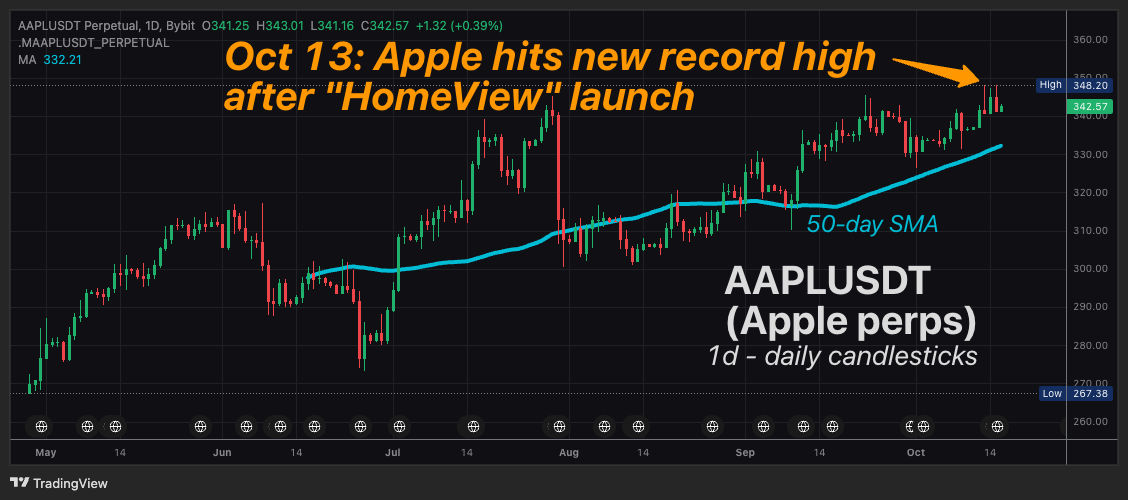
Oct 13th: Apple posts new record high after HomeView debut
Oct 13th: JPMorgan hit our upside target after its earnings release
Oct 15-16th: Tesla rebounds off 50-day SMA support following stunning Roadster launch
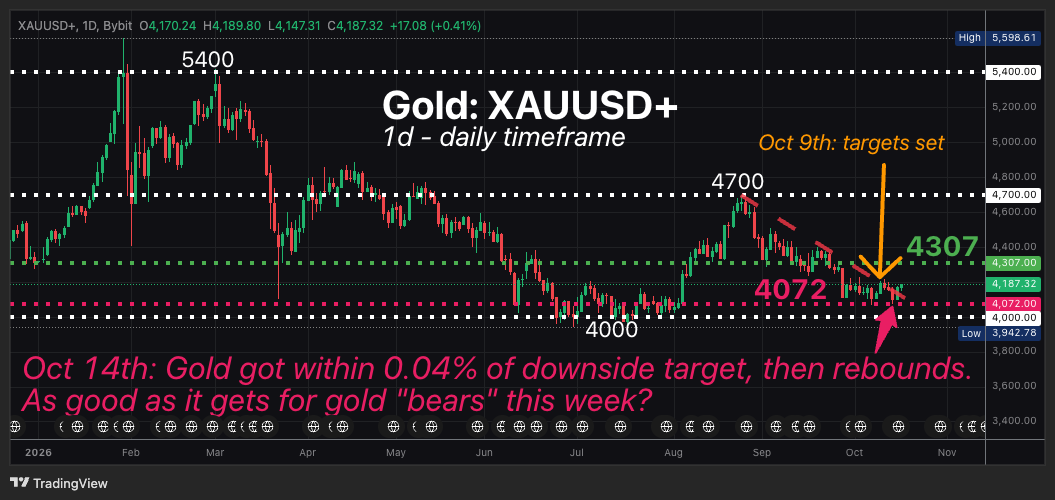
BONUS: Gold also respected (got within 0.04% - close enough) of our downside target set since Fri, Oct 9th, before rebounding
3 lessons for traders this week: (1) Read Market Pulse early, (2) Fundamentals matter, (3) Watch popular technical indicators, e.g. simple moving averages
We started the week by claiming it'll be an "eventful for big-name US stocks".
And this week 's price action delivered!
First, we recap the 3 stocks we highlighted for the week, and how they've each fulfilled their respective trade scenarios cited on Monday, October 12th:
1) Apple hits new record high - as expected!
What we wrote on Mon, Oct 12th: "UPSIDE - Apple could hit new record high ..."
AAPL chart published at start of the week:
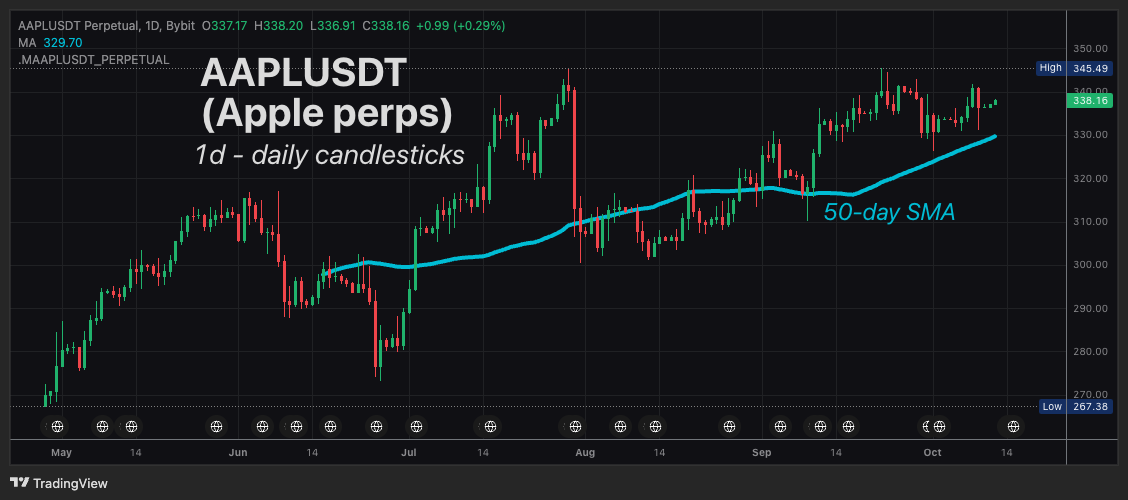
Following its launch of its "HomeView" device on Tue, Oct 13th ...
Apple stocks duly hit a new record high!
2) JPMorgan stocks respected our upside target!
What we wrote on Mon, Oct 12th: "UPSIDE: JPM could hit $342.70 ... "
JPM chart published at start of the week:
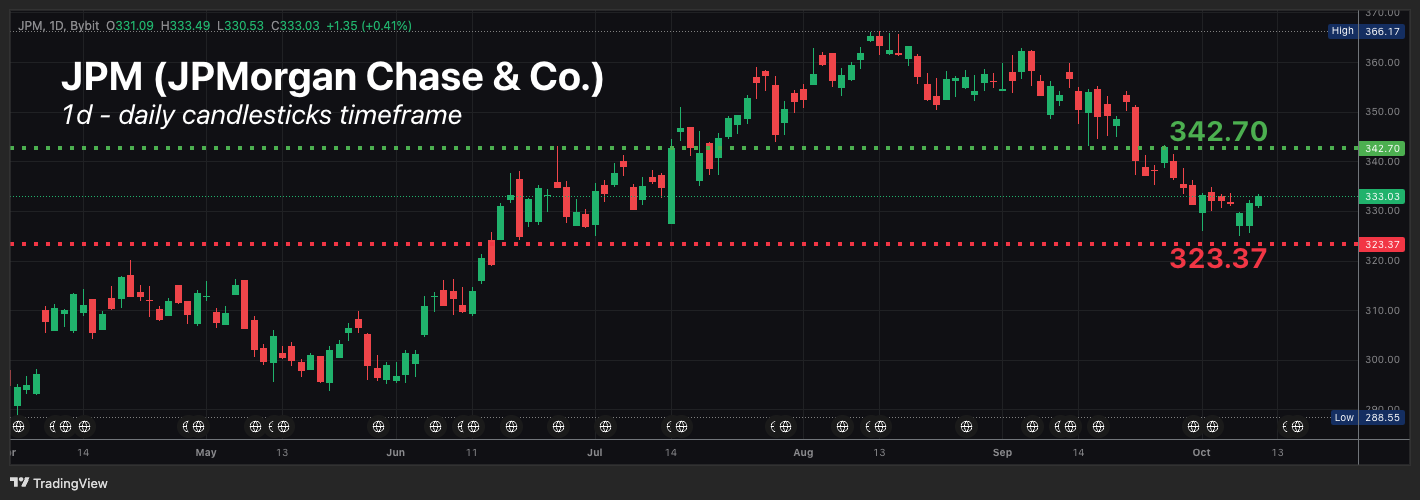
After JPMorgan's earnings announcement on Tue, Oct 13th ...
JPM duly hit the upside target we'd set the day prior (Mon, Oct 12th), briefly breaching it by a mere 0.4% / $1.48, before tumbling back down.
In other words, our upside target of $342.70 was just about as good as it got for bulls (those hoping an asset's price will rise) this week!
NOTE: And that's what we mean by "markets respected our target" i.e. prices did not move far from our target for that period (in JPMorgan's case = the daily session right after its earnings announcement).
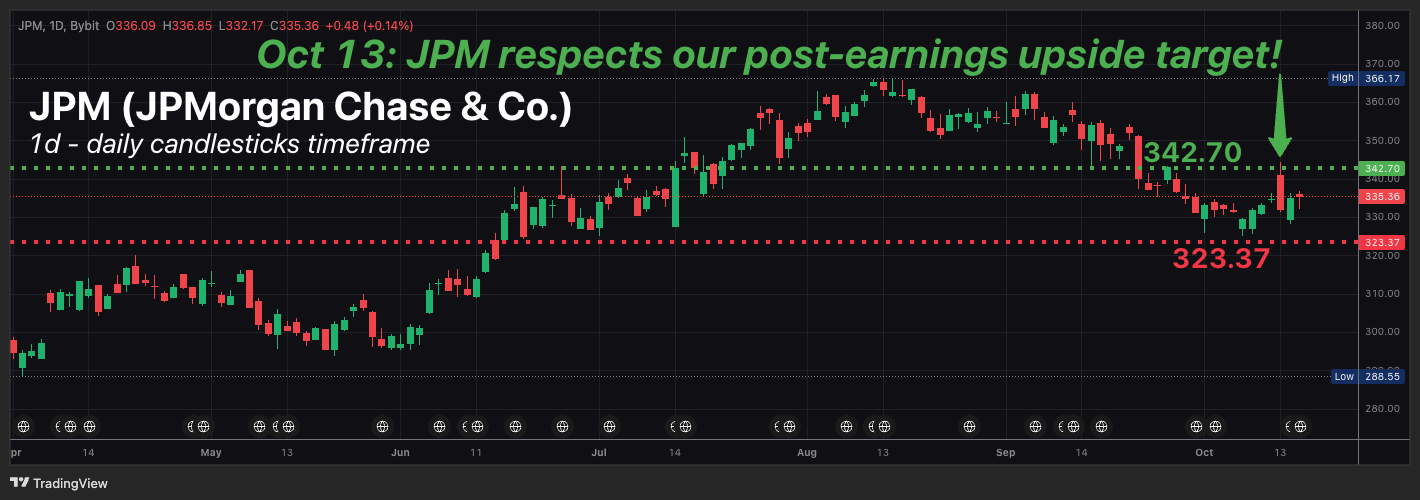
Also following its earnings release …
Wall Street experts surveyed by Bloomberg expect JPMorgan stocks to rise a further 10.7% over the next 12 months.
3) Tesla rebounds off 50-day SMA support - as expected
What we wrote on Mon, Oct 12th: "DOWNSIDE: TSLA could ... test support ... around where its 50-day SMA lies ... "
TSLA chart published at start of the week:
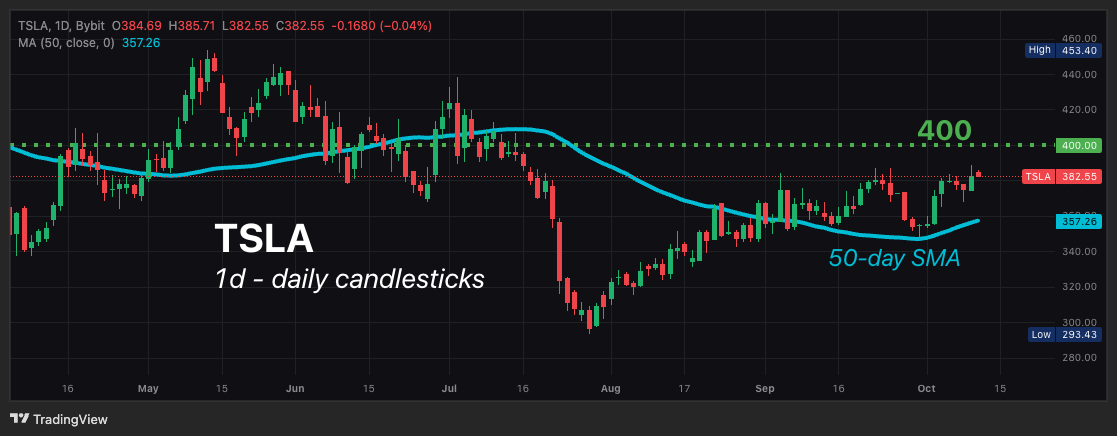
Following Tesla's stunning debut of its 2nd-gen Roadster on Thur, Oct 15th ...
TSLA duly found support at its 50-day SMA support - a key technical indicator we'd highlighted since Mon, Oct 12th - before staging a big rebound!
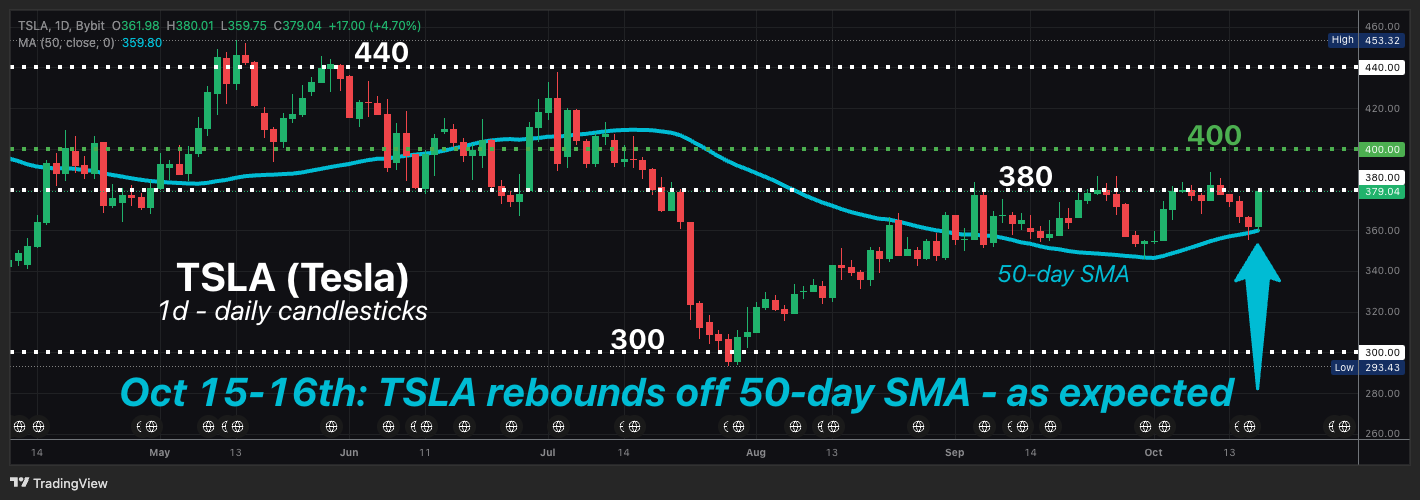
Over the next 12 months, analysts surveyed by Bloomberg predict that TSLA could rise another 11.6%.
READ MORE (published Wed, Oct 14th): "Can Tesla's "flying" Roadster help TSLA stocks soar?"
BONUS: Gold also respected our downside target set on Fri, Oct 9th
What we wrote on Fri, Oct 9th: "For the coming week (Oct 9th - 16th), Bloomberg's model predicts a 72% chance that XAUUSD will trade between $4072 - $4307."
XAUUSD+ chart published a week ago today:
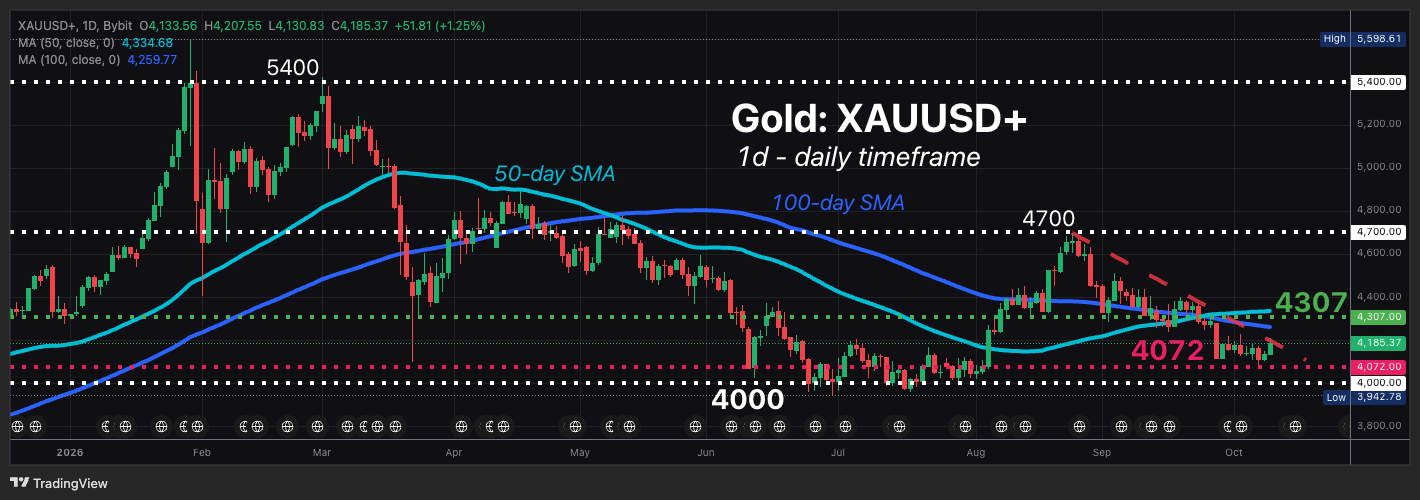
Following the hotter-than-expected US inflation data (a.k.a. consumer price index - CPI) reported on Wed, Oct 14th ...
Gold was dragged down to within 0.036% / $1.46 (close enough!) of the $4072 downside target as we'd cited on Fri, Oct 9th - per Bloomberg models.
ICYMI: This was our latest preview, published Tue, Oct 13th, of the ever-important monthly CPI data
Did you miss these big moves?
Furthermore, here are 3 quick lessons for traders that we can gleam from this week's price action:
1) Get in Early
Read our Market Pulse reports as soon as they're published.
For instance, every Monday, we highlight 3 assets to watch - for fresh, short-term, market ideas for the week.
Market Pulse aims to help traders spot potential trading/investing opportunities, while citing potential Upside and Downside scenarios that can also help guide your 'Take Profit' levels.
2) Fundamentals Matter
This week has featured big company's earnings, exciting new product launches, and even top-tier economic data releases - US inflation data.
Every investor and trader, even those who are biased towards technical analysis, cannot afford to ignore such fundamental events that occur in the real world and beyond your trading charts.
DYOR - and pay attention (and our Market Pulse reports help you do just that).
3) Watch popular technical indicators (e.g. simple moving averages)
Technical indicators can help a trader identify entry/exit points, especially widely-used indicators such as the SMA (simple moving averages).
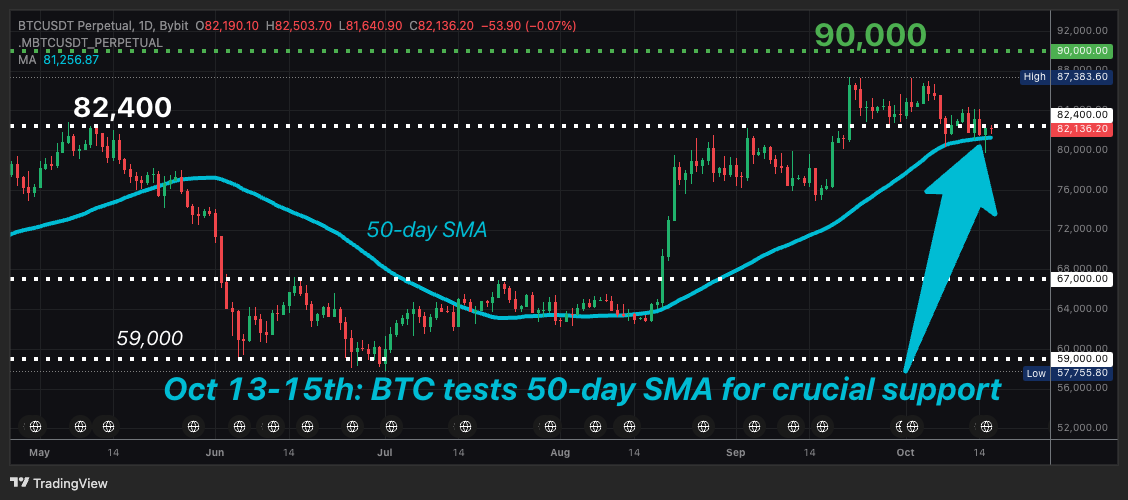
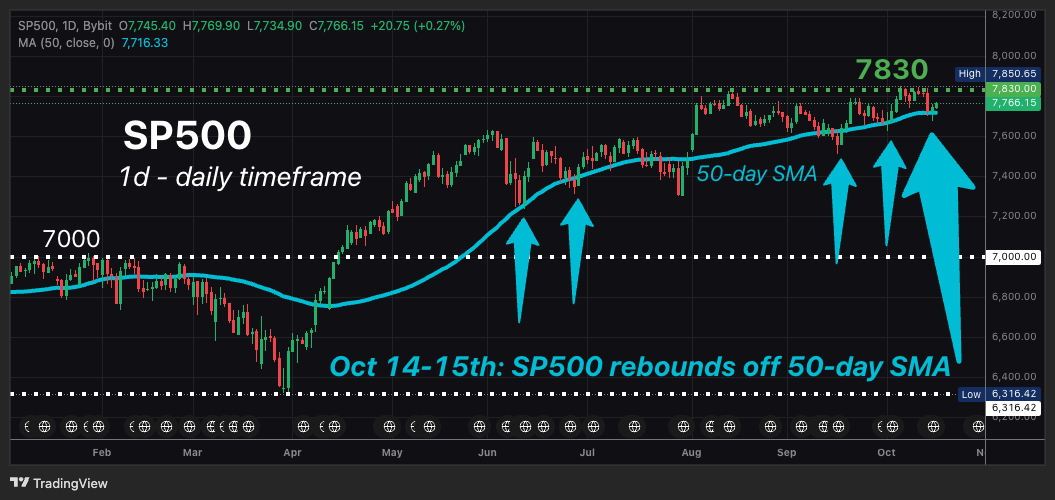
For instance, the 50-day SMA acted as crucial support not just for Tesla stocks this week, but also for other major assets such as:
Ask Bybit AI: What is a technical support level? How is it useful for traders?
Safe to say, there's been plenty of key takeaways from this week.
Be sure to keep checking back on our Market Pulse reports to stay ahead of the markets.
DISCLAIMER: This article is provided for general information purposes only and does not constitute investment advice, nor an offer or solicitation to buy or sell any financial instruments or digital assets. Past performance is not indicative of future results. Your ability to access or use any products or services mentioned may be subject to the laws and regulatory requirements of your jurisdiction.
Grab Up to 100 USDT in Rewards
Also, enjoy 555% APR on Bybit Earn products!