bigfunzd💲💲💸💸
|| analysis makes | | DeFi Trader || 📈↗️🟢🔥
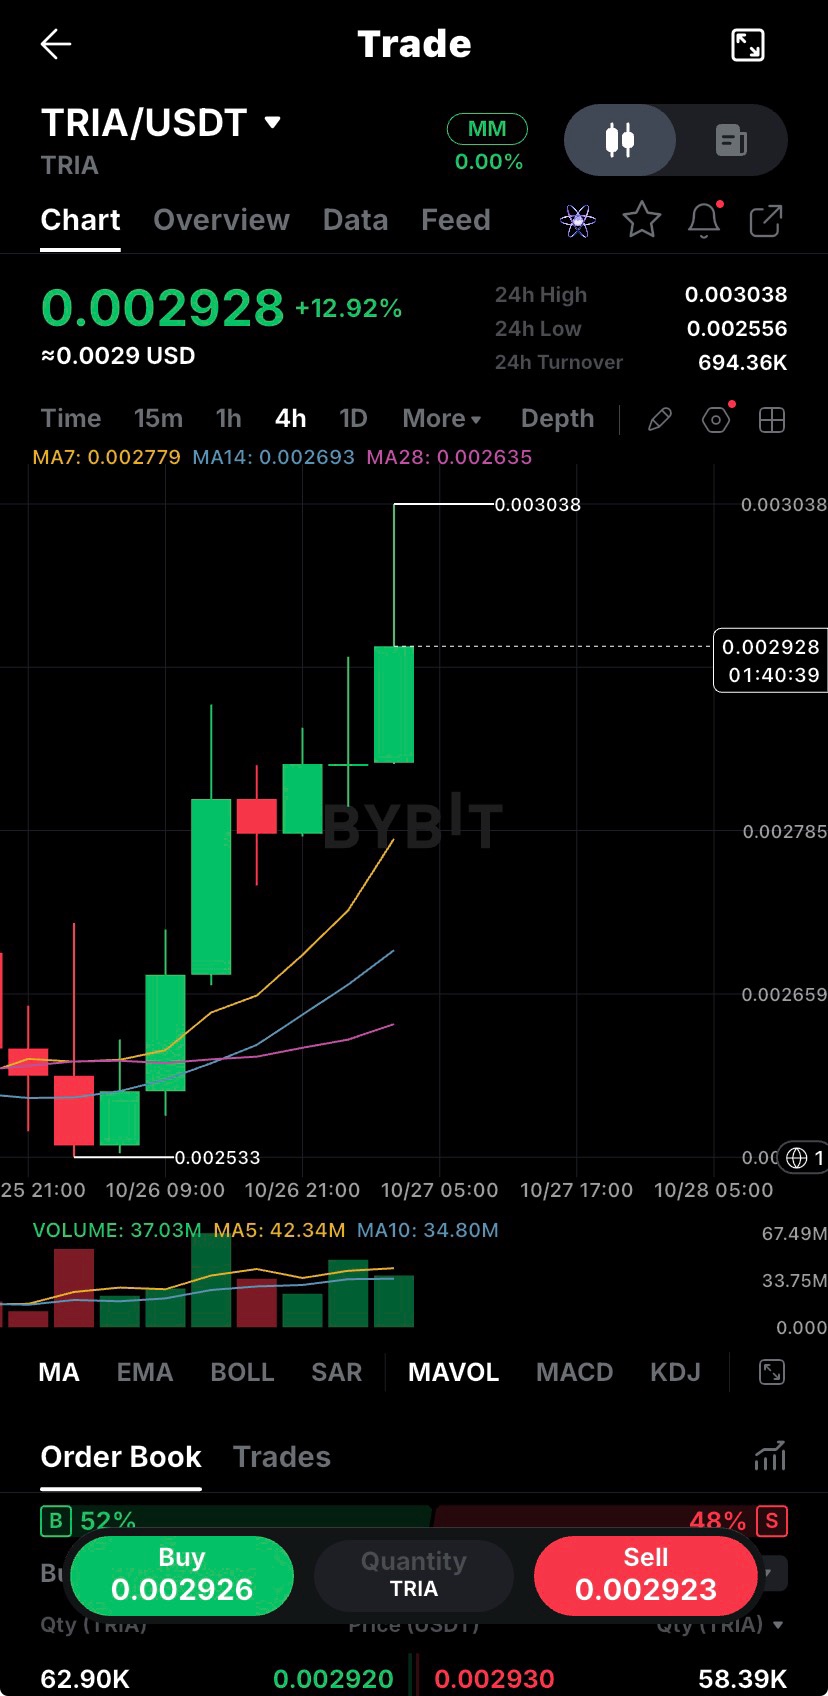
$TRIAUSDT 📈 TRIA/USDT 🟢 Market Trend TRIA is showing strong bullish momentum on the 4H timeframe. Several green candles indicate buyers are pushing the price upward. However, a pullback is possible after this sharp rise. 📊 Moving Averages * 🟡 MA7: Price is above it, showing strong short-term momentum. * 🔵 MA14: Price is above it, supporting the bullish trend. * 🟣 MA28: Price is above it, suggesting the broader short-term structure is improving. Interpretation: The moving averages support a bullish trend, but they do not guarantee continuation. 🎯 Support & Resistance * 🔴 Resistance: 0.003038 (recent high) * 🟠 Near support: 0.00285 * 🟡 Moving-average support: 0.00278–0.00269 * 🟢 Lower support: 0.002635 * ⚫ Previous low: 0.002533 These are approximate chart levels. Price may move through them before reversing. 📈 Volume Analysis * 🟢 Current displayed volume: 37.03M * 🟡 MA5 volume: 42.34M * 🔵 MA10 volume: 34.80M Volume is elevated compared with the MA10, but below the MA5. A breakout with stronger volume would provide better confirmation. ⚖️ Order Book * 🟢 Buyers: 52% * 🔴 Sellers: 48% The order book slightly favours buyers, but this ratio can change quickly and should not be used alone to predict price direction. 🔮 Possible Trading Scenarios 🟢 Bullish Scenario * 🚀 Price breaks above the recent high and closes above it on the 4H chart. * ✅ A successful retest could support further upside. * 🎯 Watch for the next resistance areas to form above the breakout. 🟡 Pullback Scenario * ↘️ Price retraces toward nearby support or the moving averages. * 👀 Look for bullish candle confirmation before considering an entry. * ⚠️ Support can fail, so avoid buying just because price reaches a level. 🔴 Bearish Scenario * ❌ Price rejects the recent high and loses nearby support. * 📉 A break below the moving averages would weaken the bullish setup. * 🛑 Reassess the trade if price forms lower highs and lower lows. 🧠 Final Verdict 🟢 Trend: Bullish 💪 Momentum: Strong ⚠️ Risk: Price may be extended after the rally 🎯 Best approach: Wait for a confirmed breakout or a pullback with a clear bullish reaction. #IMPACTbyTrade #Bybit8thAnniversary #BybitIPOExpress #MyByXTake #ByXIMPACT
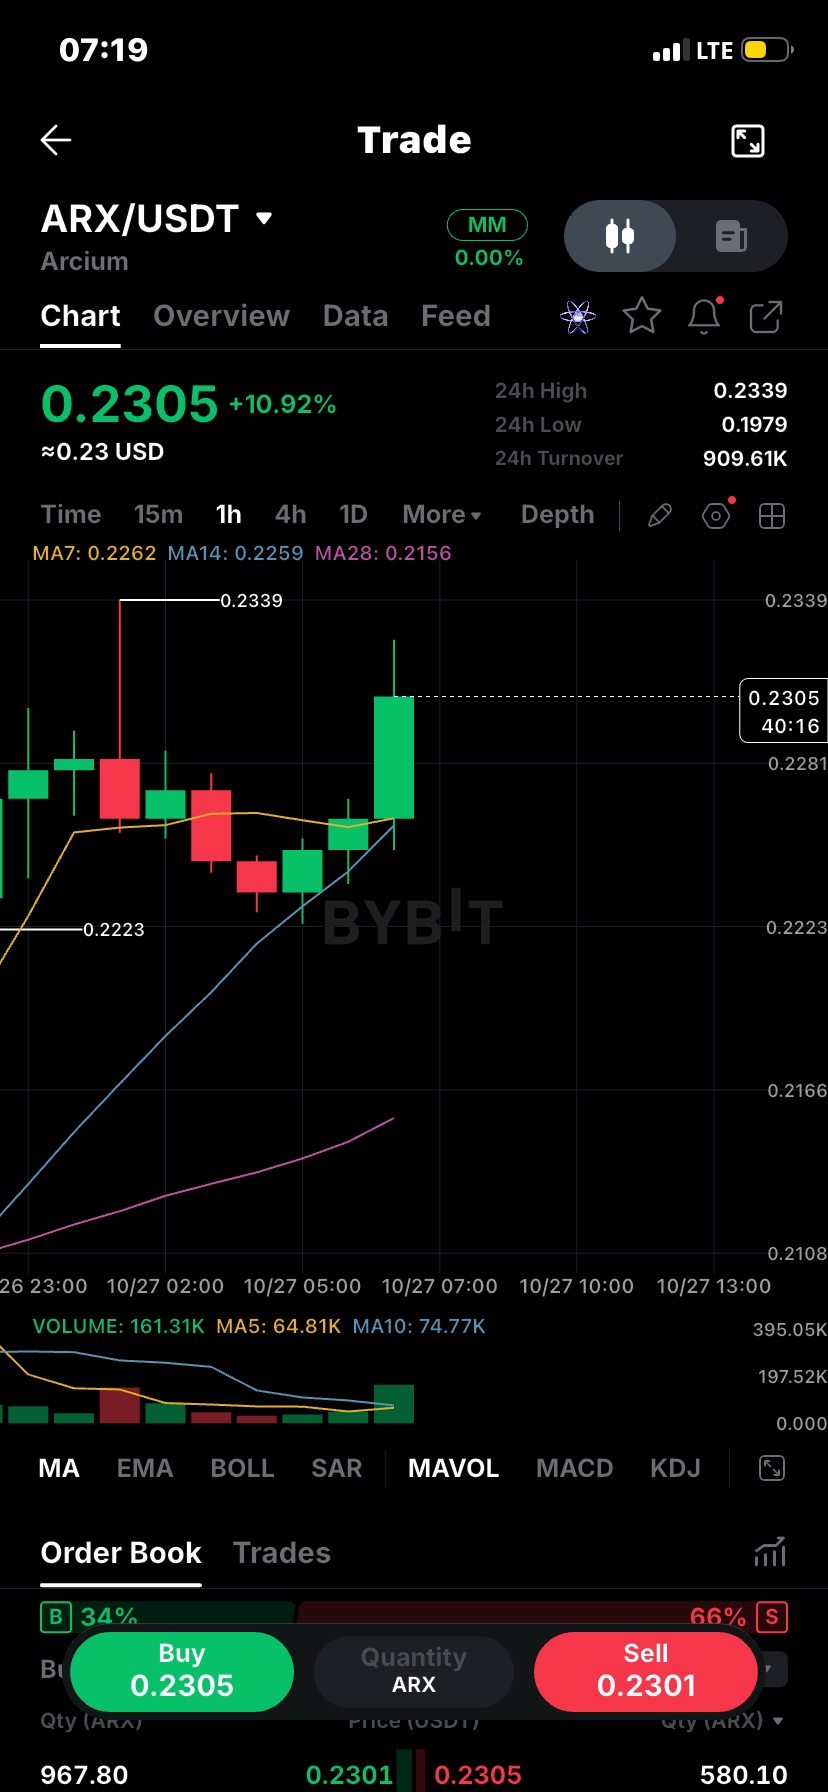
$ARXUSDT 📈 ARX/USDT Timeframe: 1H Price shown: 0.2305 USDT 24h change: +10.92% 1. Market trend ARX/USDT shows short-term bullish momentum. The latest green candle indicates strong buying pressure, but price is approaching resistance. 2. Moving averages (MA) Indicator Value MA7 0.2262 MA14 0.2259 MA28 0.2156 Price is above all three moving averages, suggesting bullish momentum. However, a pullback is possible after the sharp rise. 3. Support and resistance * Resistance: 0.2339 * Near support: 0.2281 * Moving-average support: 0.2262–0.2259 * Lower support: 0.2223 A strong breakout above 0.2339 could support further upside. Losing 0.2281 could indicate weakening momentum. 4. Volume analysis The displayed volume is 161.31K, compared with MA5 at 64.81K and MA10 at 74.77K. This suggests increased trading activity. A breakout supported by strong volume would be more convincing, but high volume can also accompany selling. 5. Order book * Buyers: 34% * Sellers: 66% The displayed order book leans toward sellers, but this alone cannot predict the next price movement. Order book quantities change quickly. 6. Possible trading scenarios 🟢 Bullish scenario * Watch for a 1H candle close above 0.2339. * Look for a successful retest before considering an entry. * Possible areas to monitor: 0.2350 and 0.2400, not confirmed resistance levels. 🟡 Pullback scenario * Watch 0.2281 and 0.2262–0.2259. * Look for bullish candle confirmation before considering a buy. 🔴 Bearish scenario * Rejection near 0.2339 followed by a break below 0.2281 could weaken the bullish setup. * Possible downside areas: 0.2260 and 0.2223. 7. Risk management Always define your entry, stop-loss, and take-profit before trading. Consider risking only 0.5–1% of your capital per trade, and be especially careful with leverage. Final verdict Bias: Short-term bullish, but resistance is close. The strongest bullish confirmation would be a 1H candle closing above 0.2339 with good volume. Avoid chasing the current green candle without confirmation. This analysis is based on your screenshot, not live market data. These levels are approximate and are not guaranteed trading signals. For a more accurate analysis, send me the updated 4H, 1H, and 15m charts. #WSOT2026 #IMPACTbyTrade #AnthropicS1Filing #MyByXTake #FOMCRateDecision $SOLUSDT
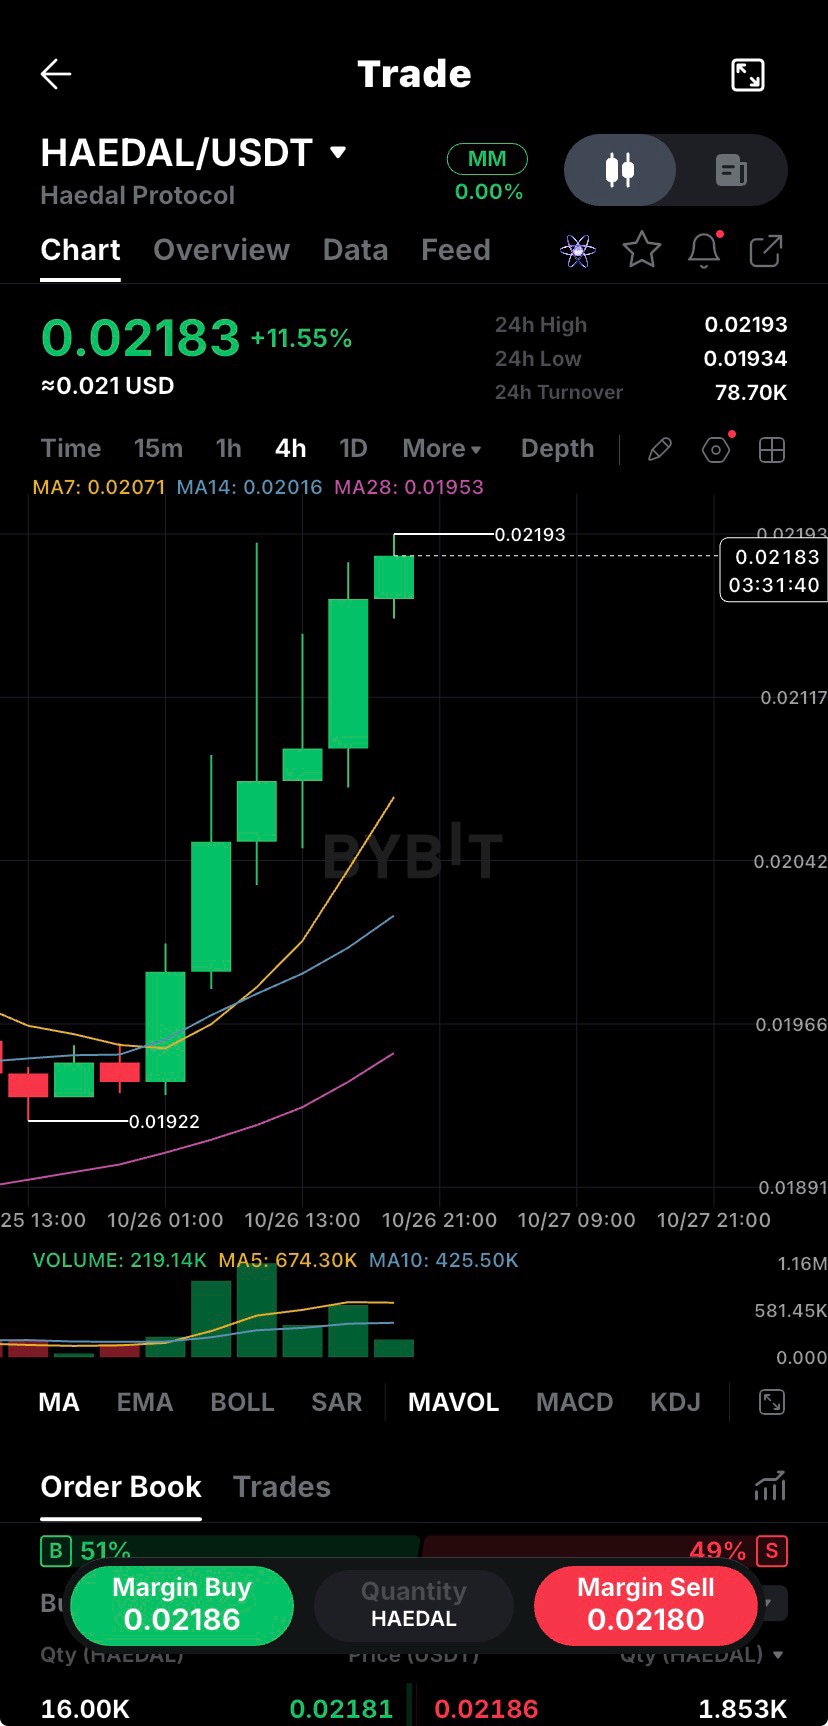
$HAEDALUSDT 📊 HAEDAL/USDT Analysis 📈 Market Structure → Strong 4H breakout from $0.01922 to $0.02183. Price is above MA7, MA14 and MA28. ⚡ Momentum → Bullish candles confirm buying pressure, but volume is fading after the initial surge. ⚠️ Risk → Resistance at $0.02193. A rejection could trigger a short-term pullback. 🎯 Key Levels * Resistance: $0.02193–$0.02220 * Support: $0.02117 * Pullback zone: $0.02070–$0.02100 * Invalidation: Below $0.01990 Execution * Breakout: 4H close above $0.02193 with stronger volume. * Pullback: Watch for support confirmation before entry. * Avoid chasing price directly into resistance. 💡 Edge Insight: HAEDAL is in a strong expansion phase, but the next move depends on whether buyers can sustain volume above resistance. #WSOT2026 #AnthropicS1Filing #IMPACTbyTrade #MyByXTake #Bybit8thAnniversary $DOGEUSDT
$FIGHTUSDT 📊 $FIGHT/USDT 📈 Market Structure → Last Price: $0.003715 (+11.13%) → Strong bullish expansion with consecutive green candles → Price remains above MA7 ($0.003523), MA14 ($0.003439) and MA28 ($0.003328) ⚡ Momentum → Buyers maintain control after the breakout → Resistance at $0.003801 is the immediate test → Upper wick signals potential selling pressure 📊 Volume → Current: 3.09M → MA5: 3.54M | MA10: 2.55M → Volume exceeds MA10 but trails MA5, suggesting momentum needs fresh participation ⚠️ Risk → Chasing near resistance risks a pullback → Losing $0.00365 could weaken short-term structure 🎯 Key Levels → Resistance: $0.003801 → Support: $0.003651 / $0.003523 → Major support: $0.003439 ⚡ Execution → Trigger: Break and hold above $0.003801 → Invalidation: Loss of $0.003523 → Target: Higher liquidity if breakout confirms 💡 Edge FIGHT has bullish structure, but volume is not accelerating with the latest candle. A confirmed breakout matters more than the current +11.13% move. Avoid chasing until buyers prove they can clear resistance. #WSOT2026 #AnthropicS1Filing #MyByXTake #IMPACTbyTrade #Bybit8thAnniversary $BTCUSDT
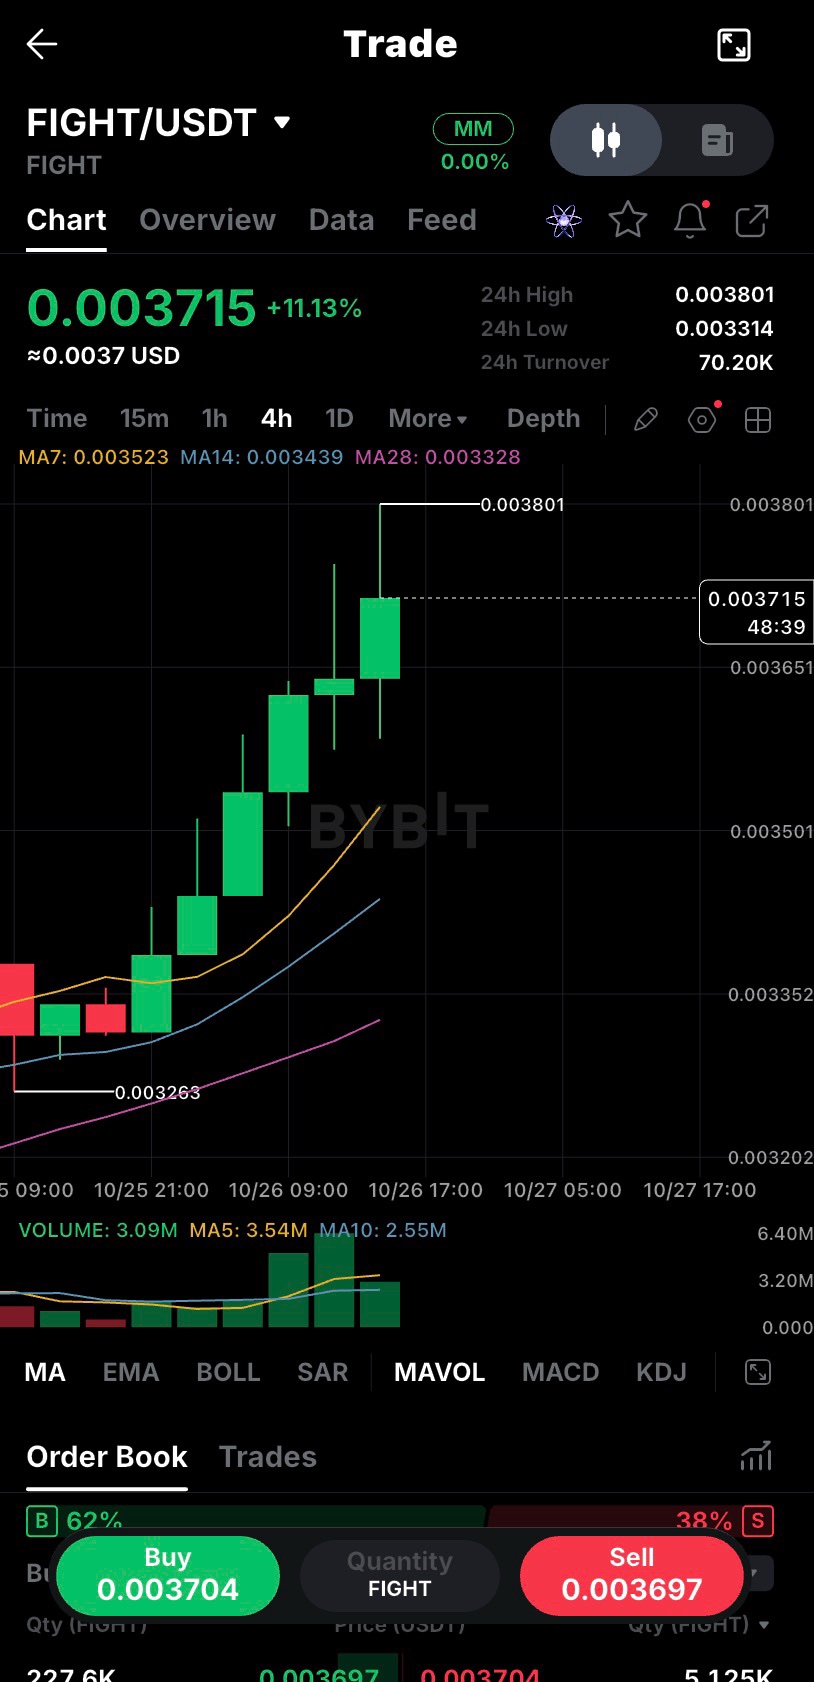
$VERONAUSDT 📊 VERONA/USDT — Professional Technical Analysis (4H) VERONA/USDT Bullish momentum $0.11802 +14.25% 24H high: $0.13279 · 24H low: $0.10316 · Timeframe: 4H 1. Market structure and trend * VERONA has made a strong bullish move after consolidating around the $0.106–$0.110 area. * The latest 4H candle shows a sharp upward expansion, pushing price to $0.11802. * Price is trading above MA7 ($0.10994), MA14 ($0.10639), and MA28 ($0.10593), confirming strong short-term bullish structure. * However, the long upper wick reaching $0.13279 shows that sellers have previously rejected higher prices. That level is important resistance. 2. Price action and volume * Bullish signal: The latest green candle has a strong body and is supported by a major volume increase. * Volume: Approximately 1.14M, compared with MA5 volume of 348.55K and MA10 volume of 294.99K. This suggests increased participation in the breakout. * Caution: The sharp move has already extended well above the moving averages. A pullback or sideways consolidation would be normal. * The current candle has not closed yet, so wait for the 4H close to confirm whether buyers can maintain control. 3. Key support and resistance Level Price Importance Resistance 3 $0.13279 Recent high Resistance 2 $0.12528 Potential upside barrier Resistance 1 $0.12000–$0.12200 Near-term resistance zone Current price $0.11802 Current market Support 1 $0.11400–$0.11500 Potential pullback zone Support 2 $0.10994 MA7 support Support 3 $0.10639 MA14 support Major support $0.10286 Visible swing-low area These are chart-based reference zones, not guaranteed turning points. 4. Moving-average analysis * MA7: $0.10994 * MA14: $0.10639 * MA28: $0.10593 The price is above all three moving averages, and MA7 is above MA14 and MA28. This alignment supports the bullish trend. If price holds above $0.110, buyers retain a stronger short-term structure. A sustained move below $0.1064 would weaken the bullish outlook. 5. Trading plan Setup A — Pullback entry Preferred Avoid chasing the large green candle. Wait for price to revisit support and show bullish confirmation. Entry zone $0.1140–$0.1150 Stop-loss $0.1110 TP1 $0.1200 TP2 $0.1250 TP3 $0.1320 Illustrative risk/reward from a $0.1145 entry: approximately 1:1.8 to TP1, 1:3.5 to TP2, and 1:5.8 to TP3, before fees and slippage. Setup B — Breakout entry * Wait for a strong 4H close above $0.1200–$0.1220. * Prefer a successful retest of the breakout zone before entering. * Potential targets: $0.12528, then $0.13279. * Invalidation: A return below the breakout zone; set the stop according to the retest structure. 6. Bullish and bearish scenarios * Bullish continuation: A confirmed break above $0.120–$0.122 with sustained volume could open the way toward $0.12528 and $0.13279. * Consolidation: Price may move sideways between $0.114 and $0.120 while the market absorbs the recent rally. * Bearish pullback: Losing $0.10994 could lead to a test of $0.10639. A break below that area would weaken the current bullish structure. ⚠️ Final verdict VERONA is bullish in the short term, but entering immediately at $0.11802 carries elevated risk. My preferred approach is to wait for a pullback toward $0.1140–$0.1150 with confirmation, or a confirmed breakout and retest above $0.1200–$0.1220. The $0.13279 high is the major upside level to watch. Use a stop-loss and keep position size small. The displayed order-book imbalance is only a snapshot and should not be treated as proof that price will continue rising. #WSOT2026 #AnthropicS1Filing #MyByXTake #IMPACTbyTrade #Bybit8thAnniversary $MNTUSDT
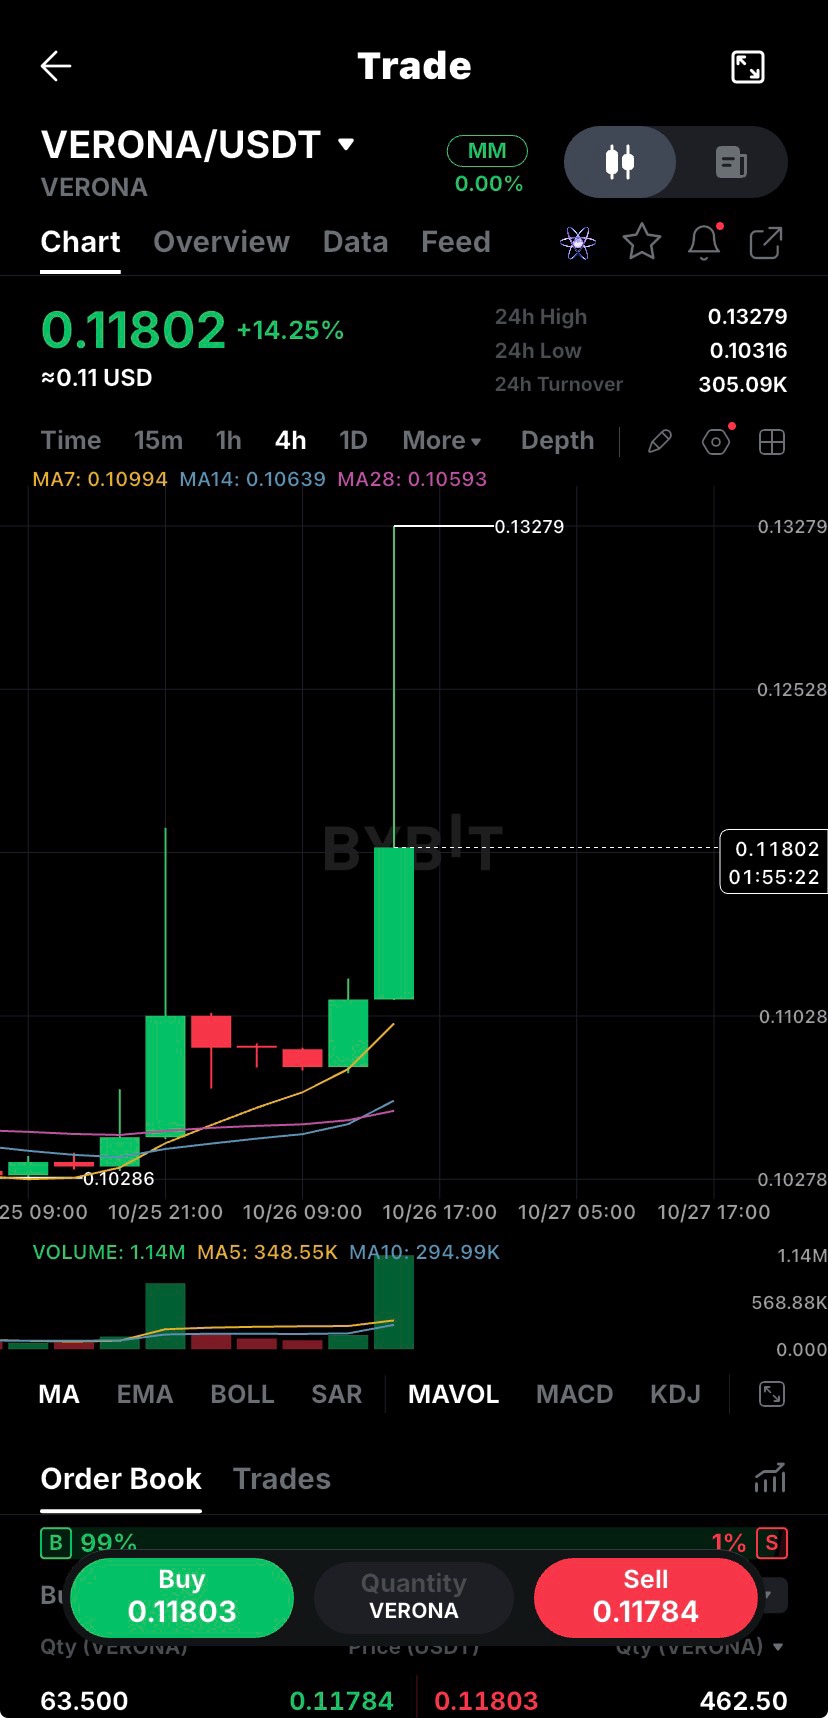
$ERAUSDT 📊 ERA/USDT – Professional Technical Analysis (4H Chart) Current Price: $0.08749 | 24H Change: +18.45% Market Bias: Bullish, but facing resistance after a strong upward move. 🔍 1. Market Structure & Trend * ERA has recovered from the $0.07149 area and formed a series of higher lows followed by strong bullish candles. * Price is trading above all three moving averages, showing that short-term buyers currently have control. * The recent spike toward $0.10048 indicates strong buying interest, but the rejection from that high shows that sellers are active at higher prices. * The latest candles suggest a recovery after a pullback, although continuation is not yet confirmed. 📈 2. Price Action * Current price is $0.08749, with immediate resistance around $0.08819. * The market previously pushed toward $0.10048 before correcting sharply. * Buyers have stepped back in after the pullback, but price needs to break nearby resistance to regain stronger momentum. * Avoid chasing the price after a large move without confirmation. 🎯 3. Key Support & Resistance Support levels * $0.08340 — MA7 support. * $0.08150 — MA14 support. * $0.07870 — previous price-action support. * $0.07728 — MA28 support. * $0.07149 — major visible swing low. Resistance levels * $0.08820 — immediate resistance. * $0.09320 — next potential resistance. * $0.10048 — major recent high. 📊 4. Volume Analysis * The breakout was accompanied by a significant increase in volume, supporting the initial upward move. * Current volume is around 1.59M, below the displayed MA5 volume of 2.82M and MA10 volume of 2.50M. * This suggests that buying activity has cooled from its peak. A fresh breakout would be more convincing if volume expands again. 📉 5. Moving Average Alignment * MA7: $0.08341 * MA14: $0.08150 * MA28: $0.07728 The moving averages are aligned bullishly, with MA7 above MA14 and MA14 above MA28. Price remains above all three, supporting the bullish structure. A sustained move below MA14 would weaken the short-term outlook. 🚀 6. Trading Plan Setup A: Pullback Entry Preferred Wait for price to revisit support and show a bullish reaction. * Entry: $0.08350–$0.08500 * Stop-loss: $0.08080 * TP1: $0.08820 * TP2: $0.09320 * TP3: $0.09800 Setup B: Breakout Entry Wait for a strong 4H close above $0.08820, ideally followed by a successful retest. * Entry: $0.08830–$0.08900 after confirmation * Stop-loss: $0.08580 * TP1: $0.09320 * TP2: $0.09700 * TP3: $0.10048 These are conditional plans, not confirmed entries. The breakout setup requires confirmation, and the pullback setup requires support to hold. ⚠️ 7. Risk Assessment * Bullish scenario: A break above $0.08820 with stronger volume could open the way toward $0.09320 and potentially $0.10048. * Neutral scenario: Price consolidates between $0.08340 and $0.08820 before choosing a direction. * Bearish scenario: A break below $0.08150 could expose $0.07870 and weaken the recovery. The order book shows more displayed buy-side percentage than sell-side percentage, but this is only a snapshot and can change quickly. It should not be treated as confirmation of future price direction. ✅ Final Verdict ERA is bullish on the 4H chart, but confirmation is still needed. * Best approach: Wait for a pullback toward $0.08350–$0.08500 or a confirmed breakout above $0.08820. * Main upside target: $0.09320, followed by $0.10048. * Key invalidation area: Below $0.08150, with the exact stop depending on your entry. My preference: The pullback setup offers a more controlled entry than buying directly into resistance. Risk only a small portion of your trading capital, because sharp reversals are common after rapid rallies. #WSOT2026 #IMPACTbyTrade #AnthropicS1Filing #MidtermsMarketWatch #MyByXTake $DOGEUSDT
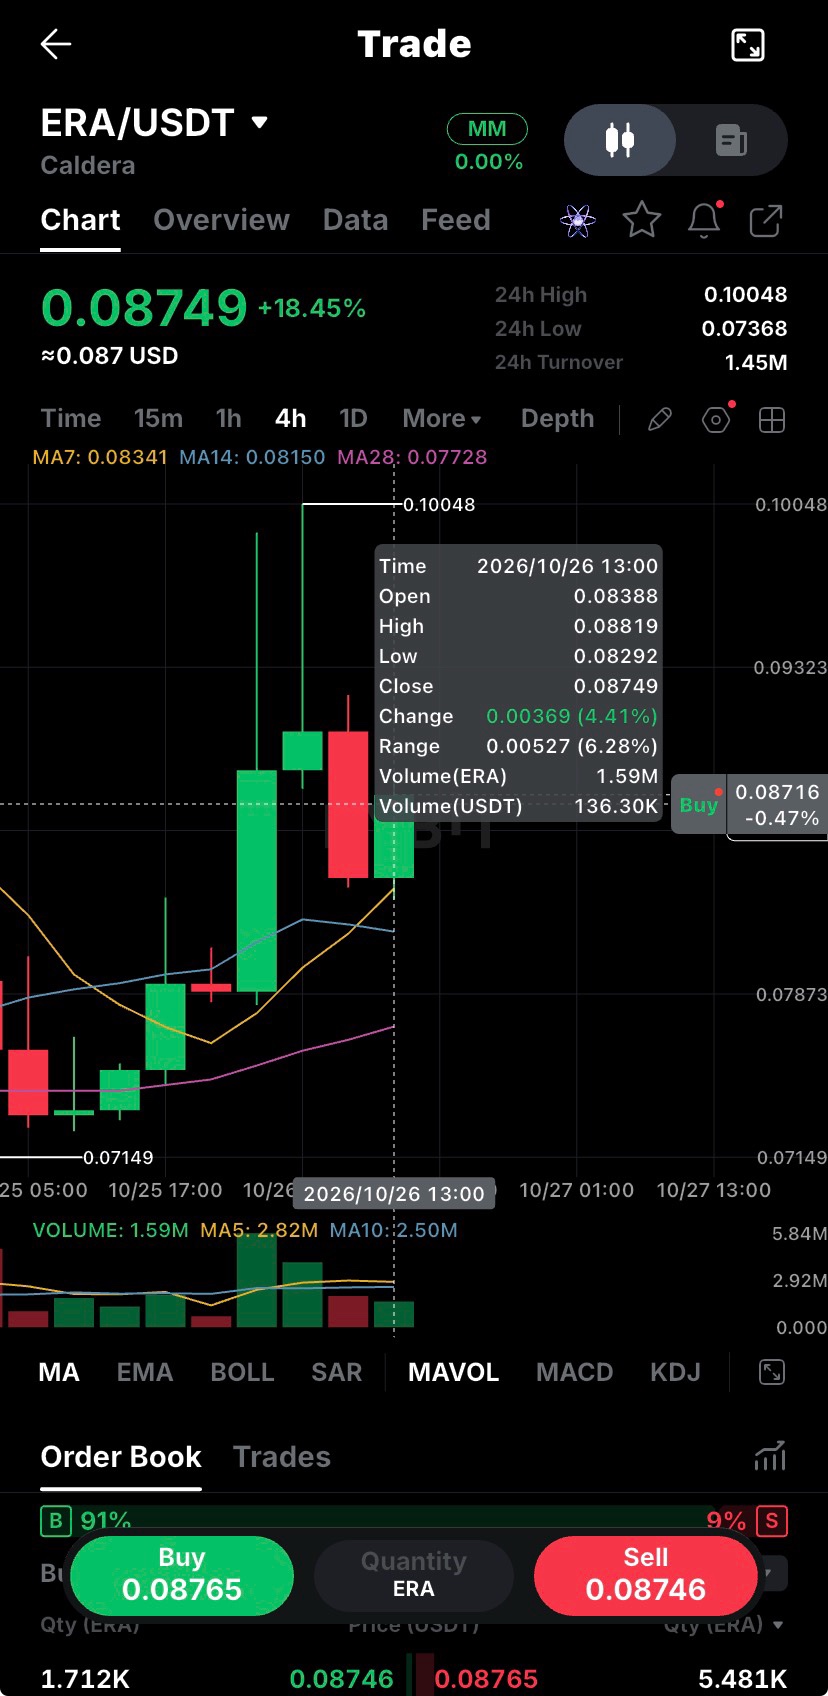
$ERAUSDT 📊 ERA/USDT – Professional Technical Analysis (4H Chart) Current Price: $0.08749 | 24H Change: +18.45% Market Bias: Bullish, but facing resistance after a strong upward move. 🔍 1. Market Structure & Trend * ERA has recovered from the $0.07149 area and formed a series of higher lows followed by strong bullish candles. * Price is trading above all three moving averages, showing that short-term buyers currently have control. * The recent spike toward $0.10048 indicates strong buying interest, but the rejection from that high shows that sellers are active at higher prices. * The latest candles suggest a recovery after a pullback, although continuation is not yet confirmed. 📈 2. Price Action * Current price is $0.08749, with immediate resistance around $0.08819. * The market previously pushed toward $0.10048 before correcting sharply. * Buyers have stepped back in after the pullback, but price needs to break nearby resistance to regain stronger momentum. * Avoid chasing the price after a large move without confirmation. 🎯 3. Key Support & Resistance Support levels * $0.08340 — MA7 support. * $0.08150 — MA14 support. * $0.07870 — previous price-action support. * $0.07728 — MA28 support. * $0.07149 — major visible swing low. Resistance levels * $0.08820 — immediate resistance. * $0.09320 — next potential resistance. * $0.10048 — major recent high. 📊 4. Volume Analysis * The breakout was accompanied by a significant increase in volume, supporting the initial upward move. * Current volume is around 1.59M, below the displayed MA5 volume of 2.82M and MA10 volume of 2.50M. * This suggests that buying activity has cooled from its peak. A fresh breakout would be more convincing if volume expands again. 📉 5. Moving Average Alignment * MA7: $0.08341 * MA14: $0.08150 * MA28: $0.07728 The moving averages are aligned bullishly, with MA7 above MA14 and MA14 above MA28. Price remains above all three, supporting the bullish structure. A sustained move below MA14 would weaken the short-term outlook. 🚀 6. Trading Plan Setup A: Pullback Entry Preferred Wait for price to revisit support and show a bullish reaction. * Entry: $0.08350–$0.08500 * Stop-loss: $0.08080 * TP1: $0.08820 * TP2: $0.09320 * TP3: $0.09800 Setup B: Breakout Entry Wait for a strong 4H close above $0.08820, ideally followed by a successful retest. * Entry: $0.08830–$0.08900 after confirmation * Stop-loss: $0.08580 * TP1: $0.09320 * TP2: $0.09700 * TP3: $0.10048 These are conditional plans, not confirmed entries. The breakout setup requires confirmation, and the pullback setup requires support to hold. ⚠️ 7. Risk Assessment * Bullish scenario: A break above $0.08820 with stronger volume could open the way toward $0.09320 and potentially $0.10048. * Neutral scenario: Price consolidates between $0.08340 and $0.08820 before choosing a direction. * Bearish scenario: A break below $0.08150 could expose $0.07870 and weaken the recovery. The order book shows more displayed buy-side percentage than sell-side percentage, but this is only a snapshot and can change quickly. It should not be treated as confirmation of future price direction. ✅ Final Verdict ERA is bullish on the 4H chart, but confirmation is still needed. * Best approach: Wait for a pullback toward $0.08350–$0.08500 or a confirmed breakout above $0.08820. * Main upside target: $0.09320, followed by $0.10048. * Key invalidation area: Below $0.08150, with the exact stop depending on your entry. My preference: The pullback setup offers a more controlled entry than buying directly into resistance. Risk only a small portion of your trading capital, because sharp reversals are common after rapid rallies. #WSOT2026 #IMPACTbyTrade #AnthropicS1Filing #MidtermsMarketWatch #MyByXTake $DOGEUSDT
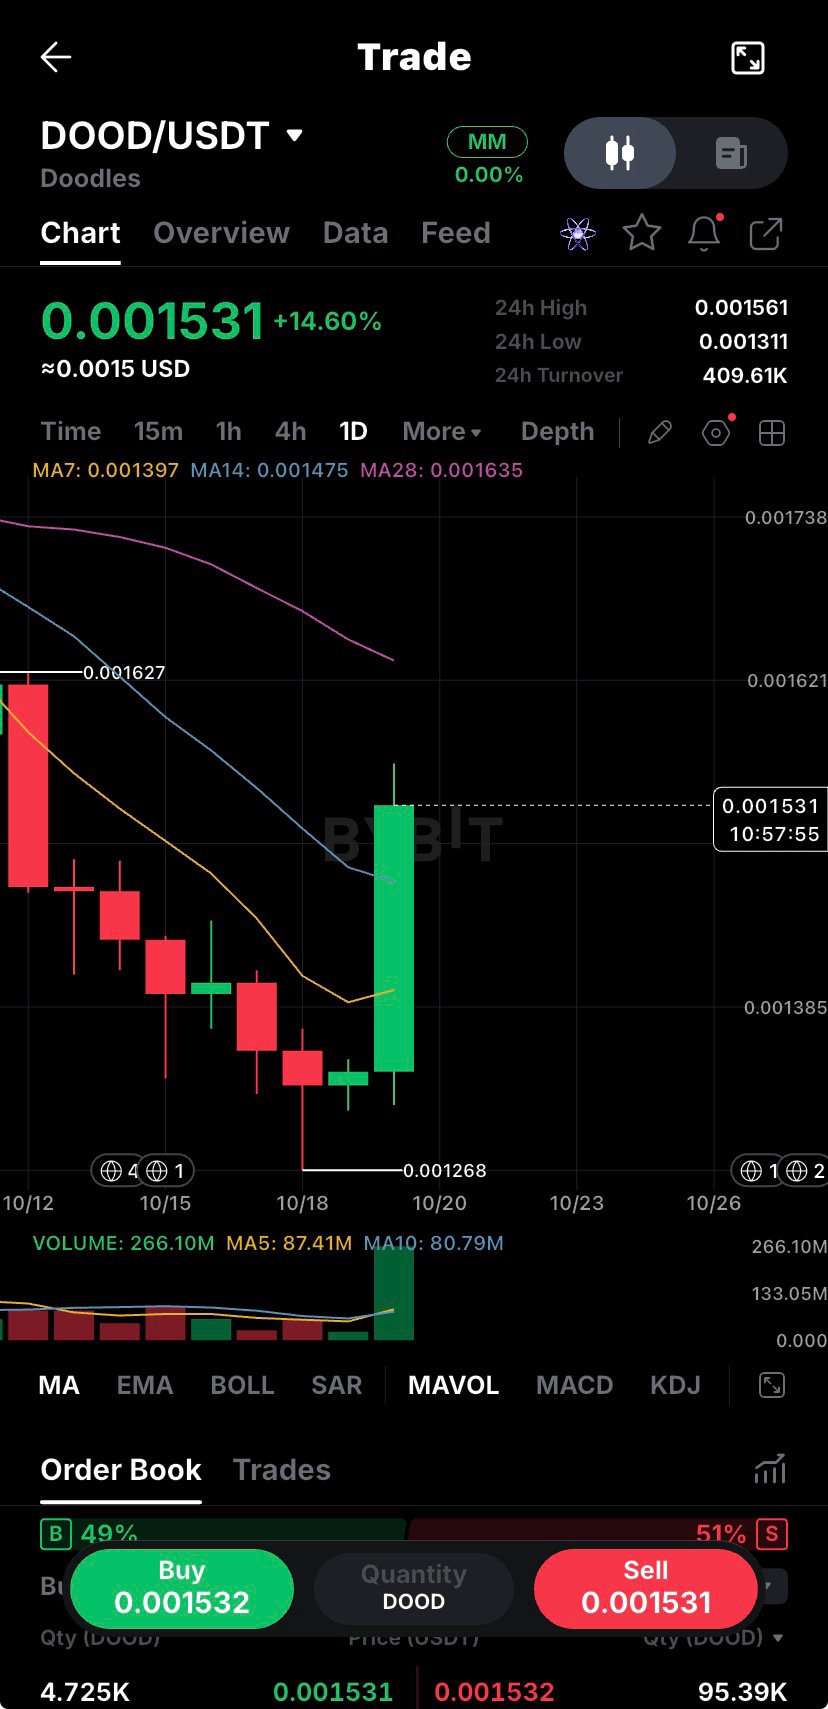
$DOODUSDT 📊 DOOD/USDT – Professional Technical Analysis (1D Chart) 🔍 Market Structure & Trend * Current Price: $0.001531 * 24H Change: +14.60% * 24H High: $0.001561 * 24H Low: $0.001311 * DOOD has rebounded strongly after declining from the $0.001627 area toward a low of $0.001268. * The latest daily candle shows a powerful bullish recovery, suggesting buyers are returning. * However, the broader trend remains under pressure because the price is still below the MA28 at $0.001635. 📈 Price Action * Price has recovered above MA7 ($0.001397) and MA14 ($0.001475), showing improving short-term momentum. * The latest candle has strong bullish body, indicating aggressive buying. * Price is approaching resistance around $0.001561–$0.001627, where sellers may re-enter. * A daily close above this resistance zone would strengthen the bullish reversal scenario. 🎯 Key Support & Resistance Support * $0.001475 — immediate support near MA14. * $0.001397 — secondary support near MA7. * $0.001311 — important recent low-area support. * $0.001268 — major visible swing low. Resistance * $0.001561 — immediate resistance. * $0.001627 — previous price barrier. * $0.001635 — MA28 resistance. * $0.001738 — potential upside target if the breakout continues. 📊 Volume Analysis * Current candle volume is approximately 266.10M, well above the displayed MA5 volume of 87.41M and MA10 volume of 80.79M. * This confirms strong participation during the upward move. * However, one high-volume candle does not guarantee continuation. Watch whether buying volume remains strong as price approaches resistance. 📉 Moving Average Alignment * MA7: $0.001397 * MA14: $0.001475 * MA28: $0.001635 Price is above MA7 and MA14, supporting a short-term bullish recovery. However, MA7 remains below MA14, and price is still below MA28. The broader trend has not yet fully confirmed a bullish reversal. 🎯 Trading Plan 1. Pullback Entry — Preferred Setup * Entry zone: $0.001475–$0.001500 * Stop-loss: $0.001440 * TP1: $0.001561 * TP2: $0.001627 * TP3: $0.001735 Wait for price to pull back into support and show bullish confirmation before entering. 2. Breakout Entry — Confirmation Required * Entry: After a strong daily close above $0.001627, preferably following a successful retest. * Stop-loss: Around $0.001560, adjusted to the retest structure. * TP1: $0.001680 * TP2: $0.001738 A breakout without sustained volume or a successful retest could turn into a false breakout. 3. Bearish Scenario * If DOOD loses $0.001475, price may revisit $0.001397. * A break below $0.001397 could expose $0.001311. * Losing $0.001268 would invalidate the current recovery structure. ⚠️ Risk Assessment DOOD has already moved sharply upward, so entering immediately carries the risk of buying near short-term resistance. The chart shows a bullish recovery, but the broader reversal remains unconfirmed. Verdict: Short-term bullish, broader trend not yet confirmed. The best approach is to wait for either a controlled pullback toward $0.001475–$0.001500 or a confirmed breakout above $0.001627. Avoid chasing the current candle, and keep position size appropriate for the volatility. #MyByXTake #ByXIMPACT #BybitStocks #USCPI #FOMCMinutes:Hawkish $MNTUSDT
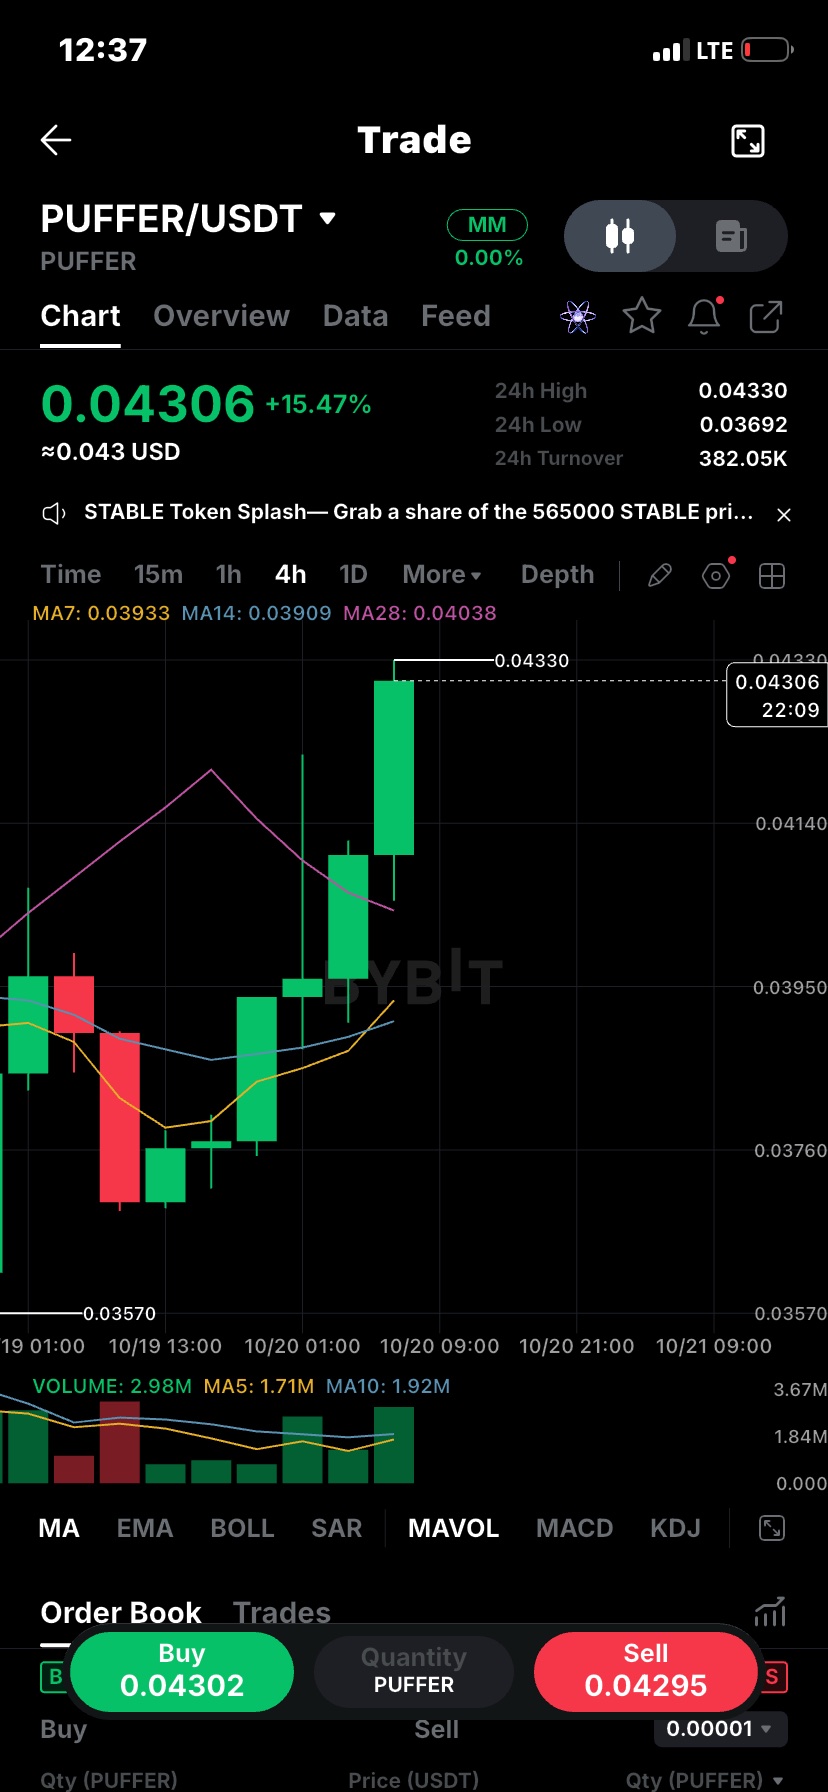
$PUFFERUSDT 📊 PUFFER/USDT – 4H Chart Analysis * Market Structure: PUFFER is showing strong bullish momentum, trading at $0.04306 (+15.47%). Price has rebounded from $0.03570 and formed consecutive green candles, indicating strong buying pressure. * Price Action: Buyers have pushed price close to the 24H high of $0.04330. However, the rally is already extended, so a short-term pullback or consolidation is possible before another upward move. * Support Levels: $0.04140, $0.03950, and $0.03800. Holding above $0.04140 would help maintain the current bullish structure. * Resistance Levels: $0.04330 is the immediate resistance. A confirmed breakout could open the way toward $0.04450–$0.04600. * Volume & Moving Averages: Recent bullish candles show increased trading activity. MA7 ($0.03933) is above MA14 ($0.03909), while price remains above MA28 ($0.04038). This supports the bullish trend, although the latest volume reading is below the MA5 and MA10 volume averages. * Momentum: Buyers currently have control, but price is approaching resistance. Chasing the move at the current level carries higher risk. 🎯 Trading Plan 1. Pullback Entry (Preferred) * Entry: $0.04140–$0.04200 * Stop-loss: $0.04050 * TP1: $0.04330 * TP2: $0.04450 * TP3: $0.04600 2. Breakout Entry * Wait for a strong 4H candle to close above $0.04330. * Enter around $0.04340–$0.04370 after confirmation. * Stop-loss: $0.04250 * Targets: $0.04450 and $0.04600. 3. Bearish Scenario If price loses $0.04140, a deeper pullback toward $0.03950 becomes possible. A break below $0.03950 would weaken the bullish setup. ⚠️ Risk Assessment PUFFER has already gained significantly, and buying directly below resistance offers limited room before a possible rejection. The pullback entry is preferable to chasing the current candle. Wait for confirmation, use a stop-loss, and risk only a small portion of your capital. Verdict: Bullish bias, but avoid FOMO. A confirmed breakout above $0.04330 or a controlled pullback toward support offers a more disciplined entry #MyByXTake #BybitStocks #ByXIMPACT #FOMCMinutes:Hawkish #BybitAIBestReplies $ETHUSDT
I tested Binance AI and found it useful for quick crypto research and market insights. More accurate answers, clearer sources, and deeper analysis would make it even better. Looking forward to its growth! #BinanceAI @binance

All my millions 💔😂

Good night ct 😉

Cashi is built around a simple idea: make everyday spending feel more rewarding. With a global spending card, users can spend, track transactions, and manage their money in one place. Real spending $CASH is making everyday payments more interesting @lumina_family

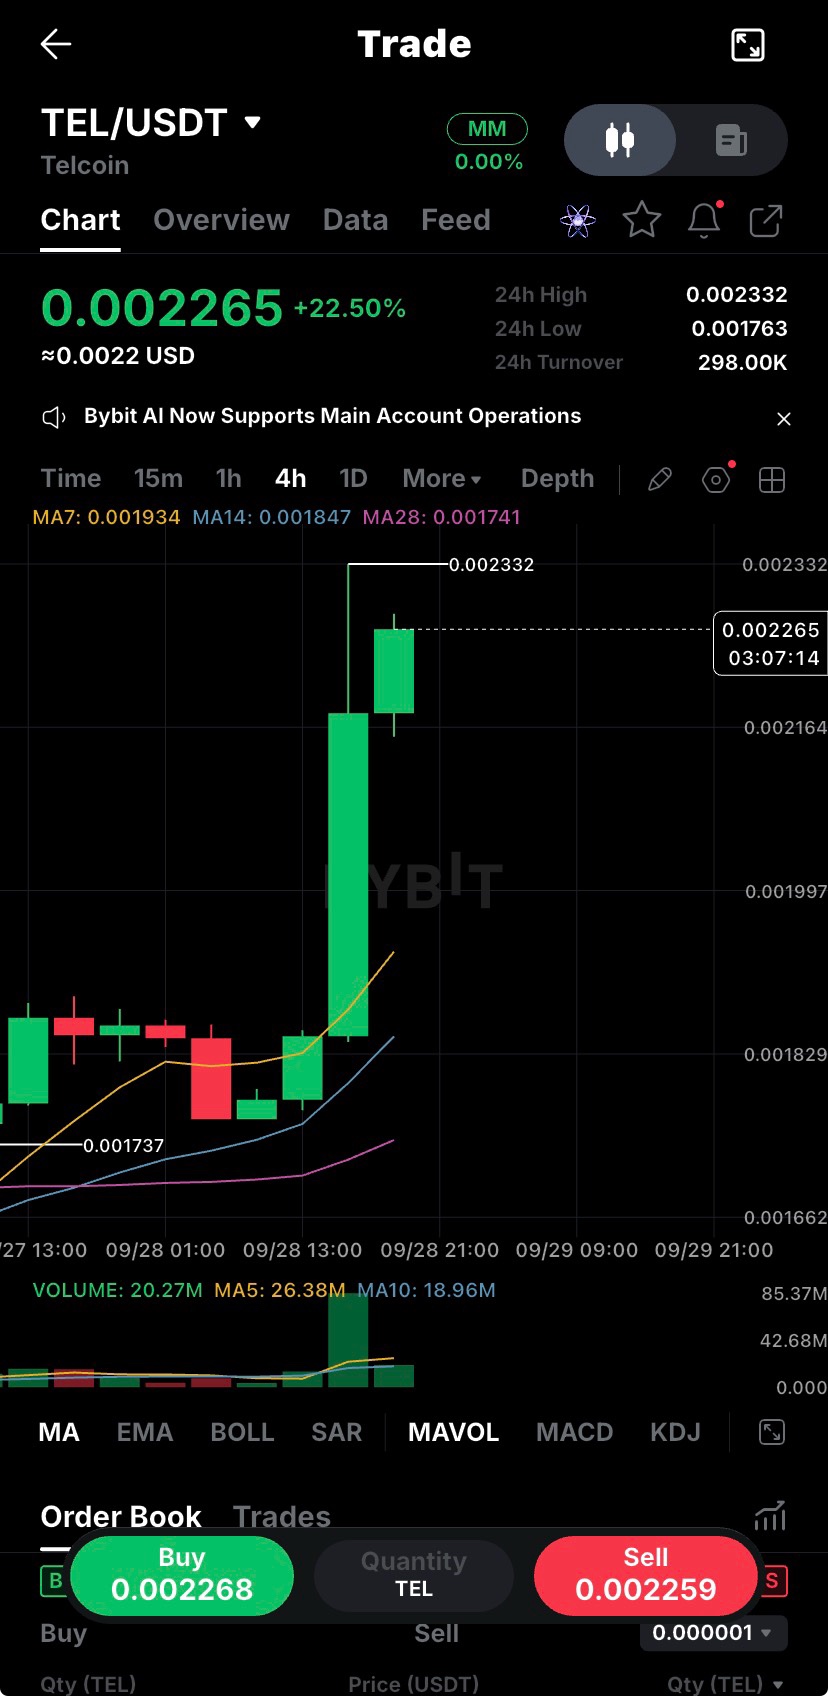
TEL/USDT — 4H $TELUSDT ◆ Market Structure: Strong bullish breakout. TEL has moved from the 0.001737 area to 0.002265, breaking above the previous consolidation and pushing into a new local high. ◆ Price Action: The current price is 0.002265, up 22.50%. A large bullish candle drove price sharply higher, followed by another green candle. The recent high is 0.002332, so price is currently consolidating just below resistance. ◆ Moving Averages: → MA7: 0.001934 → MA14: 0.001847 → MA28: 0.001741 The bullish alignment is clear, with price significantly above all three averages. This supports the current upward structure. ◆ Volume: Breakout volume expanded strongly. Current volume is 20.27M, while MA10 is 18.96M. The breakout candle had particularly strong volume, confirming increased buying participation. ◆ Resistance: → 0.002332 — immediate resistance / recent high → 0.00250 — psychological resistance → 0.00270–0.00280 — potential extension zone if momentum continues ◆ Support: → 0.00216–0.00220 — immediate breakout support → 0.00193–0.00197 — MA7 / deeper pullback zone → 0.00184–0.00187 — MA14 support → 0.001737 — major structural support ◆ Entry Plan: → Aggressive: 0.00218–0.00226 if price holds above the breakout area and buying volume returns. → Safer: Wait for a pullback toward 0.00193–0.00205 and look for bullish confirmation. → Breakout: A strong 4H close above 0.002332 with increasing volume could confirm another continuation move. ◆ Stop-Loss / Invalidation: For a pullback setup, a sustained break below 0.00184–0.00190 would significantly weaken the current bullish structure. ◆ Targets: 0.00233 → 0.00250 → 0.00270 → 0.00300 ◆ Risk: ⚠️ TEL is already +22.50%, so chasing the current candle carries elevated pullback risk. The cleaner setups are a confirmed breakout above 0.002332 or a controlled retest of support. ◆ Trade Bias: 🟢 Bullish above 0.00193. The key level is 0.002332. Holding above the breakout zone keeps continuation possible; rejection there could trigger a short-term retracement. #ByXIMPACT #BybitAIBestReplies #ByPickMakeYourPickCount #BybitOdds
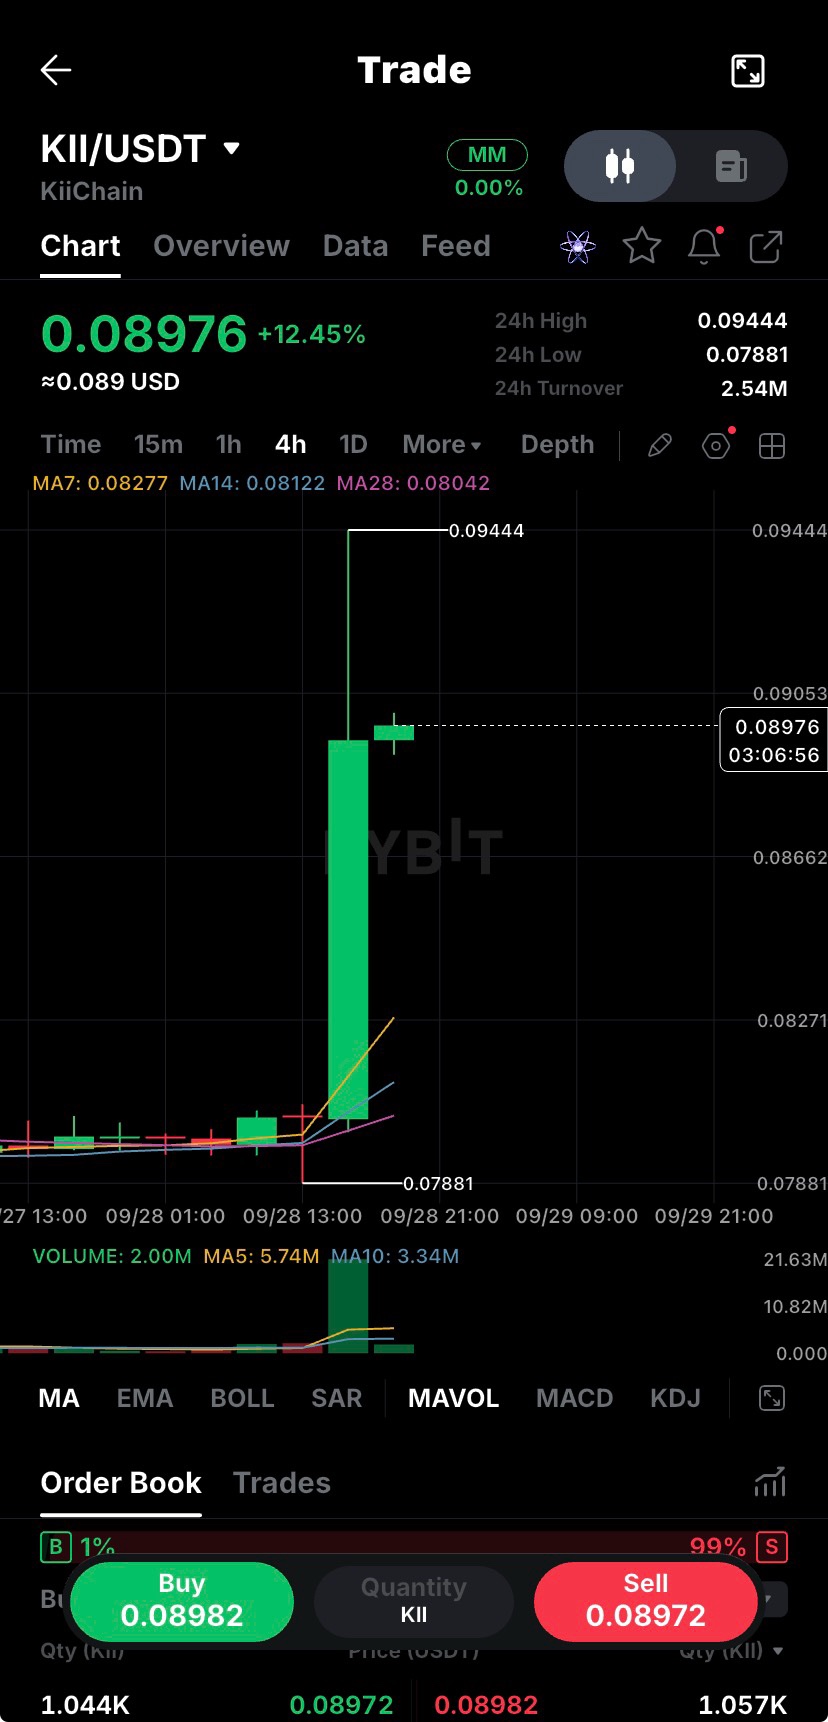
KII/USDT — 4H $KIIUSDT ◆ Market Structure: Strong bullish breakout. KII moved from the 0.07881 base to 0.08976, breaking sharply above the previous consolidation area. Price is now holding well above all visible moving averages. ◆ Price Action: The breakout candle is very large, showing aggressive buying. Price reached 0.09444 before pulling back slightly to 0.08976. The small current candle suggests short-term consolidation after the impulse. ◆ Moving Averages: → MA7: 0.08277 → MA14: 0.08122 → MA28: 0.08042 All three are below price and aligned bullishly. Holding above 0.0827 keeps the short-term structure strong. ◆ Volume: Breakout volume expanded significantly, confirming strong participation. Current volume is lower than the breakout candle, which suggests momentum is cooling rather than continuing at the same intensity. ◆ Resistance: → 0.09444 — immediate major resistance → 0.1000 — psychological level → 0.1050–0.1100 — potential extension zone if breakout momentum returns ◆ Support: → 0.0880–0.0890 — immediate support → 0.0827–0.0830 — MA7 / key pullback zone → 0.0800–0.0812 — stronger MA support → 0.07881 — major breakout base ◆ Entry Plan: → Aggressive: 0.0880–0.0900 if price holds this area and buyers return. → Safer: Wait for a deeper retest around 0.0827–0.0850 with bullish confirmation. → Breakout: A strong 4H close above 0.09444 with increased volume would confirm continuation. ◆ Stop-Loss / Invalidation: For a pullback entry, a sustained break below 0.0800–0.0812 would weaken the current bullish structure. Adjust the stop according to your risk size. ◆ Targets: 0.0944 → 0.1000 → 0.1050 → 0.1100+ ◆ Risk: ⚠️ KII has already made a sharp move and is +12.45%. Buying directly after the breakout can expose you to a deeper retracement. The cleaner setup is a successful retest or a confirmed breakout above 0.09444. ◆ Trade Bias: 🟢 Bullish above 0.0827. The key level to watch is 0.09444. A rejection there could produce a pullback; a high-volume breakout could extend the move. #ByXIMPACT #BybitAIBestReplies #PolyMarketPreIPO #BybitOdds #NewFinancialPlatform
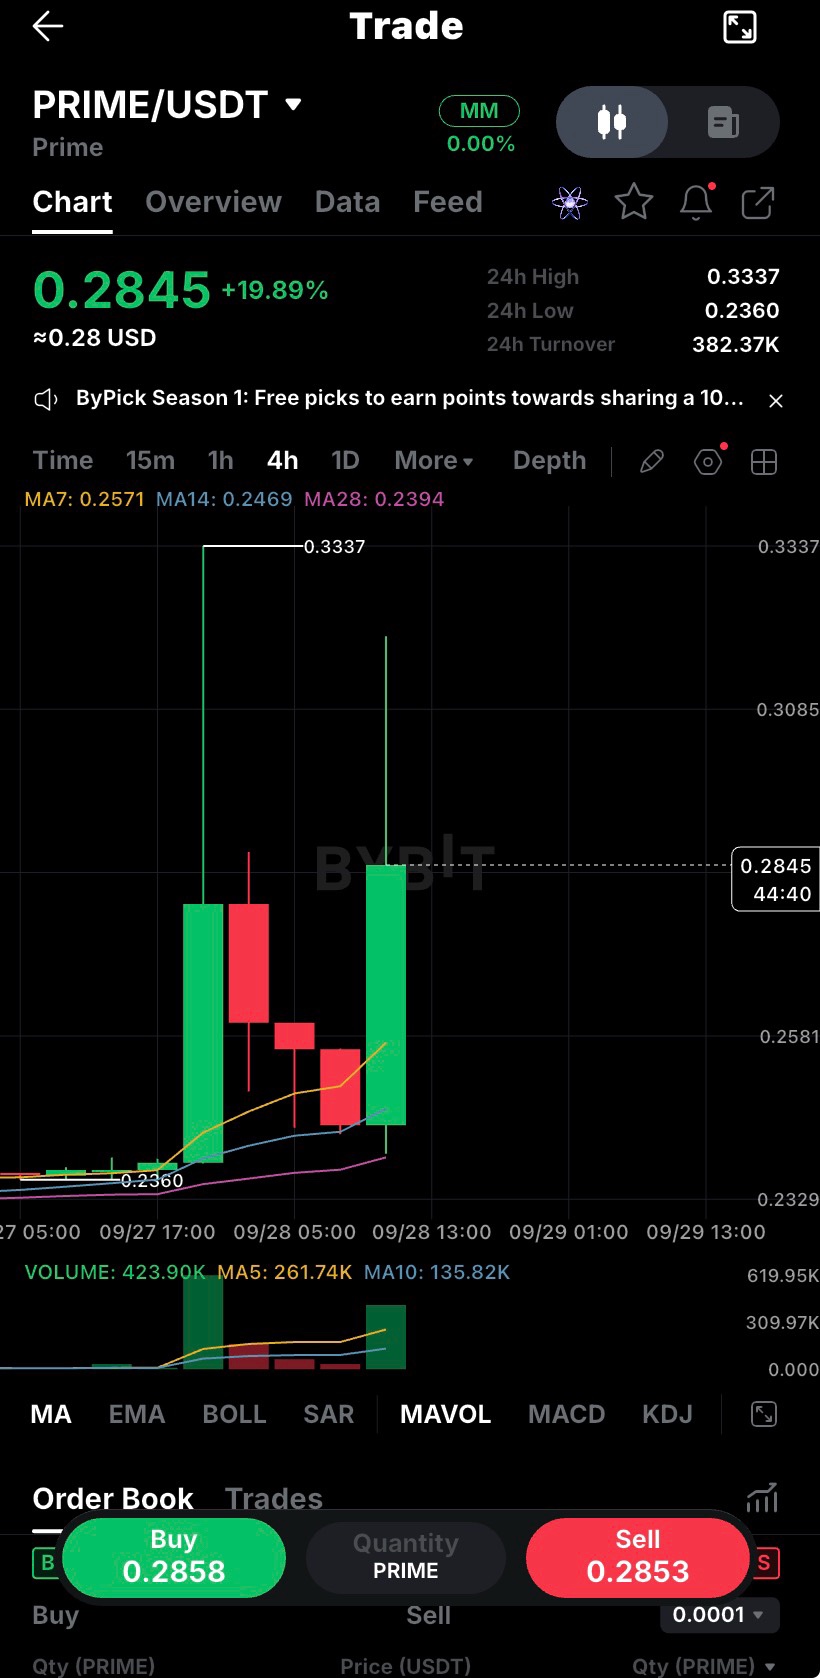
$PRIMEUSDT PRIME/USDT — 4H ◆ Market Structure: Bullish recovery. PRIME bounced strongly from 0.2360 and reclaimed the MA7, MA14 and MA28. The latest candle shows strong buying pressure, but the long upper wick indicates sellers are active near higher levels. ◆ Price Action: Current price is 0.2845, up 19.89%. The move from 0.2360 → 0.3337 was aggressive, followed by a pullback and another strong bullish candle. This keeps the short-term structure bullish. ◆ Moving Averages: MA7 0.2571 > MA14 0.2469 > MA28 0.2394. This alignment supports the bullish trend. Holding above 0.2570 keeps momentum constructive. ◆ Volume: Current volume is 423.90K, above MA5 261.74K and MA10 135.82K. The latest buying candle has strong volume, confirming increased participation. ◆ Resistance: → 0.3000–0.3085 — immediate resistance → 0.3337 — major resistance / recent high → A clean 4H close above 0.3337 could signal another expansion. ◆ Support: → 0.2750–0.2800 — immediate support → 0.2570–0.2600 — MA7 support → 0.2460–0.2500 — stronger support → 0.2360 — major structural support ◆ Entry Plan: → Aggressive: Entry around 0.280–0.285 if price holds this area with buying volume. → Safer: Wait for a pullback toward 0.257–0.265 and look for a bullish reaction. → Breakout: Consider confirmation only after a strong 4H close above 0.3337. ◆ Stop-Loss / Invalidation: For a pullback setup, a break below 0.2460 weakens the bullish structure. Keep the exact stop based on your risk size rather than using the full range. ◆ Targets: 0.300 → 0.308 → 0.3337 → 0.350+ if momentum continues. ◆ Risk: ⚠️ PRIME has already moved nearly 20% and has a large upper wick. Chasing directly into resistance increases pullback risk. Waiting for a retest or confirmed breakout gives a cleaner setup. ◆ Trade Bias: 🟢 Bullish above 0.2570. The key battle is 0.3337; until that level breaks, expect possible consolidation or profit-taking below the high. #ByXIMPACT #BybitAIBestReplies #PolyMarketPreIPO
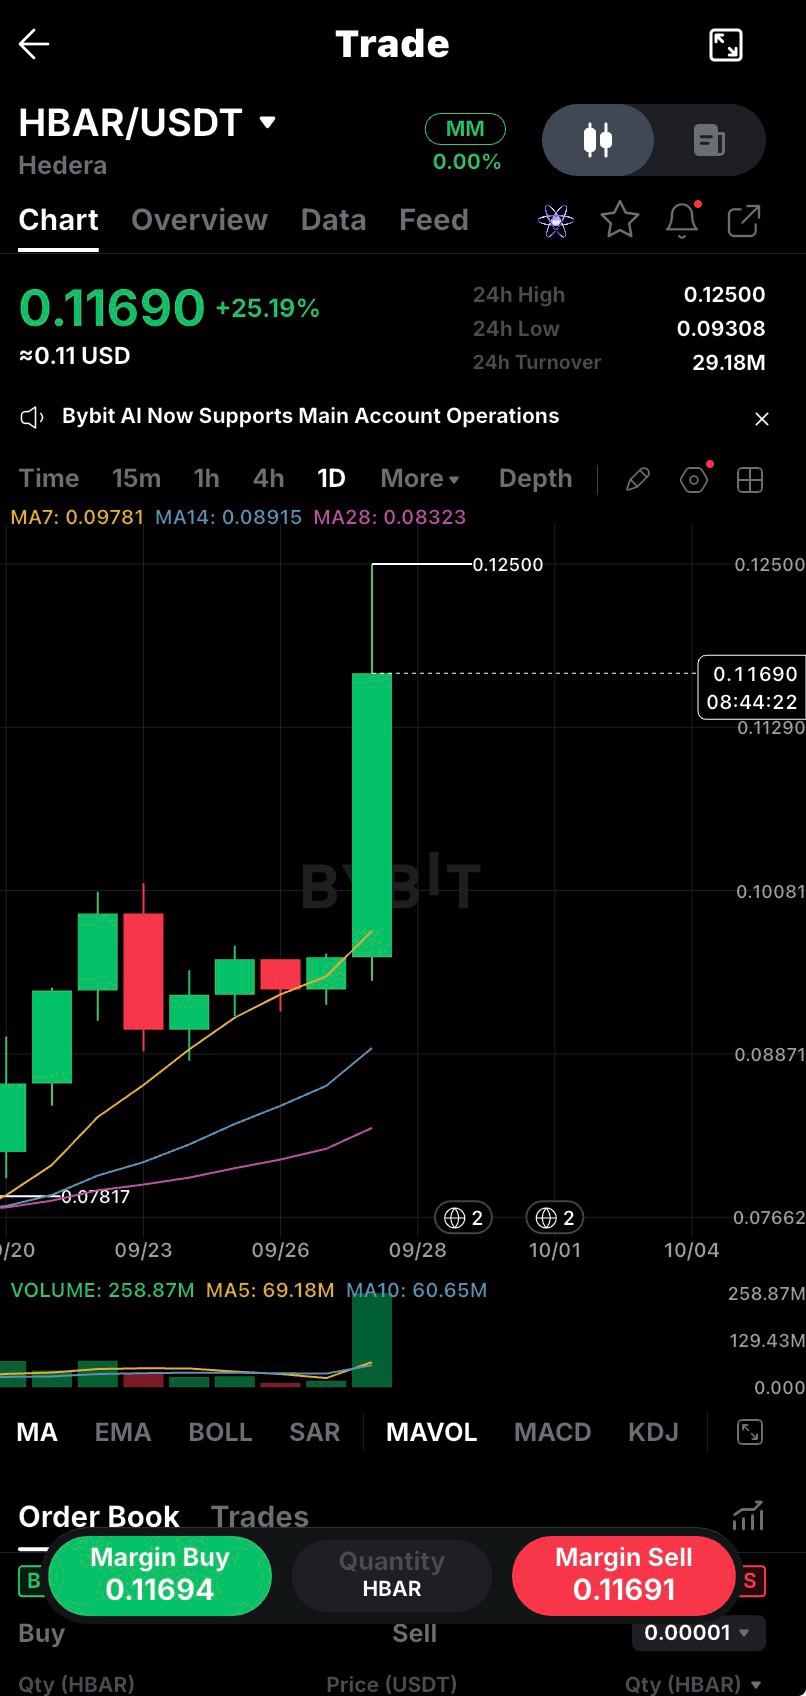
$HBARUSDT HBAR/USDT ◆ Trend: Strong bullish momentum on the 1D chart. Price at 0.1169 is well above MA7 0.0978, MA14 0.0892, and MA28 0.0832. ◆ Price Action: Large breakout candle pushed from around 0.095 → 0.1169, with a high of 0.1250. The upper wick shows some profit-taking near the high. ◆ Volume: Very strong confirmation. Volume is 258.87M, far above MA5 69.18M and MA10 60.65M. Buyers are clearly active. ◆ Resistance: → 0.1250 — immediate resistance → 0.1300–0.1350 — next breakout zone → Above 0.1350 could open further upside. ◆ Support: → 0.1120–0.1140 — first pullback zone → 0.1050–0.1080 — stronger support → 0.0978 — MA7 / deeper invalidation area ◆ Entry Plan: → Safer: Wait for a pullback toward 0.108–0.114 and look for bullish reaction. → Aggressive: Break and hold above 0.1250 with strong volume. ◆ Stop-Loss: Around 0.103–0.106 for a pullback entry, depending on risk. ◆ Targets: 0.125 → 0.135 → 0.145+ ◆ Risk: ⚠️ The move is already +25%, so chasing at 0.1169 carries higher pullback risk. A confirmed breakout or controlled retracement gives a cleaner setup. ◆ Overall Setup: Bullish, but the key test is whether HBAR can reclaim and hold 0.1250. #ByXIMPACT #BybitAIBestReplies #BybitOdds
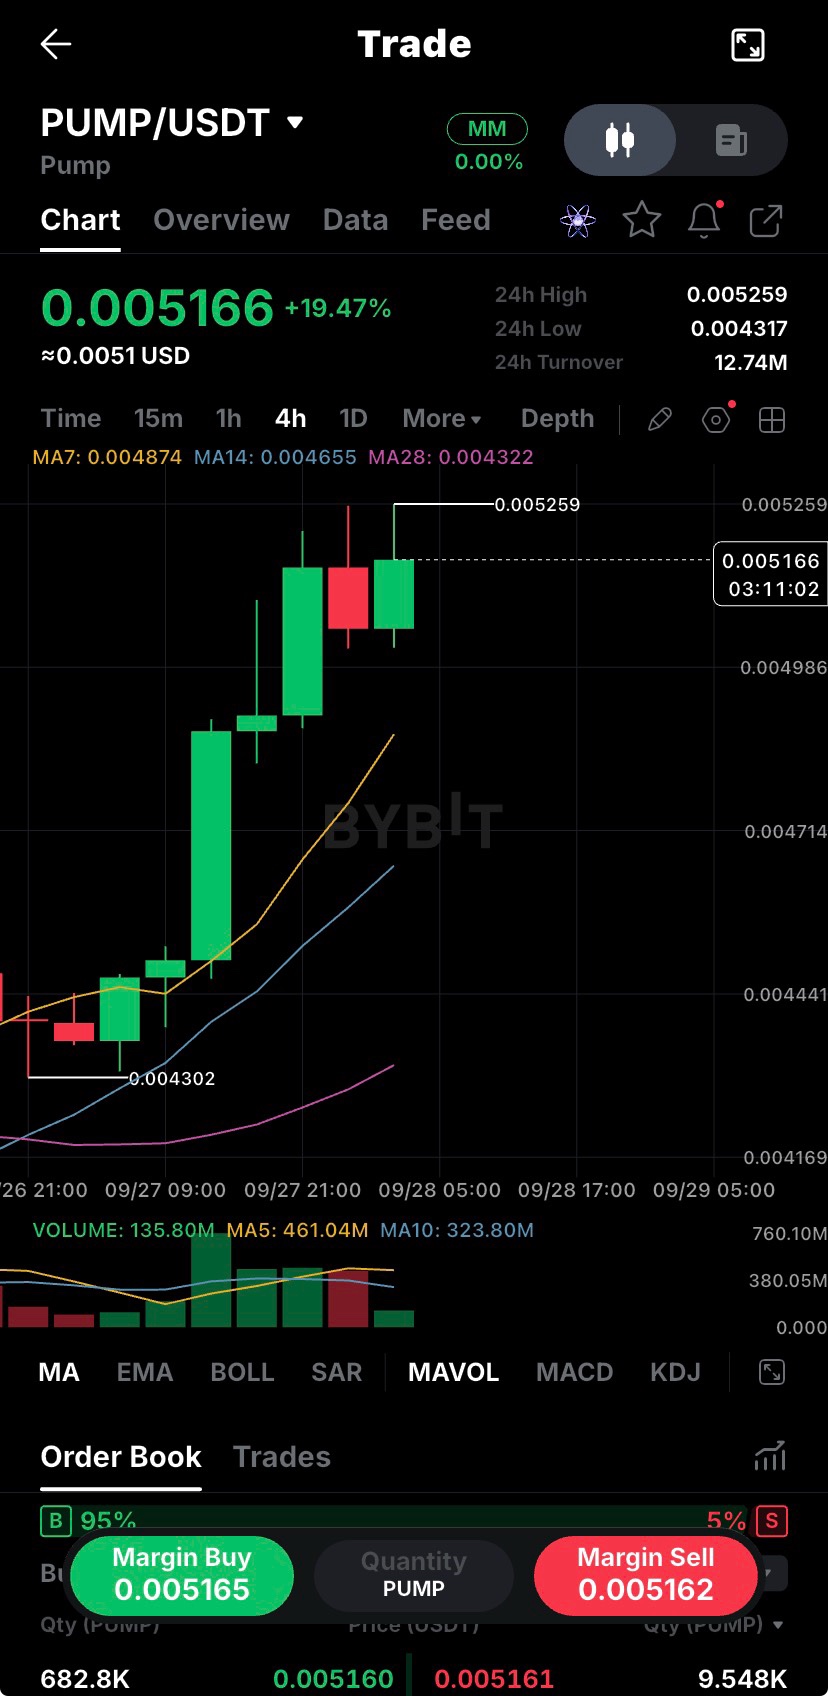
PUMP — $PUMPUSDT Price: $0.005217 | 24h Change: +20.62% The Key Level: ~0.005217 (at the high) The signal says "neutral sentiment, range-bound, no extreme risk signals." The live data says something very different. This is not a neutral setup — the positioning data is outright bearish and directly contradicts the signal. Whale ratio: 0.4:1 long/short — whales are heavily short, not long Fund flow: Bearish — institutional money is positioned against this move Top trader 7d ROI: -2.83% — the best traders on this coin are losing money Funding rate: +0.005% at the floor — nothing alarming here, but it's the only green flag That 20.62% candle today with whales net short and fund flow bearish is a red flag, not a buy signal. Either whales are wrong and getting squeezed, or retail is buying into a move that smart money is fading. Key Levels No support/resistance data available for PUMP — it's a spot-only token with limited derivatives data. Using price context only. | Level | Source | Role | |-------|--------|------| | 0.005217 | Current price | At the high, decision zone | | 0.0043–0.0045 | Estimated prior range | First pullback support | | 0.0038–0.0040 | Estimated base | Structural support | The Two Scenarios Breakout — If this is a genuine squeeze on whale shorts, price could extend further. But there's no S/R data to give a credible target. Trading blind above current levels without structure is gambling, not trading. Rejection — Whales short, fund flow bearish, top traders negative ROI. A fade back to 0.0043–0.0045 after a 20% candle would be entirely normal and is the higher-probability path based on positioning alone. The One Honest Risk The signal calling this "neutral with no extreme risk signals" is flat out wrong when you look at the capital flow data. Whale short positioning at 0.4:1 after a 20% move is not neutral — it's a setup where someone is going to be badly wrong. Either the shorts capitulate and price rips, or retail gets caught holding the bag on a wick. With no support/resistance structure available and top traders already down on this coin this week, the risk/reward for a new long here is poor. #ByXIMPACT #BybitAIBestReplies #ByPick-MakeYourPickCount
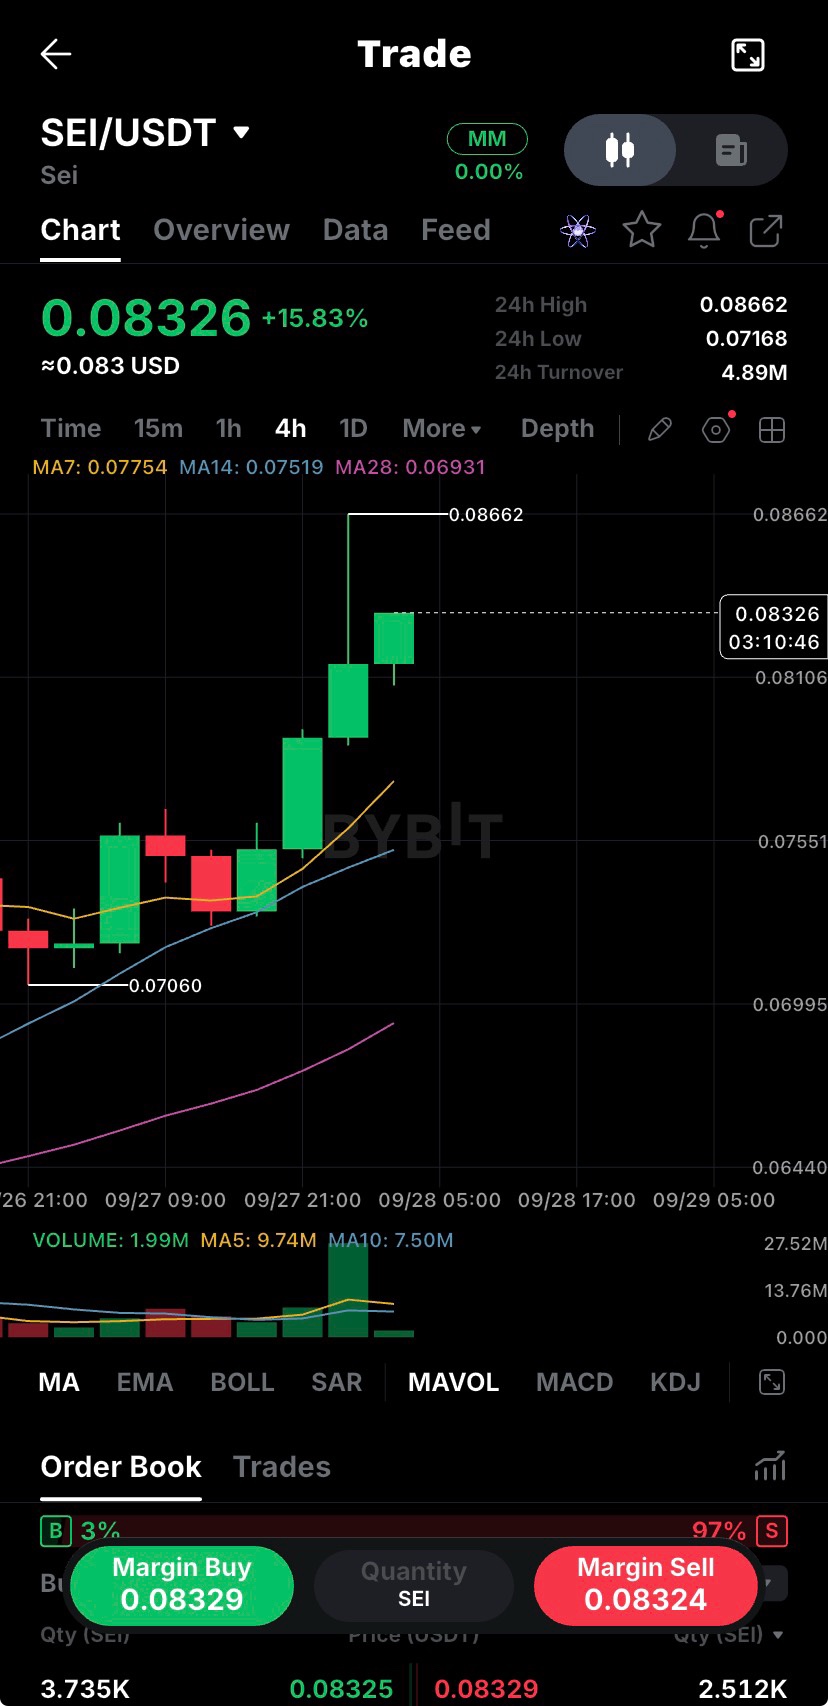
SEI — $SEIUSDT Price: $0.08317 | 24h Change: +15.8% The Key Level: 0.0830–0.0872 Price is pushing into the upper Bollinger band on the 4H (~0.0872) and sitting just above the 5m resistance cluster at 0.0833. The signal calls this "strong bullish directional strength" and the data partially agrees — but the devil is in the details. Whale ratio: 1.2:1 long/short — lean long but not aggressive Fund flow: Bullish — this one actually aligns with the signal, unlike XAI OI: +$93M vs 30 days ago (+60%) — significant fresh money entering over the past month Funding rate: +0.010% — positive and at the max of the 90-period range. Longs are paying shorts. Getting warm. The OI expansion is the most credible piece here. This isn't a squeeze — there is genuine position building happening. But the funding rate sitting at its 90-period ceiling means longs are getting crowded. Key Levels | Level | Source | Role | |-------|--------|------| | 0.0872–0.0913 | 4H Bollinger / Fib | Next resistance band | | 0.0854–0.0877 | VWAP / Fib 4H | Resistance just above | | 0.08317 | Current price | Decision zone | | 0.0812–0.0820 | 5m Bollinger / Fib | First pullback support | | 0.0777–0.0800 | 4H Bollinger / VWAP | Structural support | | 0.0563–0.0585 | Fib / 4H Bollinger | Deep correction zone | The Two Scenarios Breakout — OI expansion holds, fund flow stays bullish, price clears 0.0872 on a 4H close. Next target cluster is 0.0913–0.0923. The month-long OI build gives this more credibility than a typical squeeze play. Rejection — Funding at its 90-period high means longs are crowded right here. A rejection at 0.0833–0.0872 flushes back toward 0.0812 first, then 0.0777 if that cracks. With 15.8% already in the bag today, profit-taking alone could do this. The One Honest Risk Funding rate is at the maximum of the last 90 periods. When every long is already positioned and paying the maximum rate, there are fewer buyers left to push price higher. The OI story is bullish medium-term, but short-term you're entering at exactly the point where the cost of holding a long is highest. That's not where you want to be adding size — it's where you trim or wait for a reset. #ByXIMPACT #BybitAIBestReplies #BybitOdds
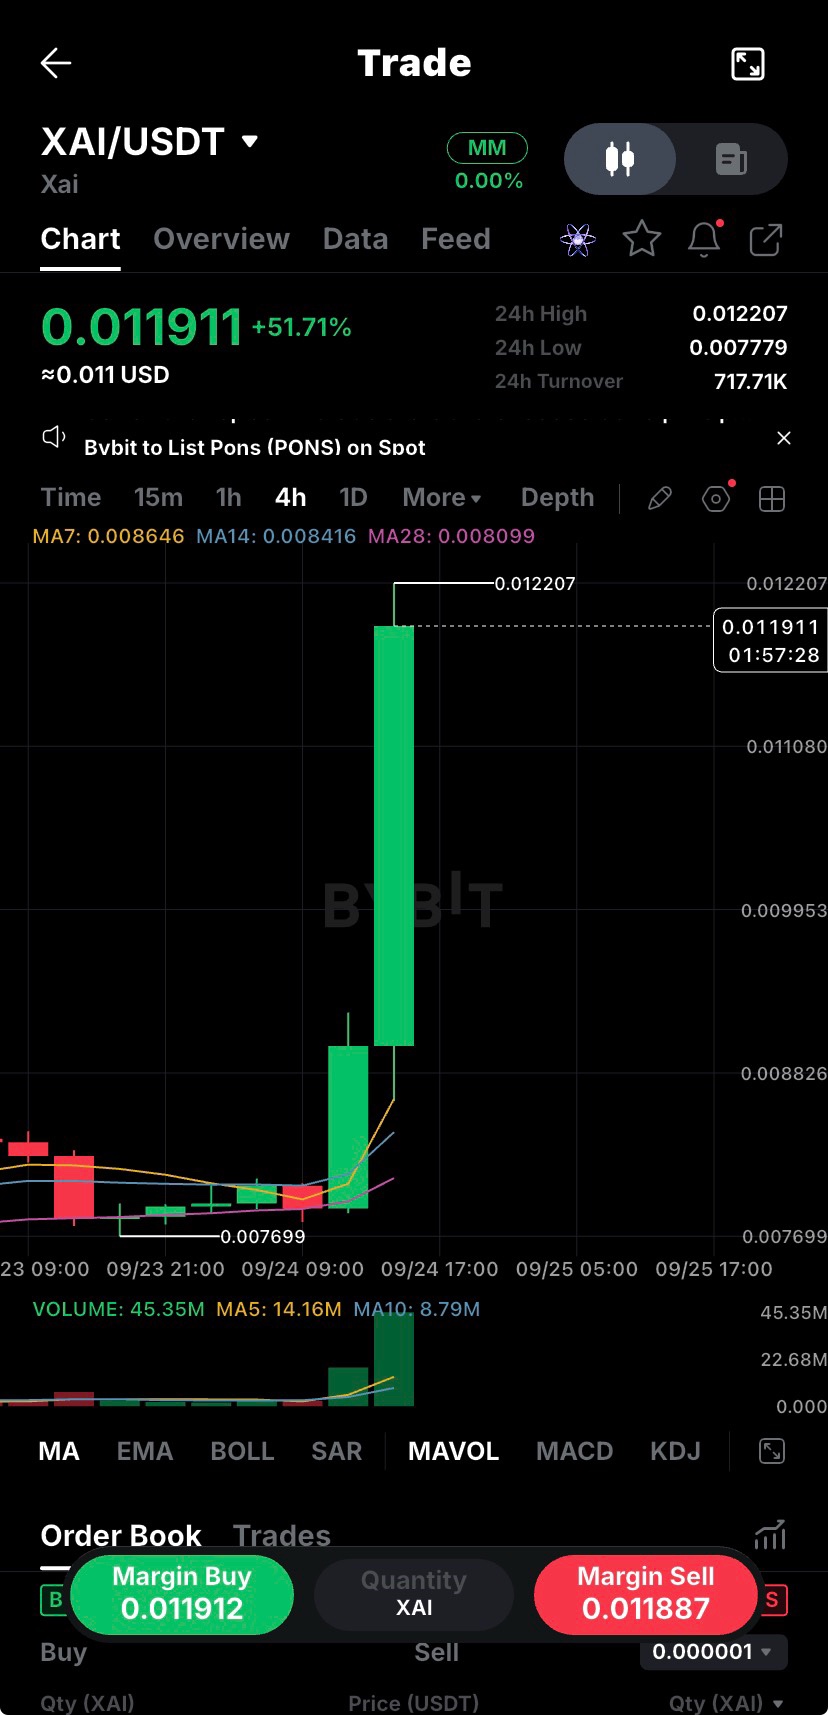
$XAIUSDT # XAI — Live Analysis **Price:** $0.01189 | **24h Change:** +52.27% 🚀 --- # 🧱 The Key Level: ~0.01190–0.01230 Price just had a 52% single-day explosion. That's not a trend — that's an event. The current price is sitting right at the 5m Bollinger resistance (~0.01169–0.01344 zone). The "bullish directional strength" narrative is real — but it's already happened. The question is what's left. Live positioning tells a more complicated story than that signal suggests: - **Whale ratio: 1.3:1 long/short** — mild lean long, not conviction - **Fund flow: Bearish** — institutional money is fading this move, not chasing it - **OI: -$32M vs 30 days ago** (~-27%) — open interest is *shrinking* on a 52% candle. That's short covering, not fresh longs piling in - **Funding rate: -0.041%** — deeply negative. Shorts are paying longs. This is a squeeze, not organic buying ---# 📐 Key Levels | Level | Source | Role | |-------|--------|------| | 0.01227–0.01344 | Bollinger 5m | Resistance band | | 0.01163–0.01195 | Volume Profile 5m | Nearest resistance | | **0.01189** | Current price | Decision zone | | 0.00914–0.00922 | Fib / Vol Profile | First pullback support | | 0.00876–0.00884 | 4H Bollinger / Fib | Structural support | | 0.00752 | Volume Profile 4H | Deep flush support | --- # 🔀 The Two Scenarios **🟢 Continuation** Squeeze holds, shorts keep getting wiped → price pushes through 0.01230 and tags 0.01340+. Only valid if OI starts building (fresh longs entering), not just declining. Watch for funding rate to normalize toward zero. **🟡 Rug / Reversal** This has all the hallmarks of a short squeeze: OI falling, funding deeply negative, fund flow bearish. Once shorts are washed out, the fuel is gone. A rejection here sends price back toward **0.0091–0.0087** fast — that's a -25% drop from current levels. --- # ⚠️ The One Honest Risk The "bullish directional strength" in that signal is backward-looking — it's describing a move that already happened via a squeeze. **Fund flow is bearish and OI is shrinking.** That's not a setup for a sustained trend — it's a setup for a snapback once the squeeze exhausts. If you're trading this, your stop needs to be tight and below 0.0091, not just "near support." #BybitAIBestReplies #PolyMarketPreIPO #ClarityAct