Abubakar
Web3 Enthusiasm, Crypto Trader.
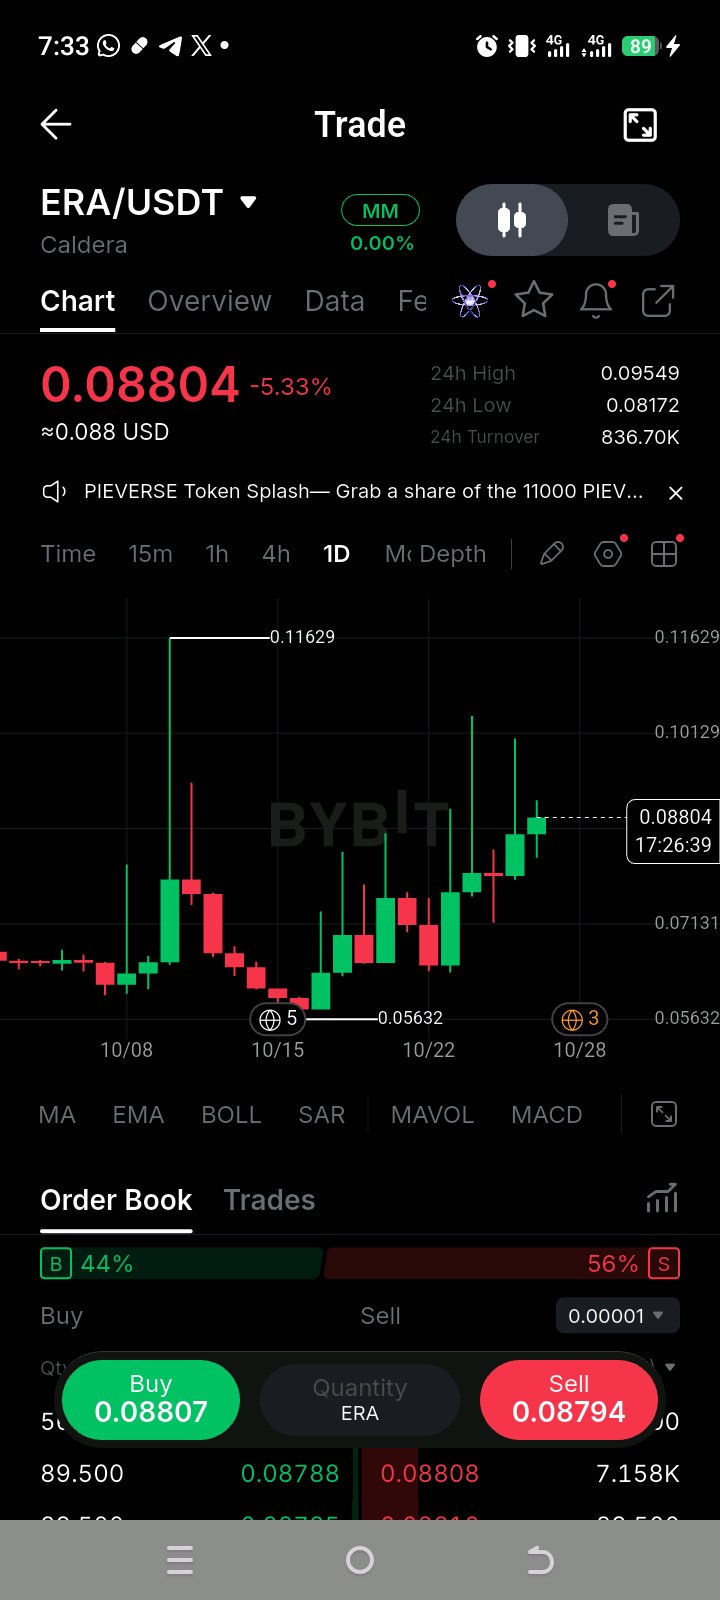
$ERAUSDT: Reversal or a Fakeout? ERA is showing signs of recovery after dropping to 0.05632. Price is now around 0.088, but can the bulls sustain this momentum? Here’s what I’m watching: • 0.095–0.101: Immediate resistance zone. • 0.081–0.083: Near-term support to watch. • 0.1163: A major resistance level from the previous spike. The daily chart is showing improving momentum, but a convincing breakout above resistance would strengthen the bullish reversal thesis. If support fails, another pullback remains possible. No blind entries. Wait for confirmation and manage risk. Do you think ERA is building toward a genuine reversal or approaching another rejection? #IMPACTbyTrade #MyByXTake #WSOT2026
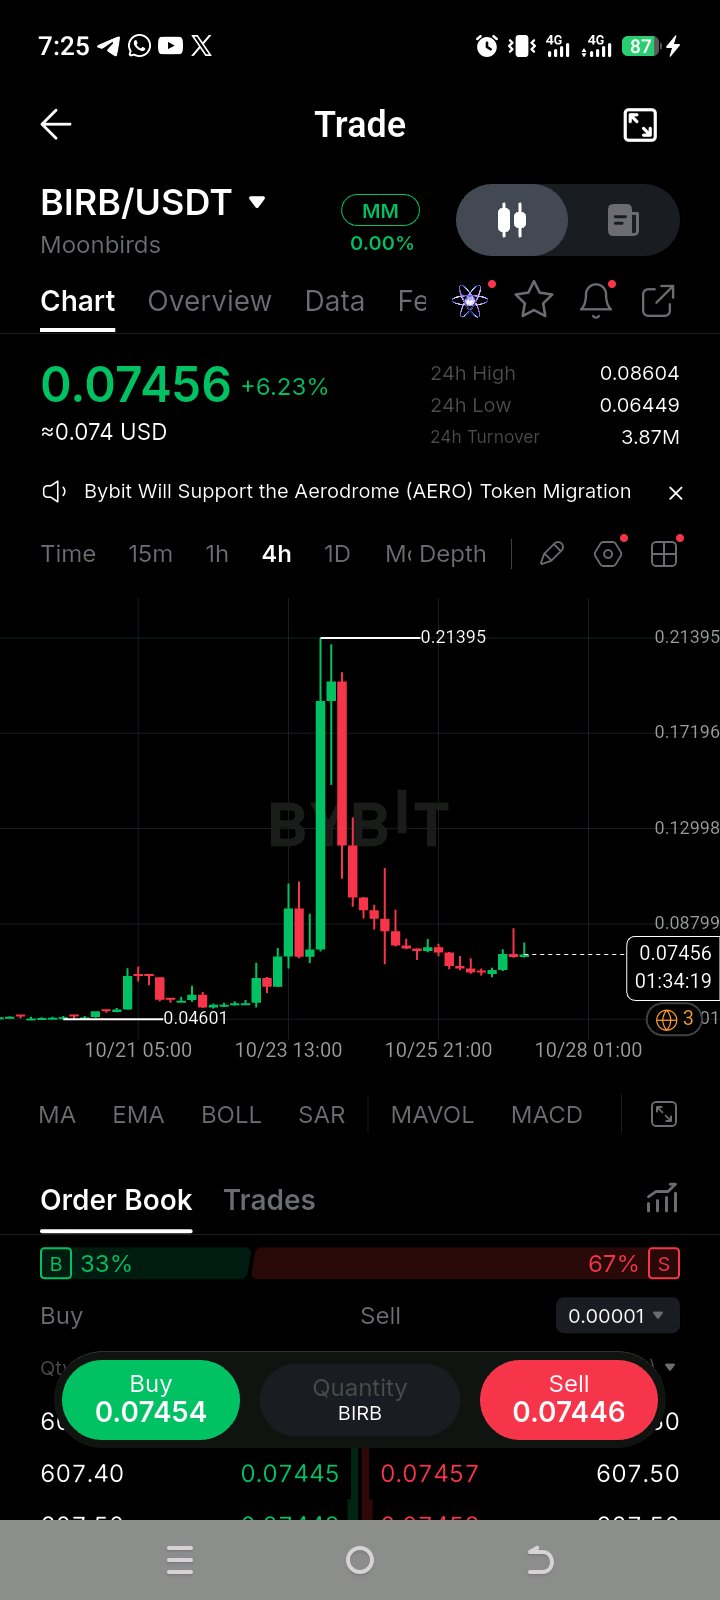
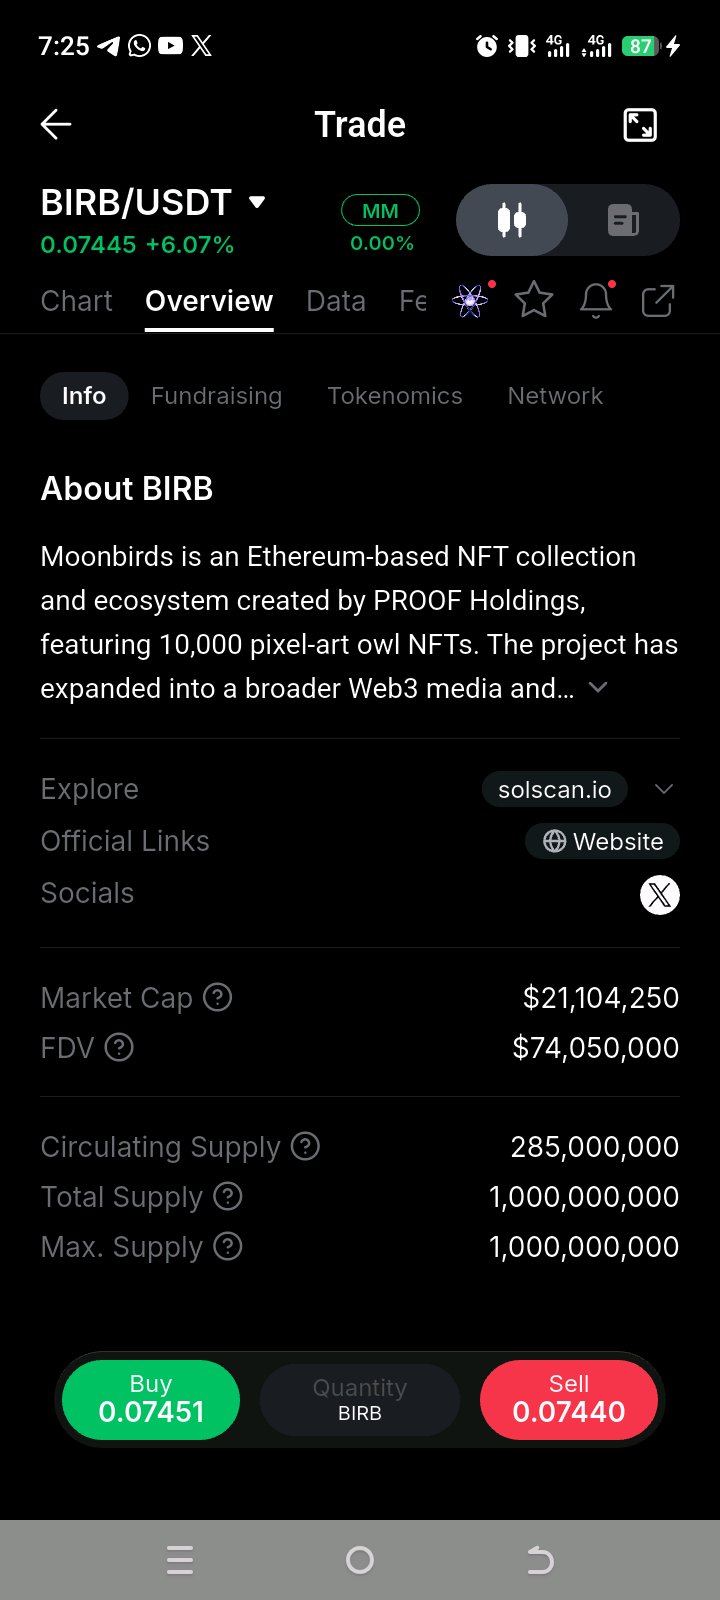
$BIRBUSDT: Reversal or Just a Relief Bounce? After surging to 0.21395, BIRB experienced a sharp correction and is now attempting to stabilize around 0.074. Here’s what I’m watching: • 0.080–0.088: First resistance zone. • 0.070: Key support to hold. • 0.0645: A break below this recent low could weaken the recovery setup. I want to see a convincing 4H breakout with volume before confirming a potential trend reversal. No blind entries. Confirmation first, risk management always. What do you see here: a potential reversal through accumulation, or another move lower? #IMPACTbyTrade #MyByXTake #MidtermsMarketWatch
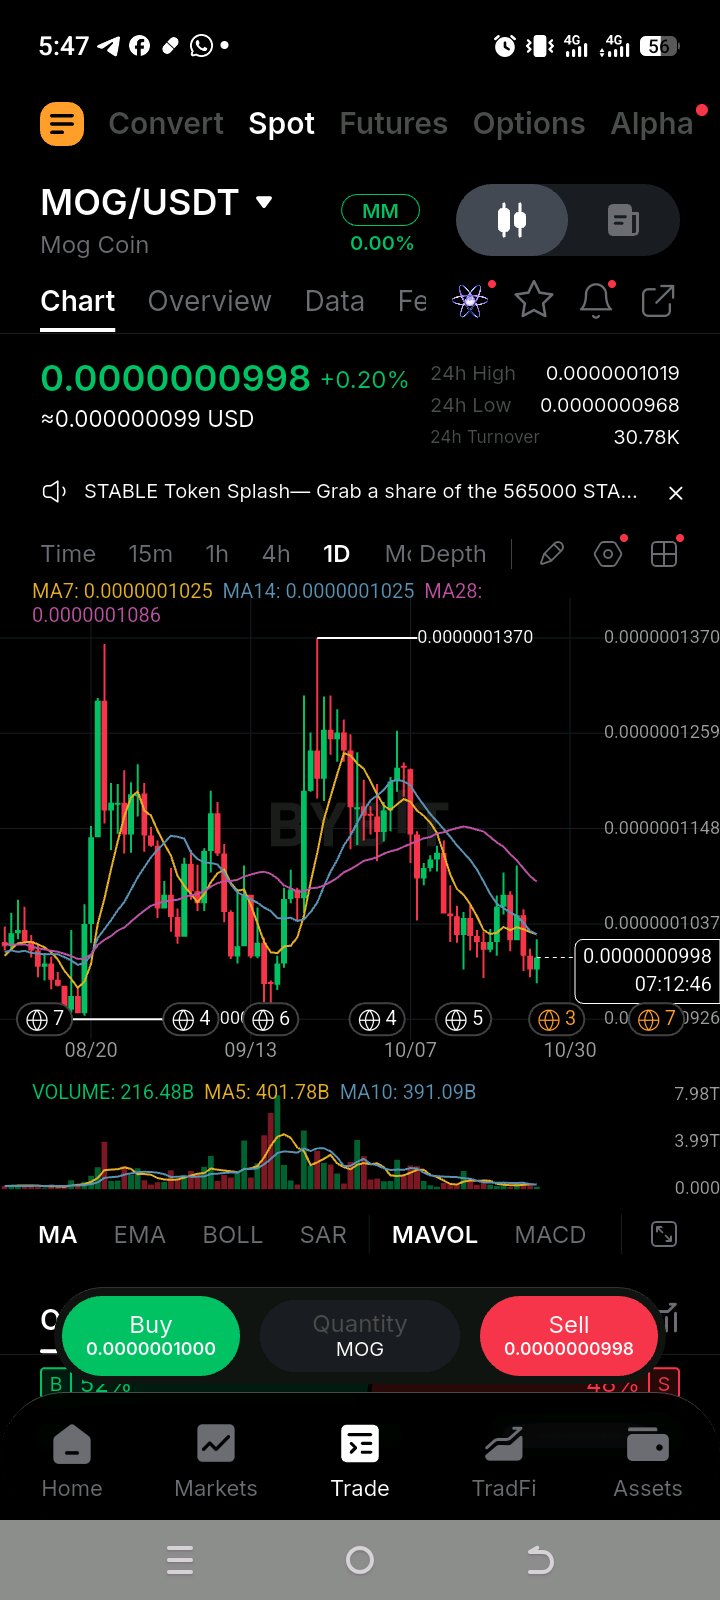
$MOGUSDT is approaching a key decision zone. Price is around $0.0000000998, below the MA7, MA14, and MA28 on the daily chart. A breakout above $0.0000001037 with rising volume could signal bullish momentum. Until then, confirmation is key. #IMPACTbyTrade #MyByXTake #MidtermsMarketWatch
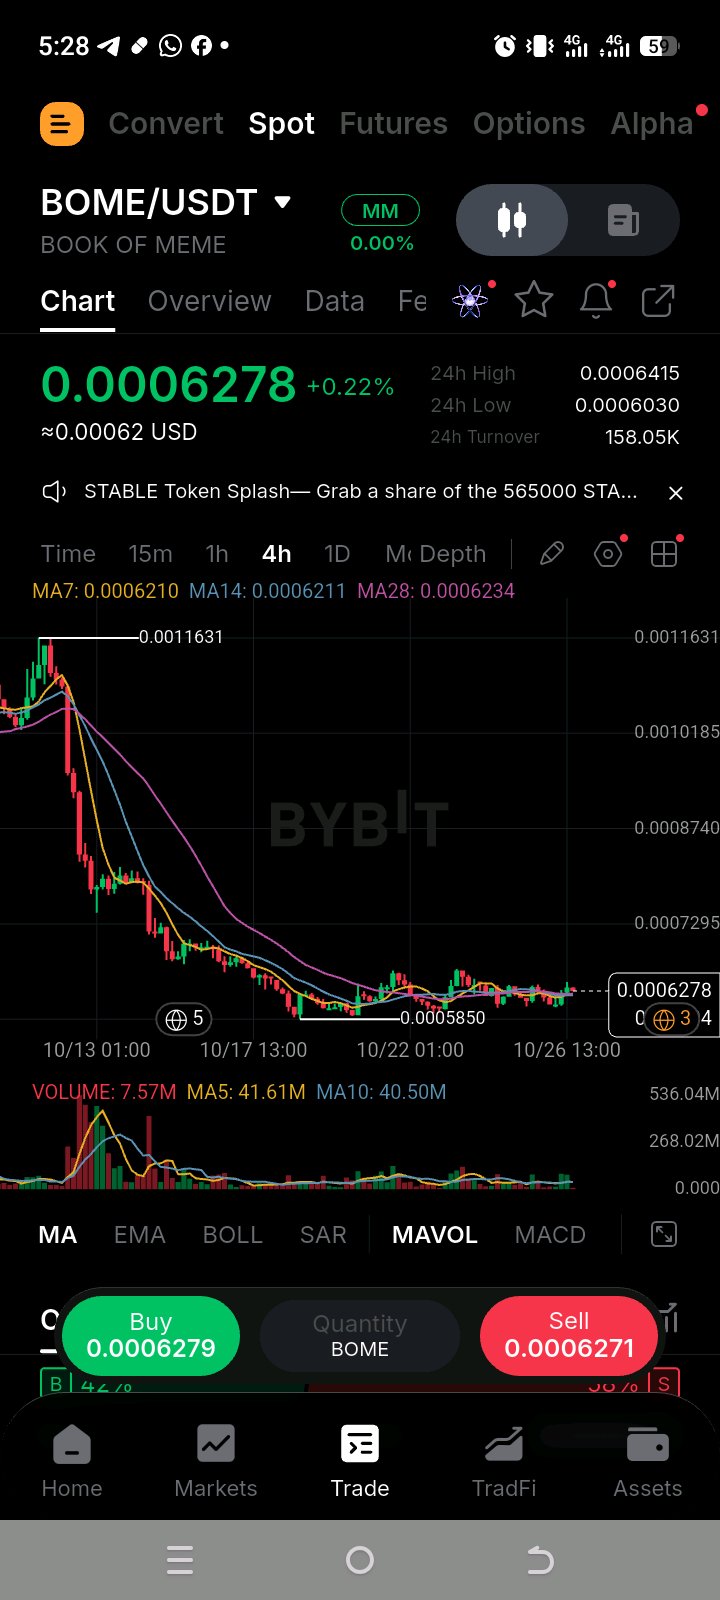
BOME/USDT is consolidating around $0.00062 after a sharp decline. Support sits near $0.000585, while $0.00064 is the key resistance to watch. A 4H breakout with rising volume could signal bullish momentum. Until then, patient is the key. $BOMEUSDT #IMPACTbyTrade #ByXIMPACT #MyByXTake
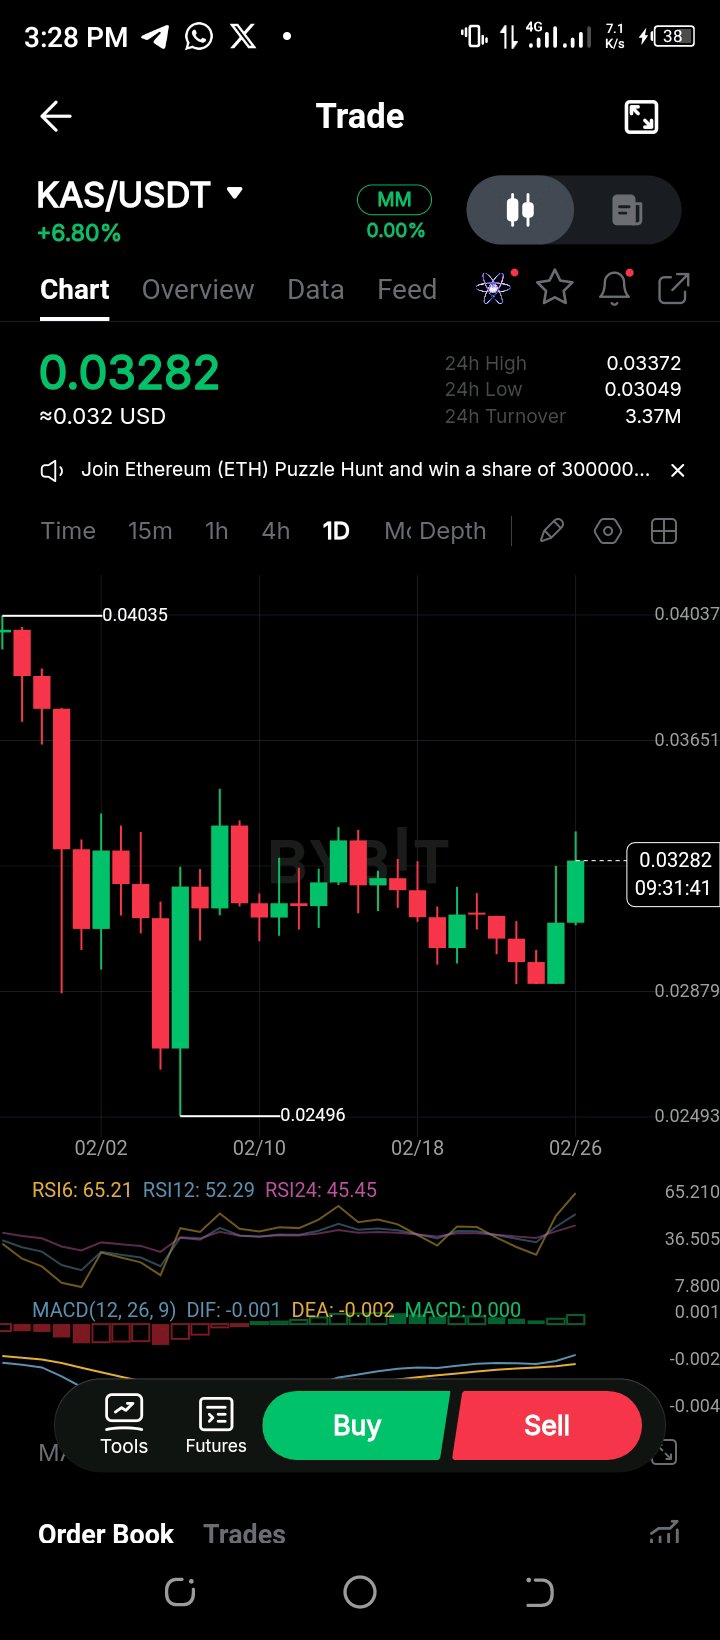
📊 $KASUSDT – Daily View KAS is showing a strong bounce from the 0.028–0.029 support zone, with buyers stepping in aggressively. The latest bullish candle suggests momentum is shifting short term. RSI is pushing above 65, indicating growing strength, while MACD is flattening with early signs of a bullish crossover. However, the broader structure still shows consolidation after the previous downtrend. If price holds above 0.030, continuation toward 0.034–0.036 is possible. A rejection near resistance could lead to another pullback. #DipAndEarnUp555%APR $KASUSDC #WednesdayAirdrop #TradeGoldandSilver #ByXLeaderboard #FarmMNTonAlpha
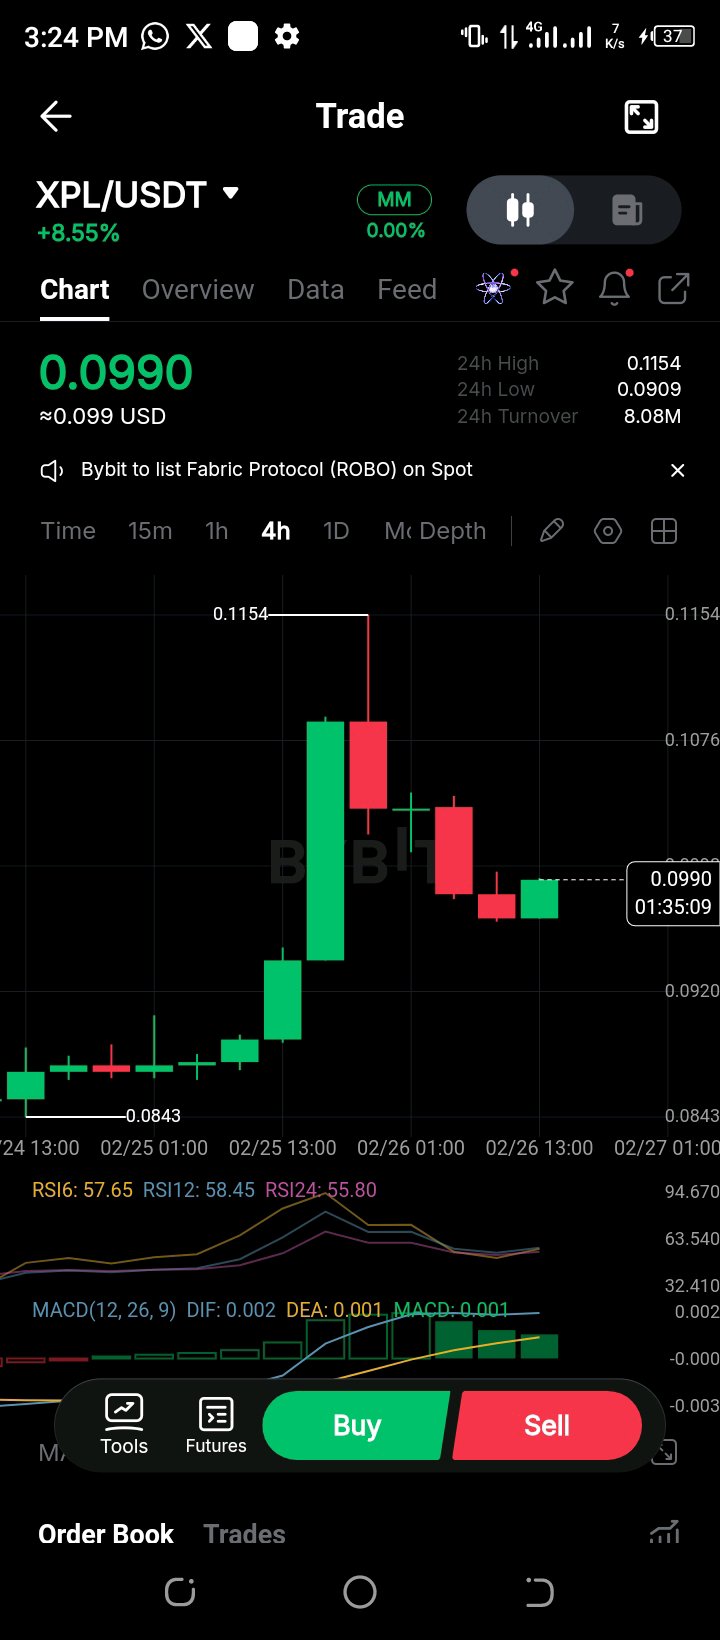
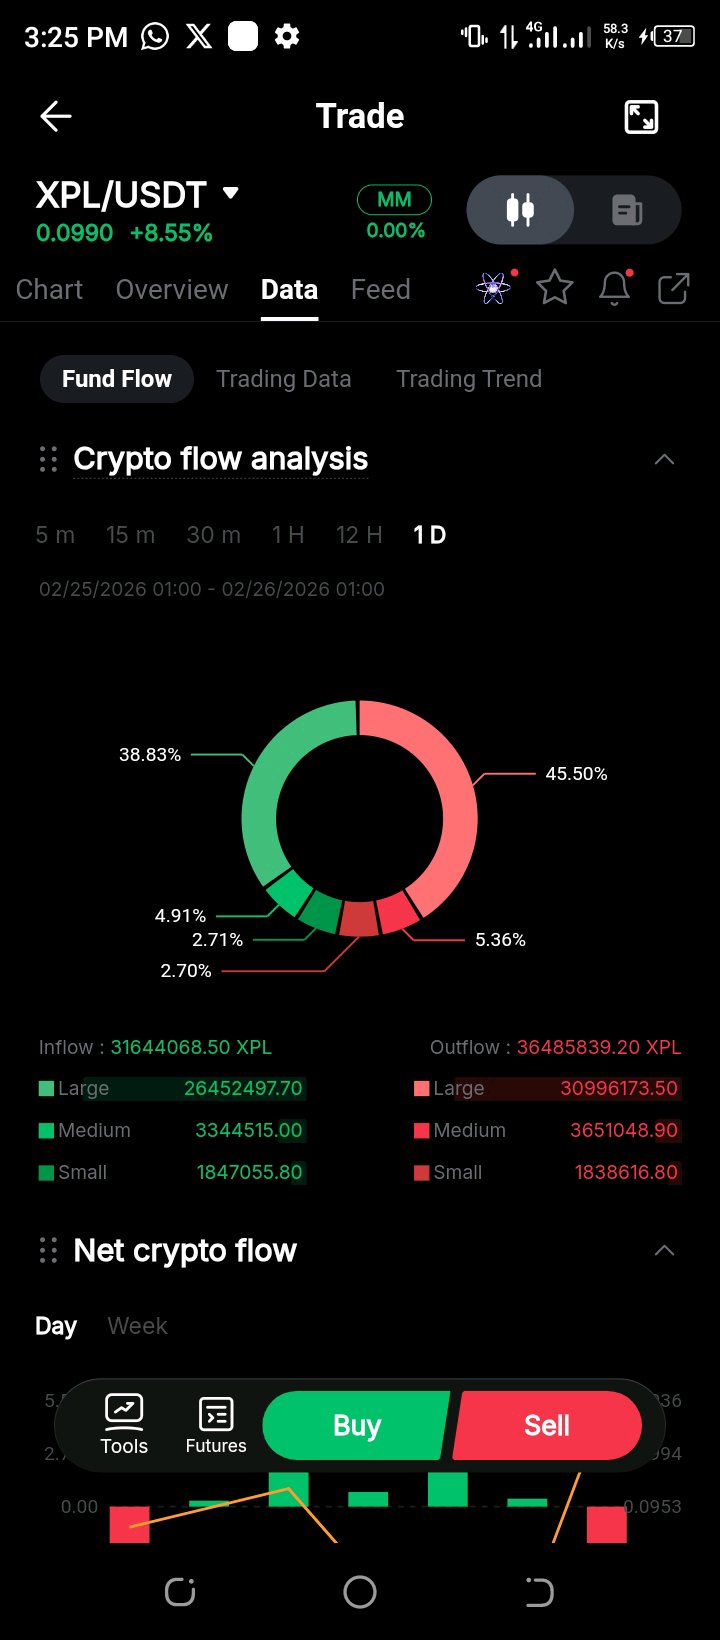
📊 $XPLUSDT – 4H Quick Analysis XPL shows strong bullish momentum after a sharp breakout from the 0.084 zone, rallying toward 0.115 before facing rejection. The pullback appears healthy so far, with price holding above previous breakout levels around 0.095–0.098. RSI remains above 55, indicating buyers still have control, though momentum has cooled slightly. MACD is positive, but histogram bars are shrinking, suggesting slowing upside pressure. If price holds above 0.095 support, continuation toward 0.110 is possible. A break below that zone may trigger deeper consolidation before the next move. #DipAndEarnUp555%APR #WednesdayAirdrop #TradeGoldandSilver #ByXLeaderboard #FarmMNTonAlpha
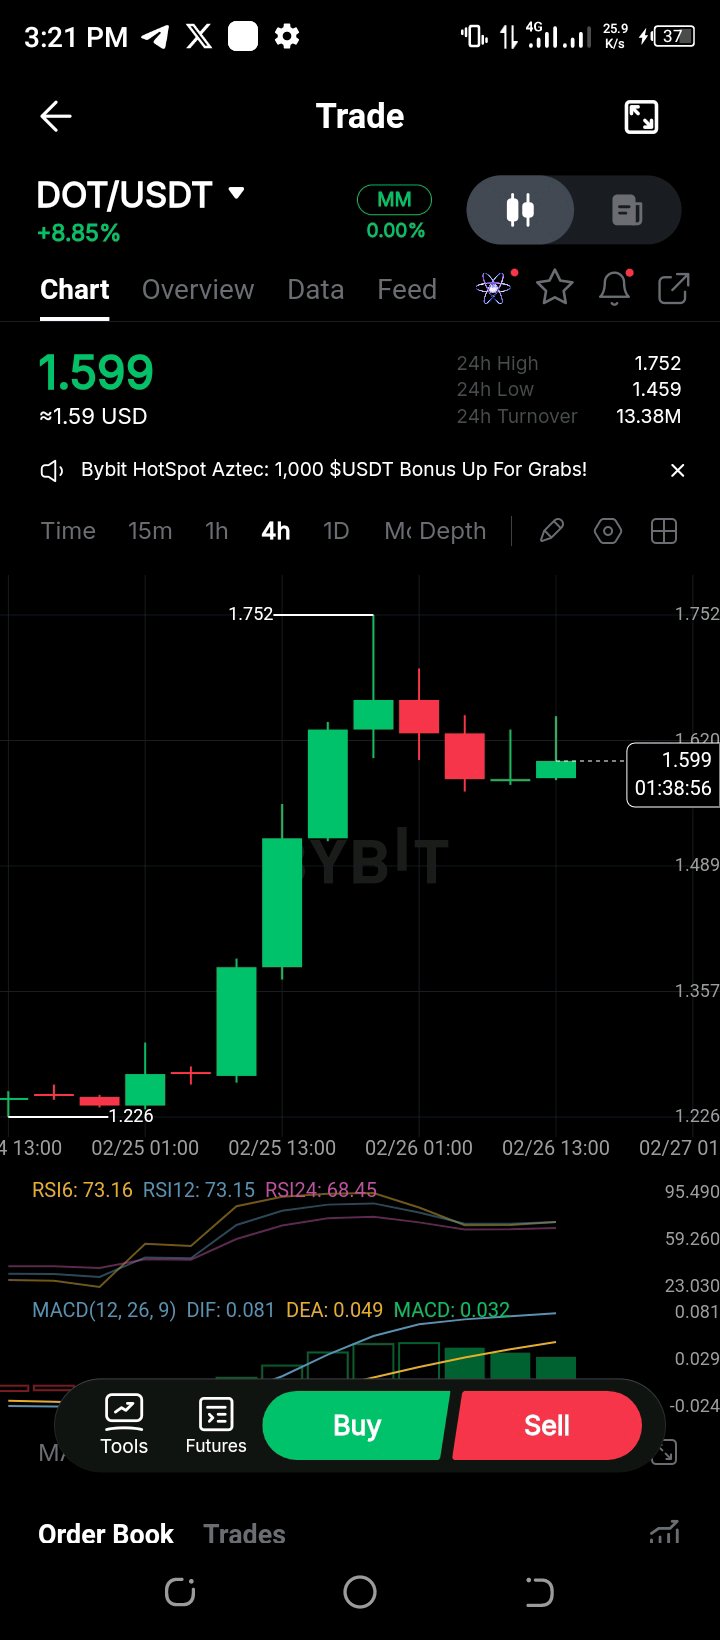
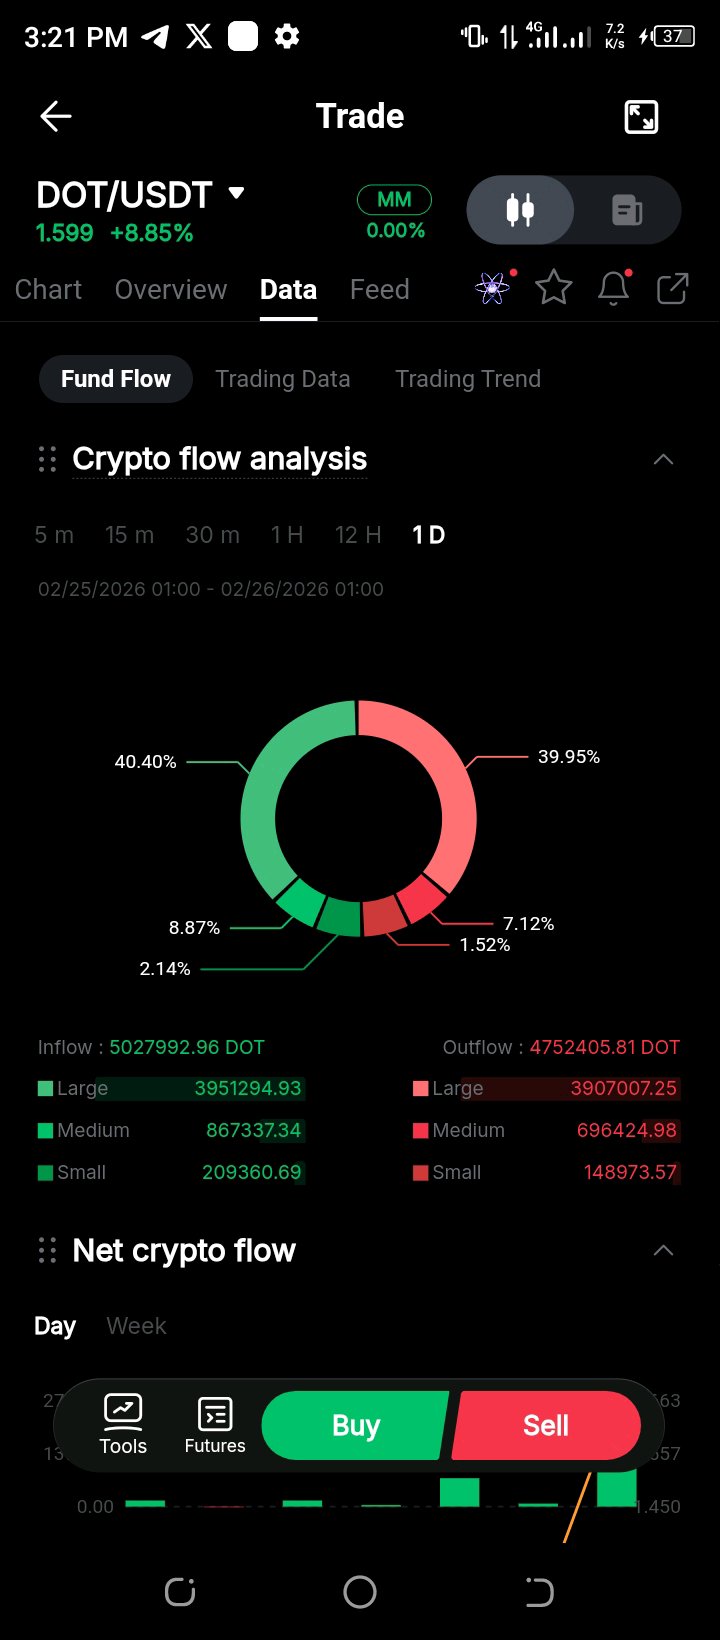
$DOTUSDT remains in a short-term bullish structure on the 4H timeframe after a strong impulsive move, now transitioning into consolidation just below the recent high. The series of higher lows suggests buyers are still defending momentum rather than distributing. Flow data supports this view, with inflows slightly exceeding outflows, indicating continued market interest and accumulation bias. However, elevated RSI signals momentum is stretched, so a brief range or shallow pullback could occur before continuation. Overall, the structure favors bullish continuation if support holds near the consolidation zone and buying pressure remains steady. 📊 Do you see this as healthy consolidation or the start of a deeper retrace? #DipAndEarnUp555%APR #TradeGoldandSilver #WednesdayAirdrop #ByXLeaderboard $DOTUSDC
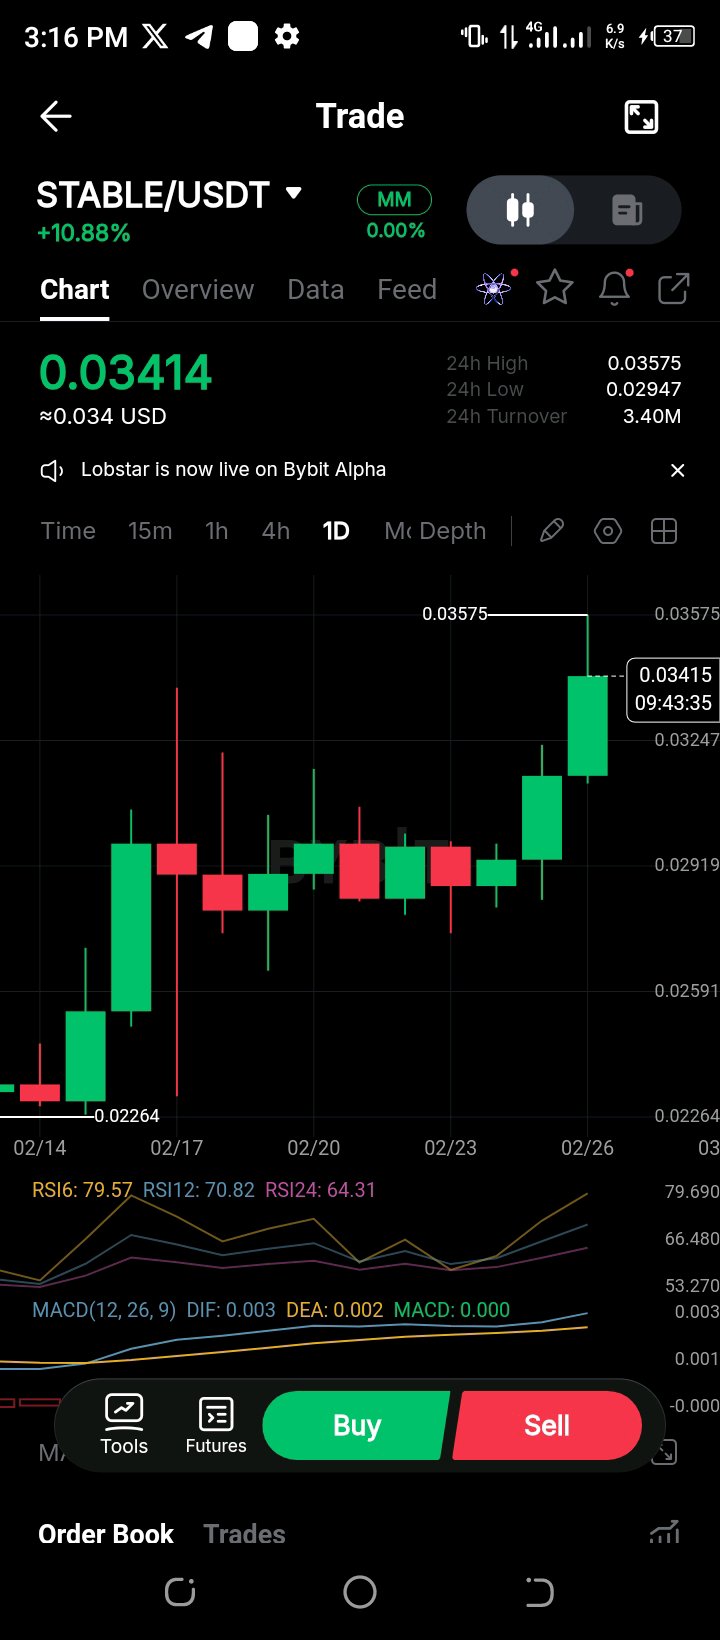
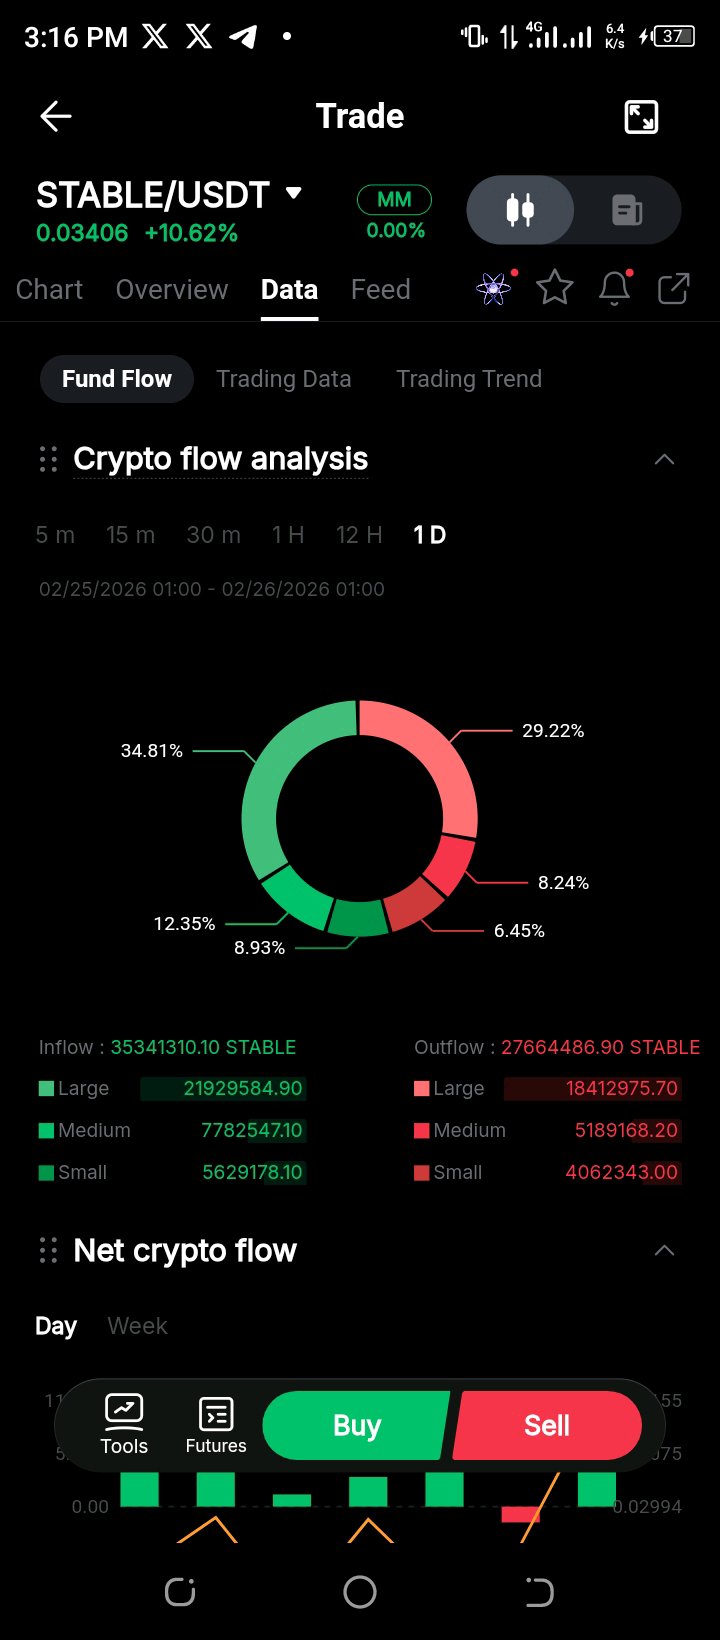
$STABLEUSDT is showing strong bullish structure on the daily timeframe, with price pushing higher after a steady series of higher lows. Momentum remains positive as buyers keep control, supported by a rising RSI and a constructive MACD profile. However, with momentum nearing overbought territory, short-term consolidation or a minor pullback wouldn’t be unusual before continuation. As long as price holds above the recent breakout area, the overall bias stays upward and dips may present opportunities rather than signs of weakness. Do you think this move has enough strength for another leg up, or is a cooldown more likely first? 📊 #DipAndEarnUp555%APR #TradeGoldandSilver #ByXLeaderboard #FarmMNTonAlpha
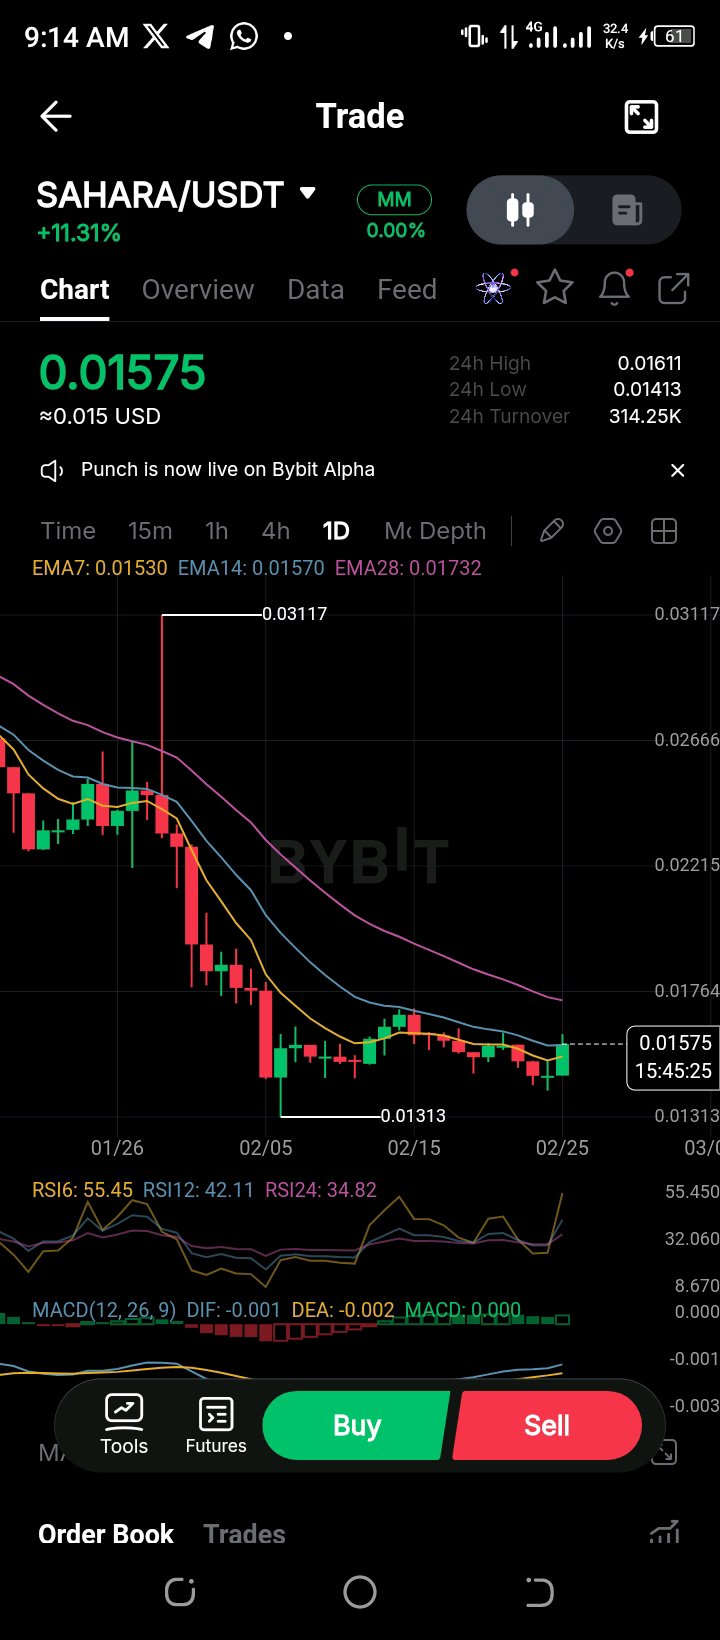
$SAHARAUSDT (1D) – Still Moving Price is bouncing from the $0.0131 low and now trading around $0.0157. RSI is pushing higher and MACD is flattening, showing momentum is slowly shifting. However, price is still below the 28 EMA, so the bigger trend hasn’t fully turned bullish yet. Short-term strength is visible, but confirmation needs a stronger break above recent resistance. Continuation or just a temporary push? 👀 #DipAndEarnUp555%APR #TradeGoldandSilver #ByXLeaderboard #FarmMNTonAlpha #TradFiVsCrypto
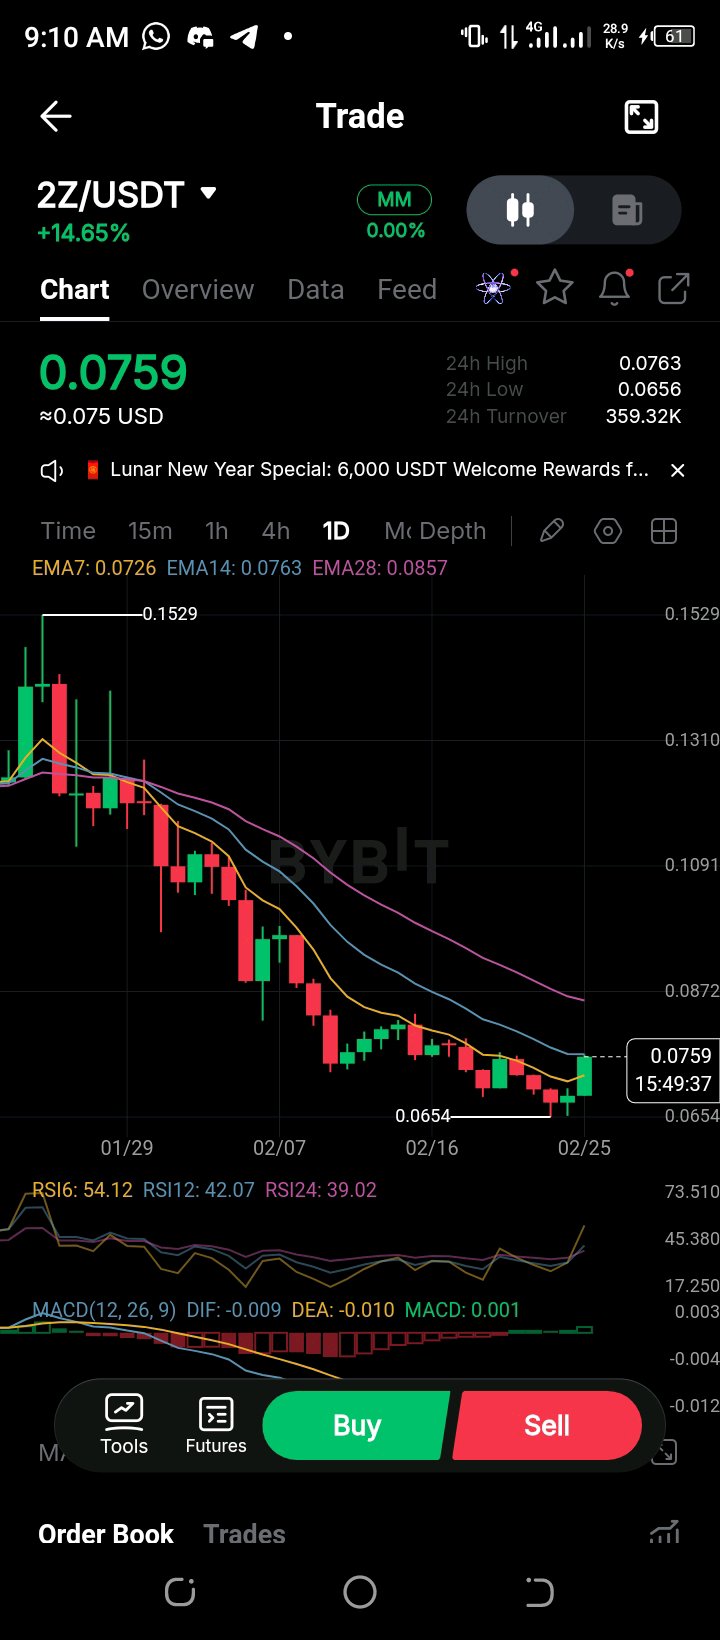
$2ZUSDC (1D) – End of Downtrend? Price bounced from the $0.065 support and is now pushing toward $0.076. RSI is climbing above 50 and MACD just turned slightly positive, early signs of momentum shift. That said, price is still below the 28 EMA, so the broader trend hasn’t fully flipped yet. For now, it’s a possible base formation, but confirmation needs a clean break above recent highs. Reversal starting or just another bounce? 👀 $2ZUSDT #DipAndEarnUp555%APR #TradeGoldandSilver #WednesdayAirdrop #FarmMNTonAlpha #ByXLeaderboard
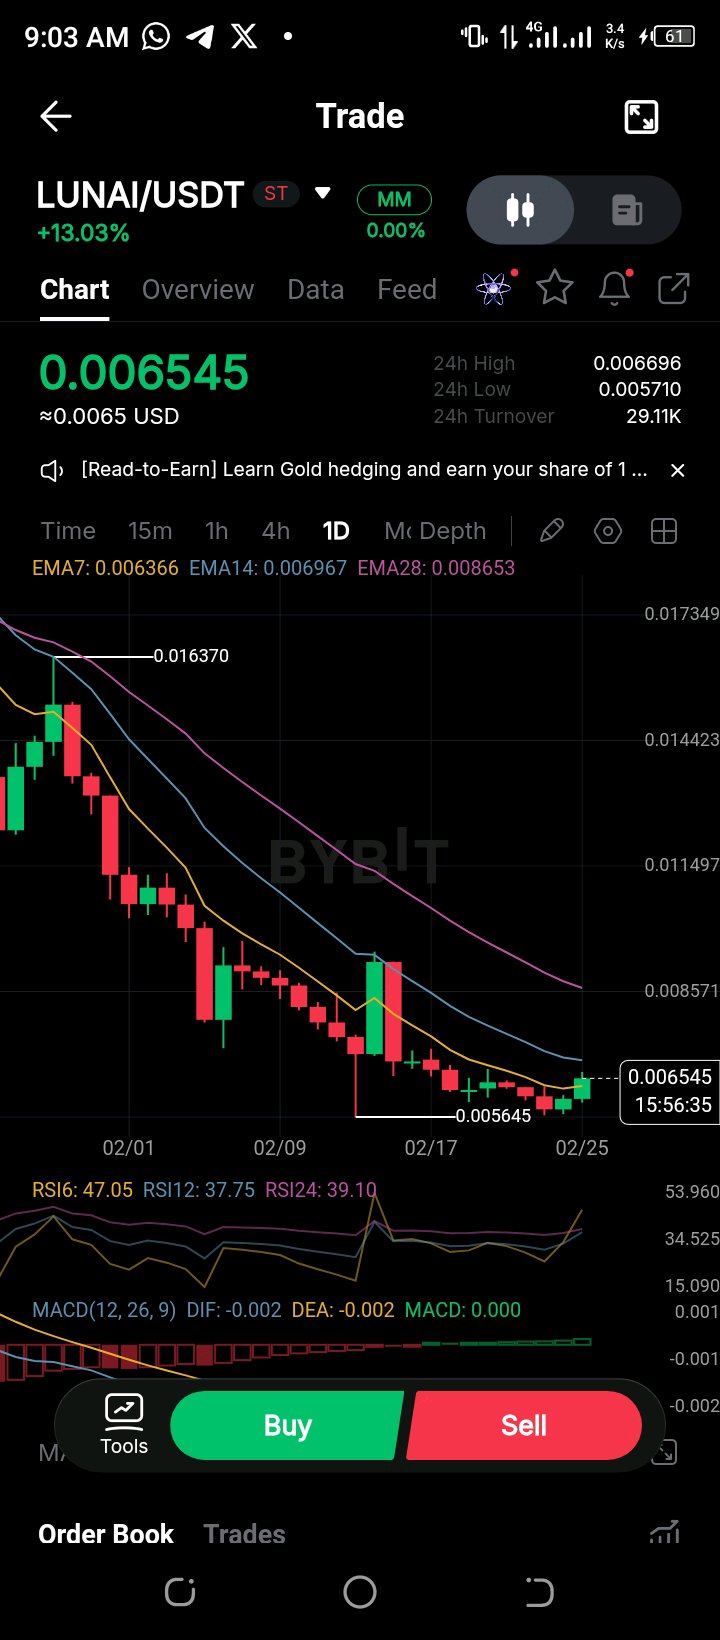
$LUNAIUSDT (1D) – Quick View Price bounced from the $0.0056 support and is now around $0.0065. RSI is recovering from near-oversold, and MACD is flattening, showing selling pressure is slowing. Trend is still down overall since price remains below key EMAs. For now, this looks like a short-term relief bounce unless we see a strong break above recent highs. Support or bull trap? #DipAndEarnUp555%APR #TradeGoldandSilver #WednesdayAirdrop #FarmMNTonAlpha #ByXLeaderboard $SOLUSDT
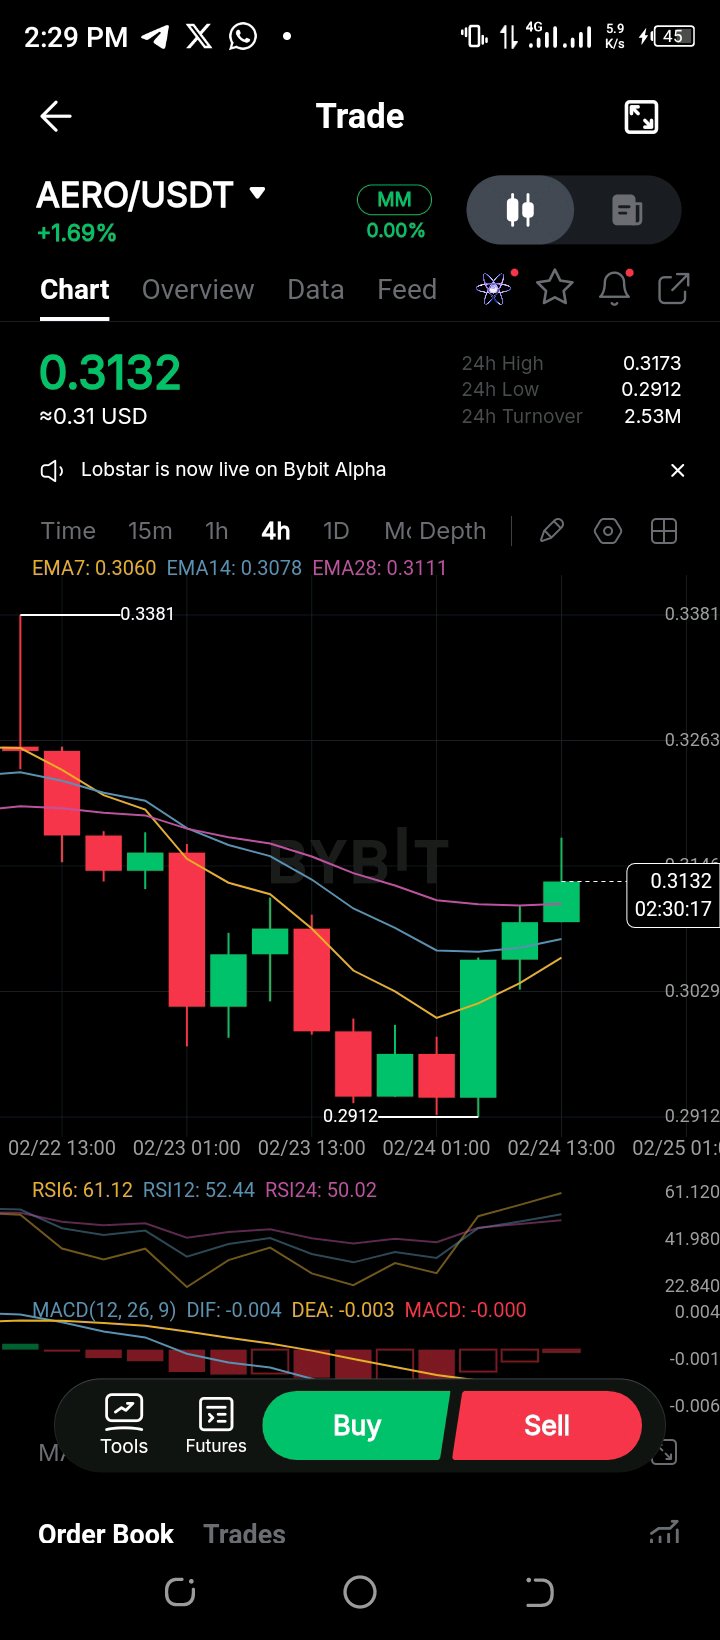
📊 $AEROUSDT – 4H Outlook AERO is starting to look healthier after bouncing from the 0.291 area. Buyers stepped in with strong candles, and price is now pushing above the short-term EMAs. That’s usually an early sign that momentum is shifting. RSI is above 60, which shows strength building, and MACD is slowly turning positive. It’s not a full breakout yet, but the pressure from sellers is clearly fading. If price can break and hold above the 0.318–0.320 zone, we could see continuation. If not, a small pullback or consolidation would be normal before the next move. #DipAndEarnUp555%APR #TradeGoldandSilver #ByXLeaderboard #BuyTheDipOrWait
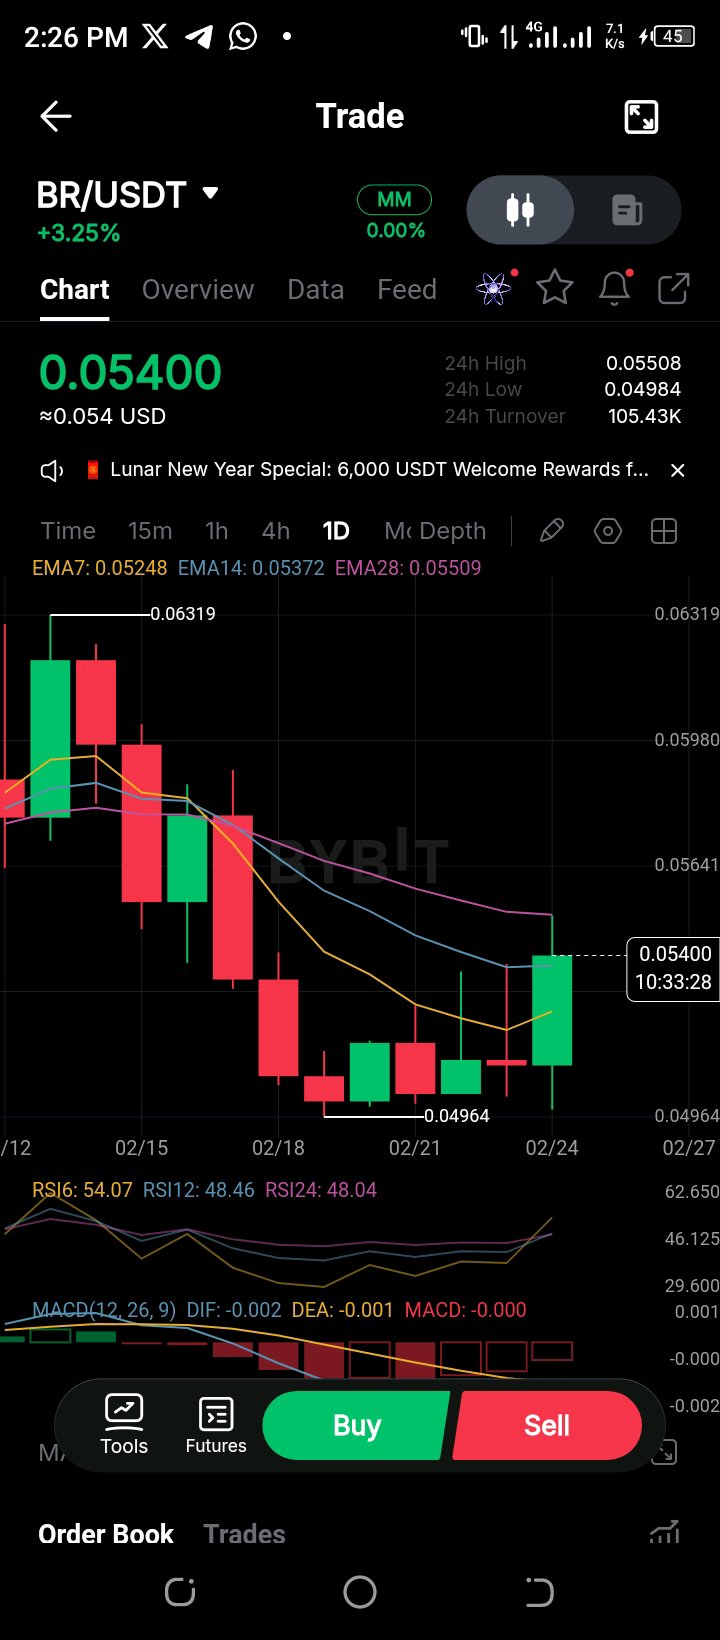
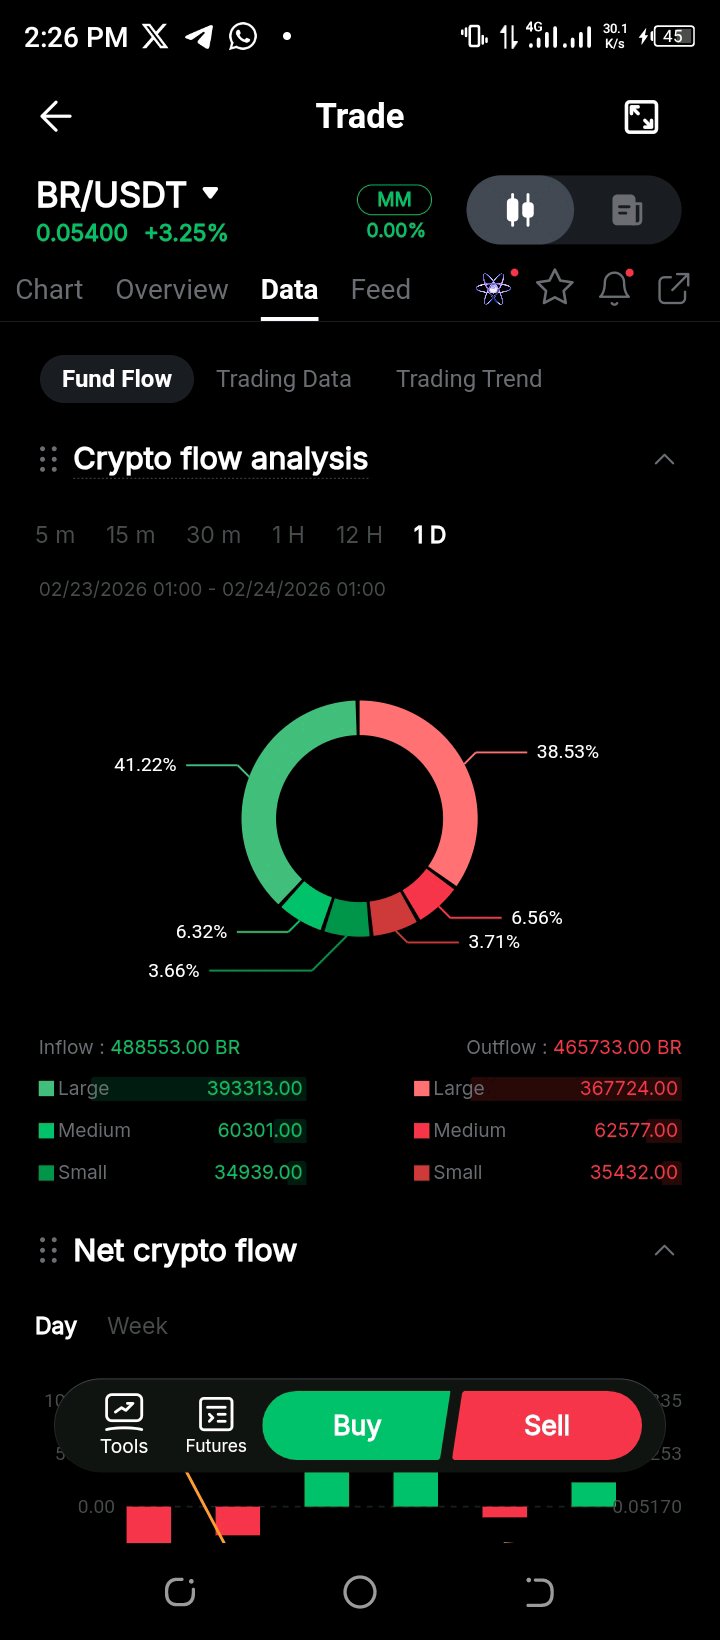
📊 $BRUSDT – Daily Timeframe Insight BR/USDT is attempting a short-term recovery after bouncing from the 0.049 support zone. Price has printed a strong bullish candle and is now testing the EMA cluster (7/14/28), which could act as immediate resistance. RSI is climbing above 50, signaling improving momentum, while MACD is flattening with early signs of a potential bullish crossover. This suggests selling pressure is weakening. However, the broader structure still shows lower highs, so confirmation above the 0.055–0.056 resistance zone is key. A clean breakout could shift sentiment bullish, but rejection here may lead to another pullback. #DipAndEarnUp555%APR #WednesdayAirdrop #ByXLeaderboard #TradeGoldandSilver #FarmMNTonAlpha
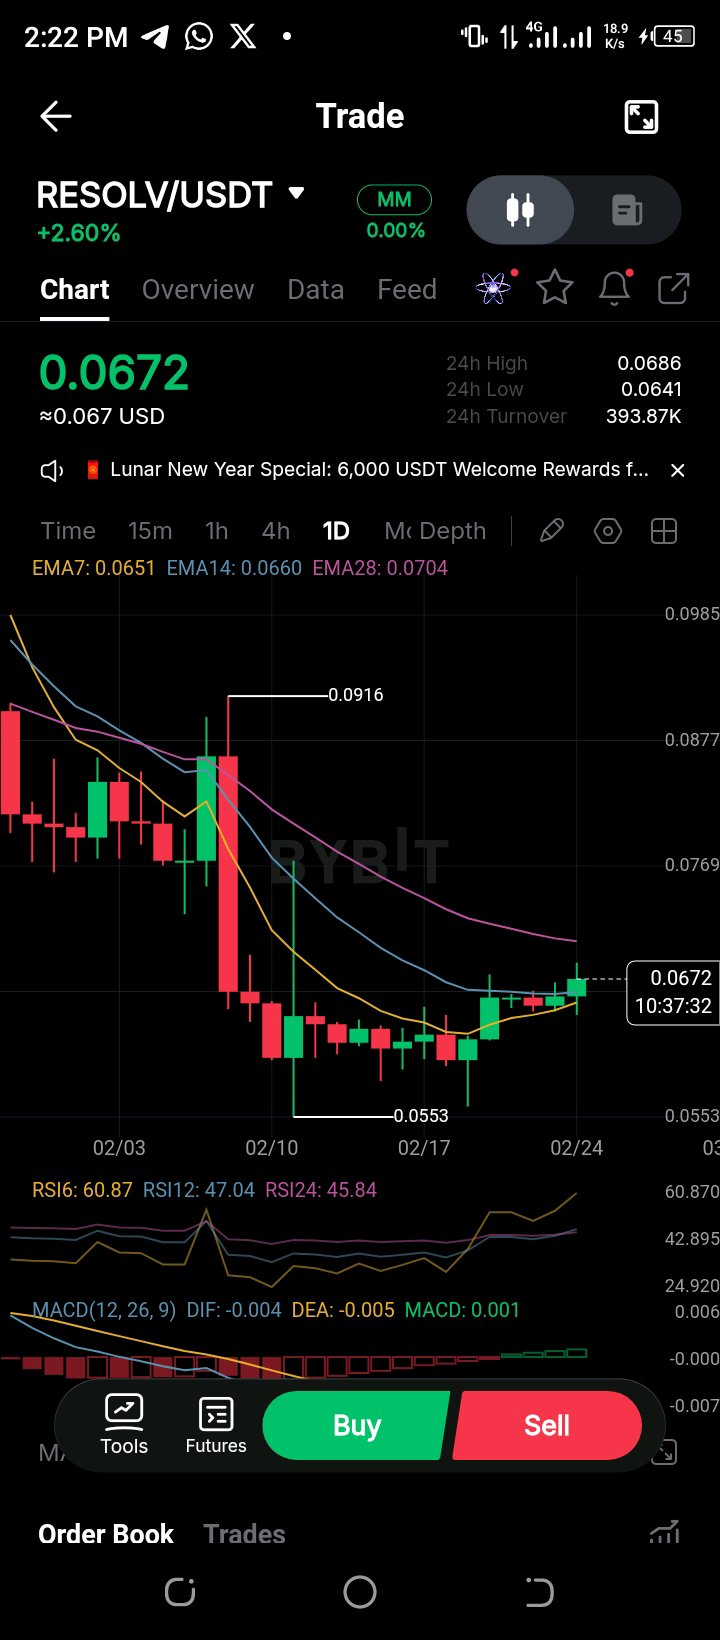
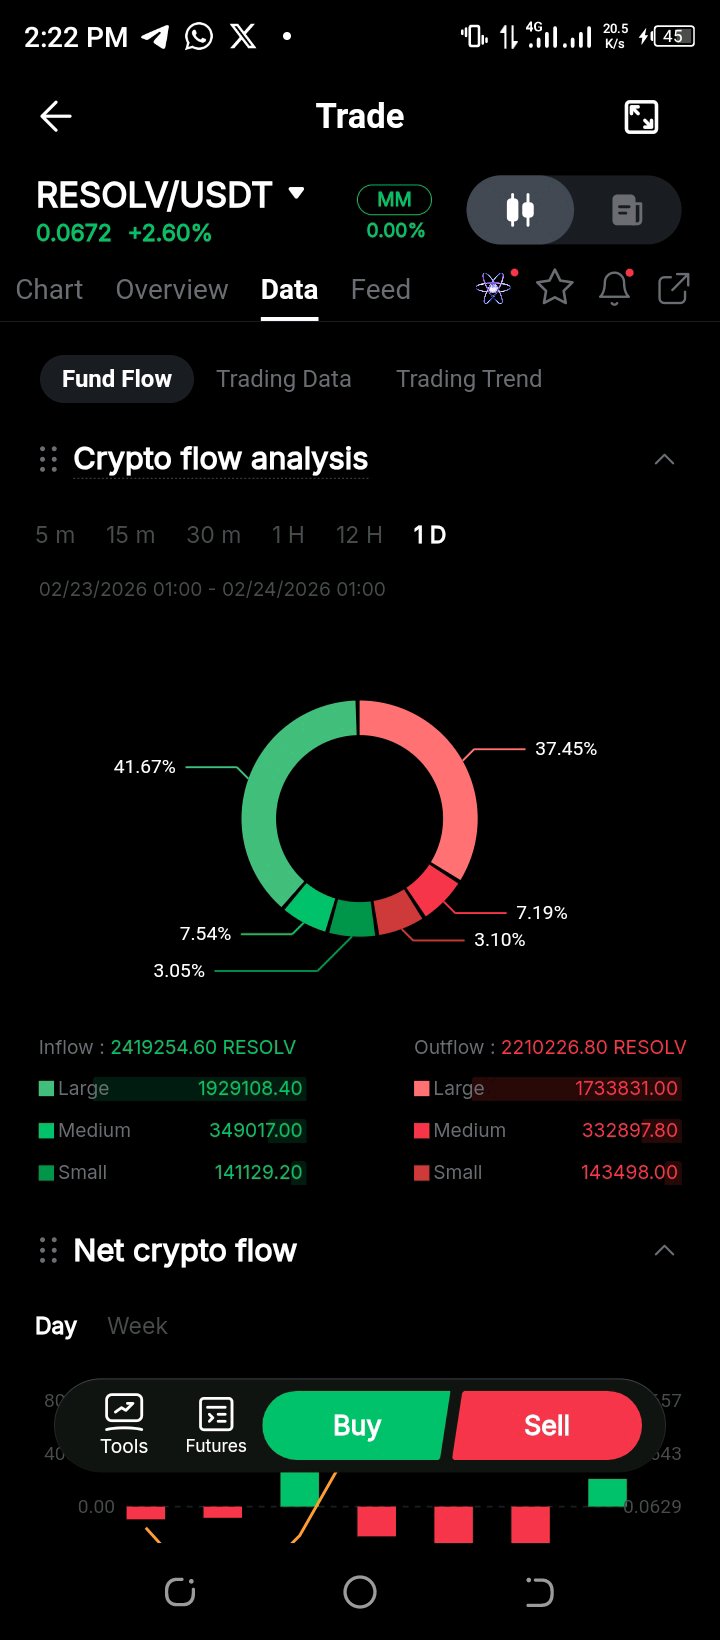
📊 $RESOLVUSDT – Daily Outlook RESOLV is showing early signs of recovery after bouncing from the 0.055 support zone. Price is gradually forming higher lows, suggesting buyers are slowly stepping back in. RSI is pushing above 60, reflecting strengthening momentum, while MACD has started to turn positive with a small bullish histogram. However, price is still trading below the 28 EMA, meaning the broader trend remains cautious. A strong close above nearby resistance and key EMAs would confirm continuation. For now, momentum is improving, but confirmation is still needed. #DipAndEarnUp555%APR #TradeGoldandSilver #WednesdayAirdrop #FarmMNTonAlpha #TradFiVsCrypto
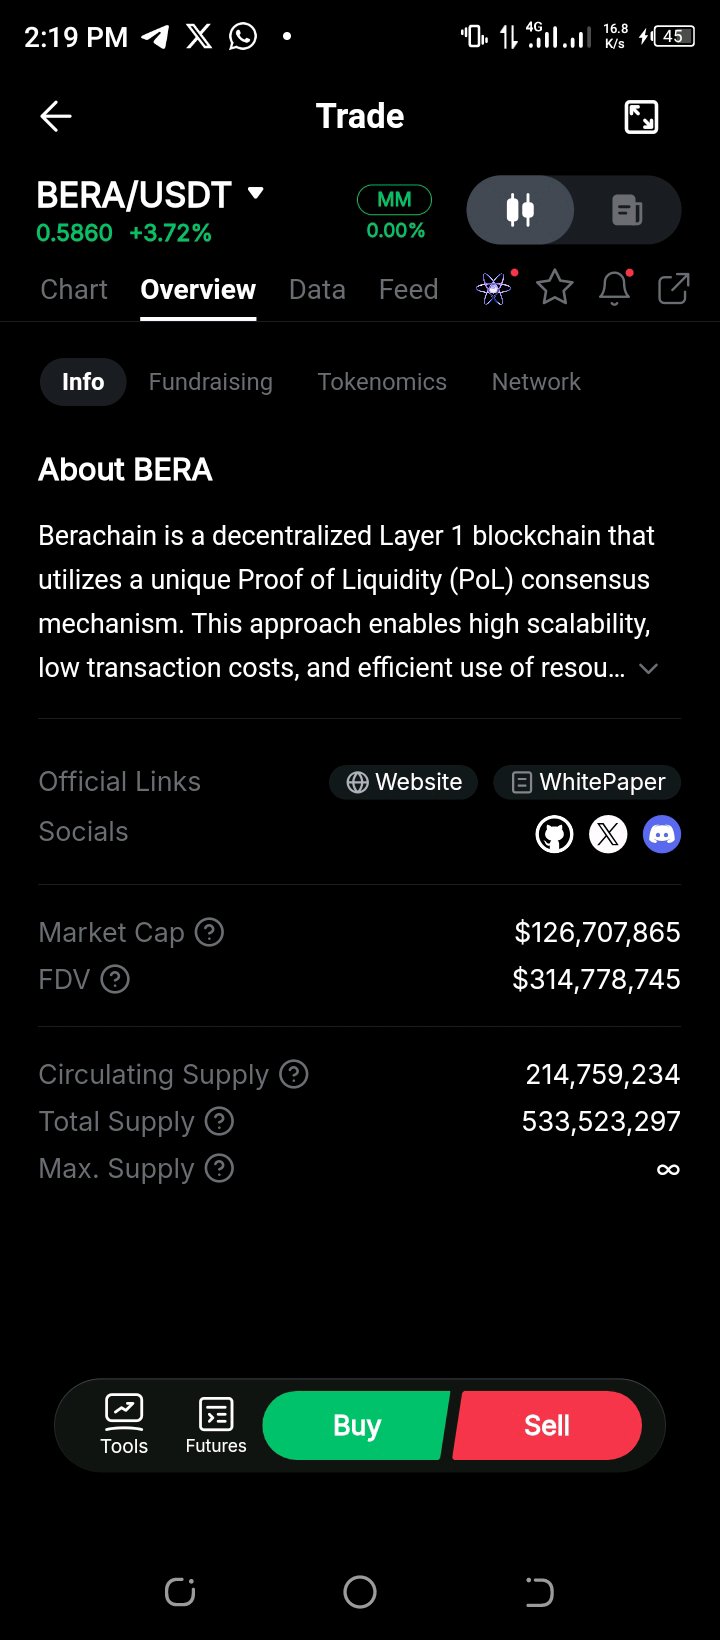
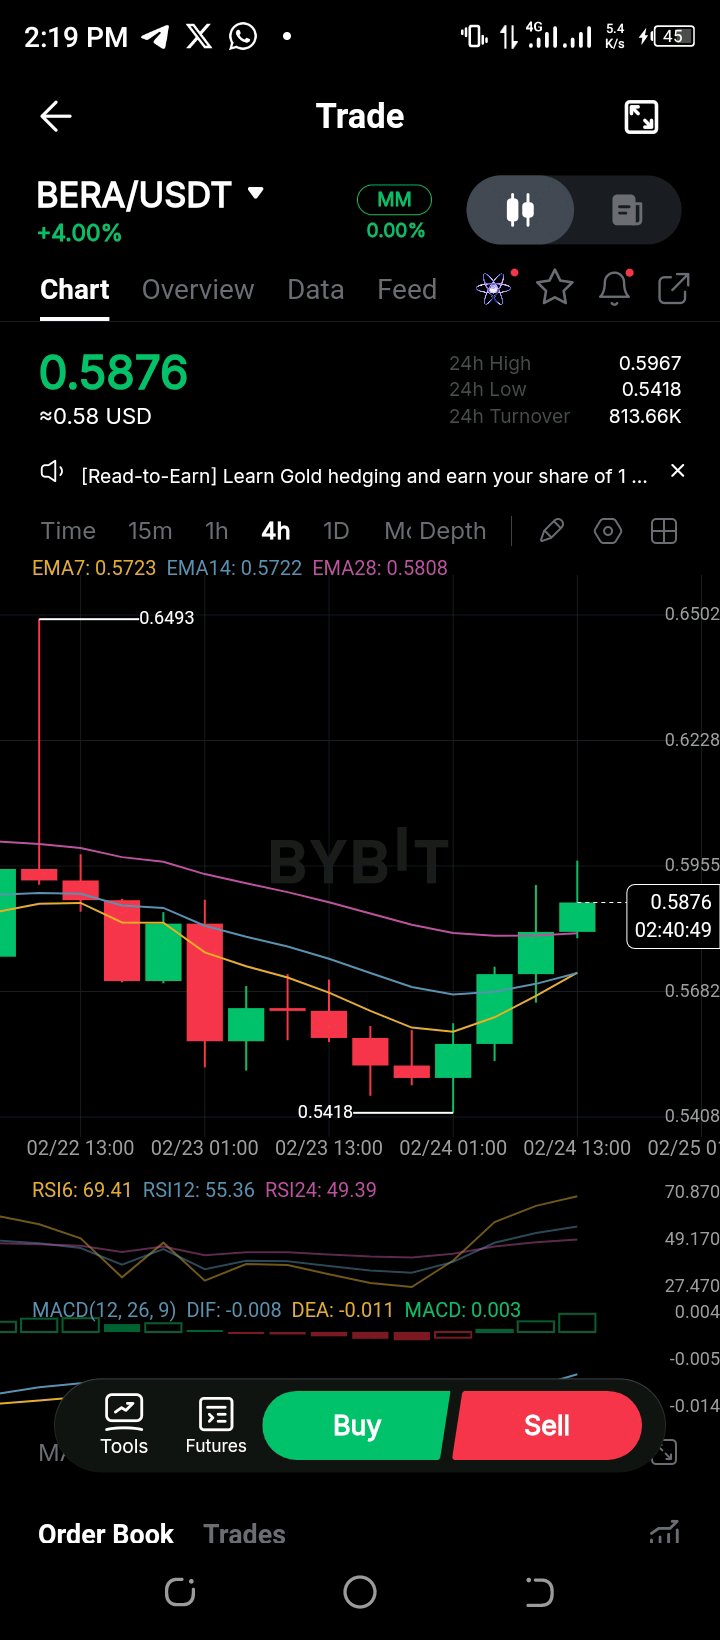
$BERAUSDT is showing a short-term bullish recovery after bouncing strongly from the recent support zone around 0.54. Price is now climbing above key short EMAs with rising RSI and positive MACD momentum, signaling increasing buyer strength. If this momentum holds, a retest of the 0.60–0.65 resistance zone becomes likely. From a fundamentals perspective, BERA is backed by Berachain’s unique Proof-of-Liquidity model, designed to boost network efficiency, scalability, and real DeFi participation. This strong ecosystem utility supports long-term demand while the current structure suggests early accumulation turning into a breakout attempt. #DipAndEarnUp555%APR #DepositToRecover #BuyTheDipOrWait #ByXLeaderboard #FarmMNTonAlpha $BERAUSDC
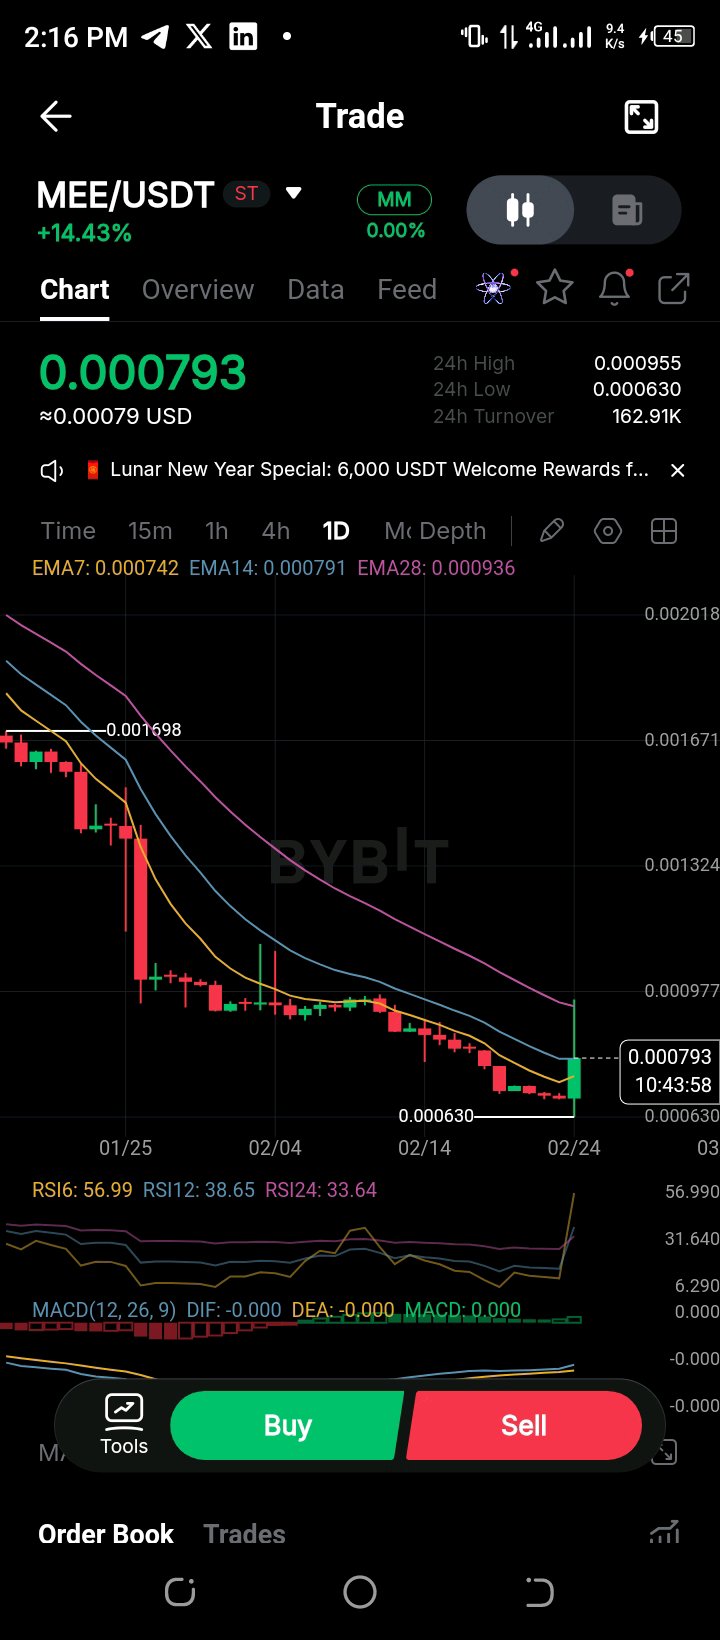
$MEEUSDT is showing early signs of a bullish reversal after a prolonged downtrend, with price bouncing strongly from the recent support zone. The sharp green candle and rising RSI indicate increasing buying pressure and momentum shift toward bulls. Price is now attempting to reclaim short-term EMAs, which suggests growing strength. If MEE holds above the current support area, a continuation toward the next resistance zone is likely as buyers step in. #DipAndEarnUp555%APR #TradeGoldandSilver #ByXLeaderboard #FarmMNTonAlpha #TradFiVsCrypto
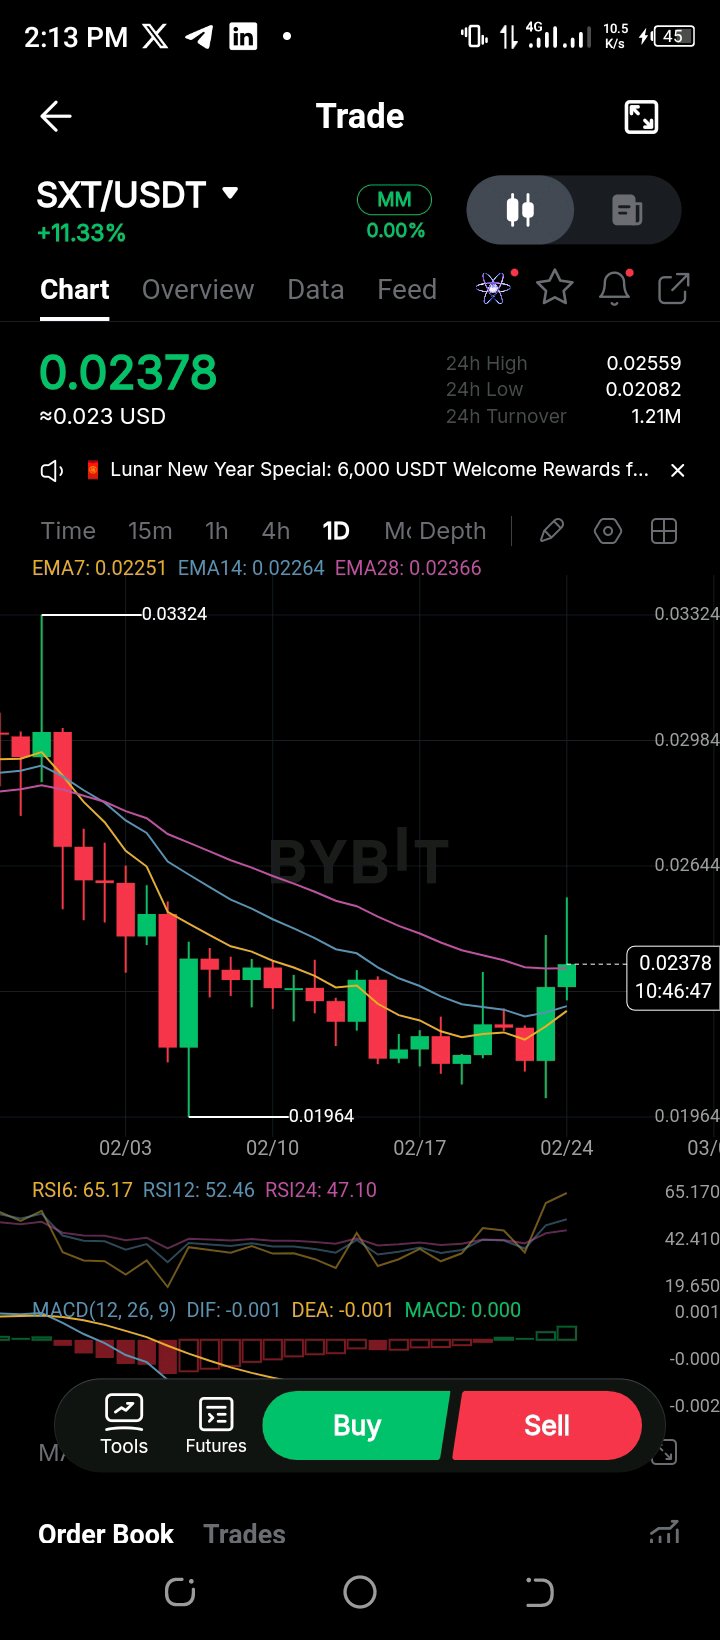
$SXTUSDT is showing a short-term bullish shift after bouncing from recent lows, with price now reclaiming key short-term EMAs. Rising RSI and strengthening momentum suggest buyers are gaining control. If price holds above the current support zone, continuation toward the next resistance level is likely. what's your take? #DipAndEarnUp555%APR #TradeGoldandSilver #ByXLeaderboard #WednesdayAirdrop #TradFiVsCrypto
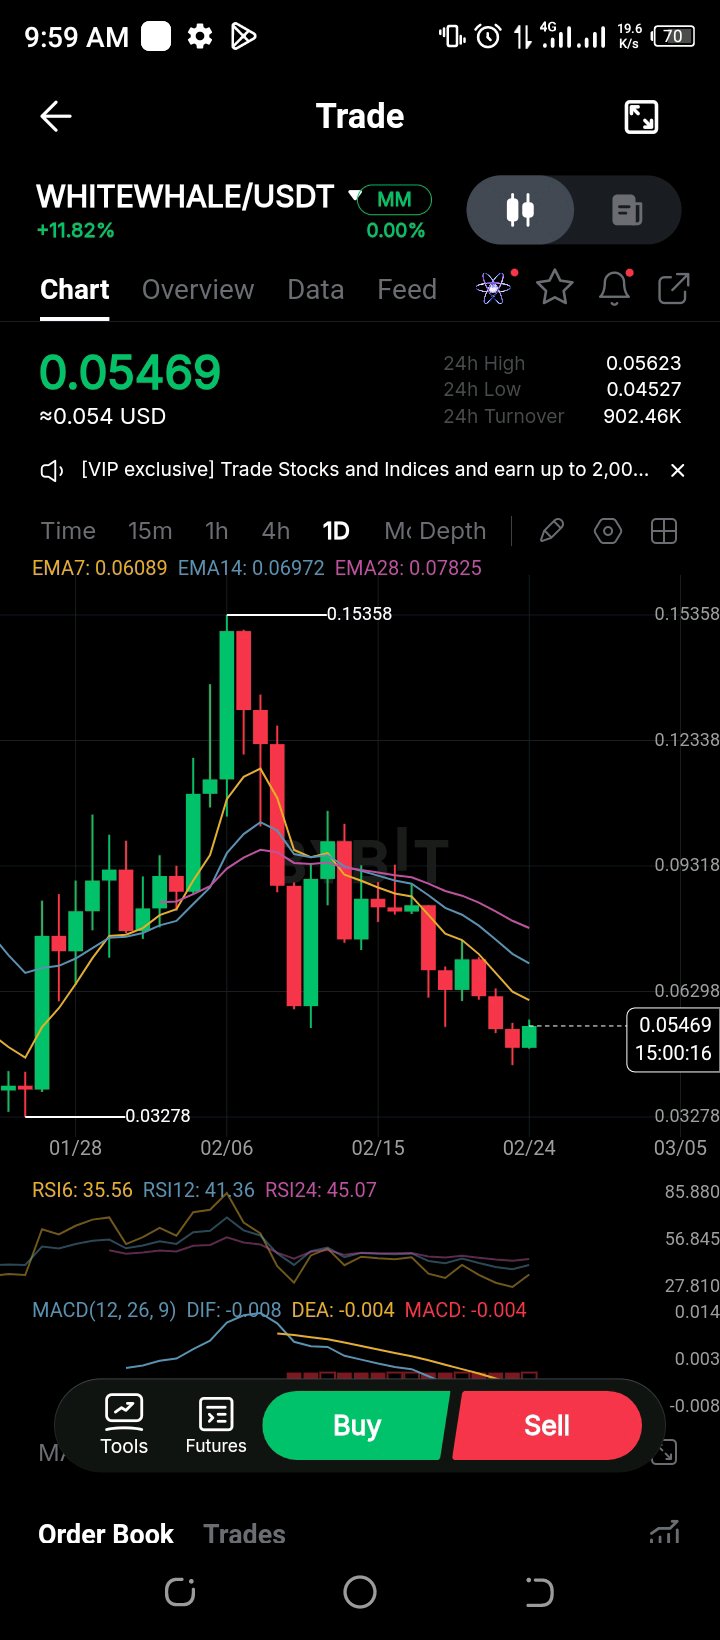
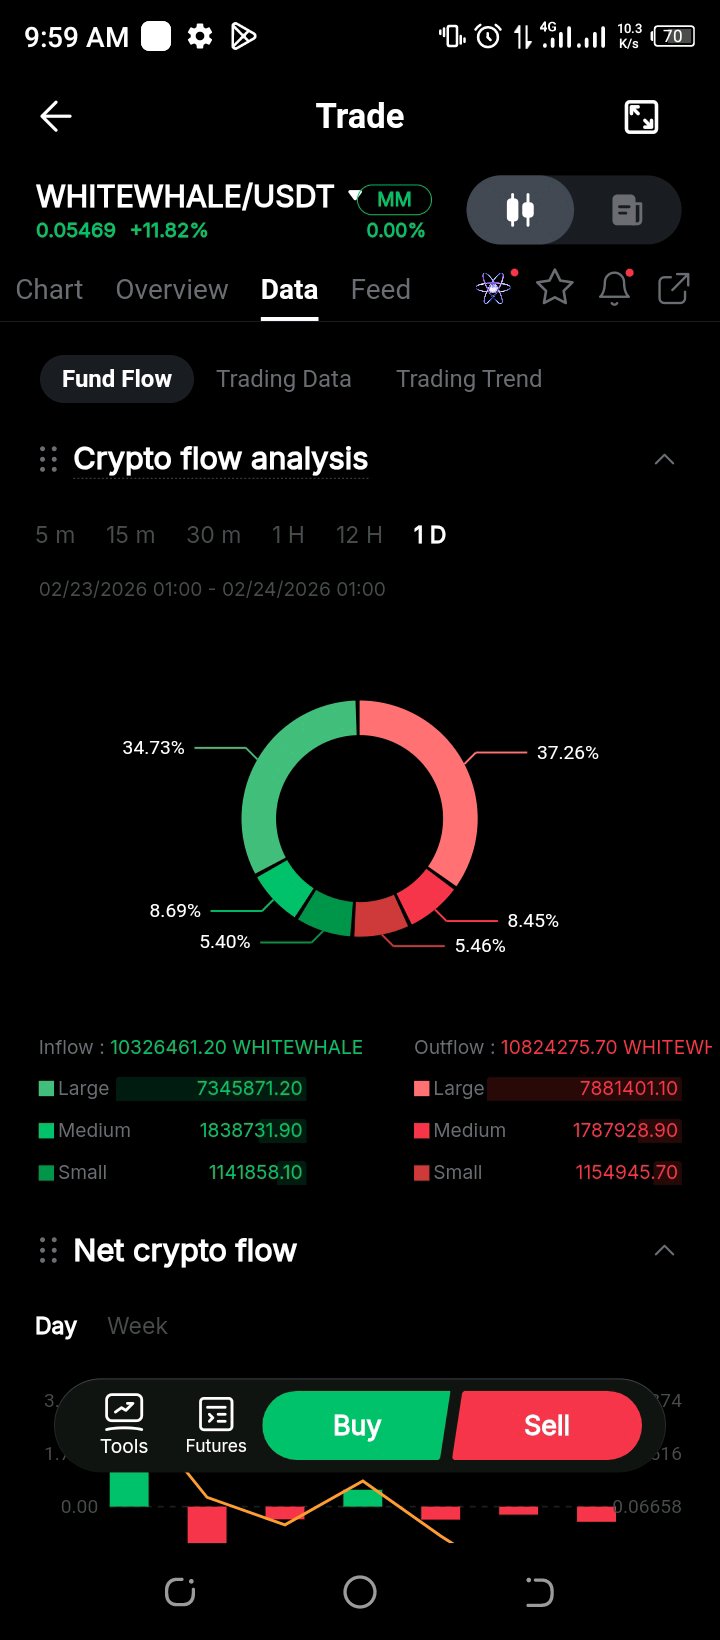
📊 $WHITEWHALEUSDT – Daily Timeframe Outlook WHITEWHALE is still trading in a clear short-term downtrend after the strong rejection from the 0.15 zone. Price continues to print lower highs and lower lows, showing sellers are still in control. RSI is hovering in the mid-30s to low-40s range, indicating weak momentum but also approaching oversold territory. MACD remains bearish, with histogram slightly negative, suggesting downside pressure hasn’t fully faded. However, the recent small bounce near the 0.05 area could signal early buyer interest. For a stronger bullish case, price needs to reclaim short-term EMAs and break the lower high structure. Until then, this looks like a cautious watch zone rather than aggressive entry. #DipAndEarnUp555%APR #TradeGoldandSilver #ByXLeaderboard #WednesdayAirdrop
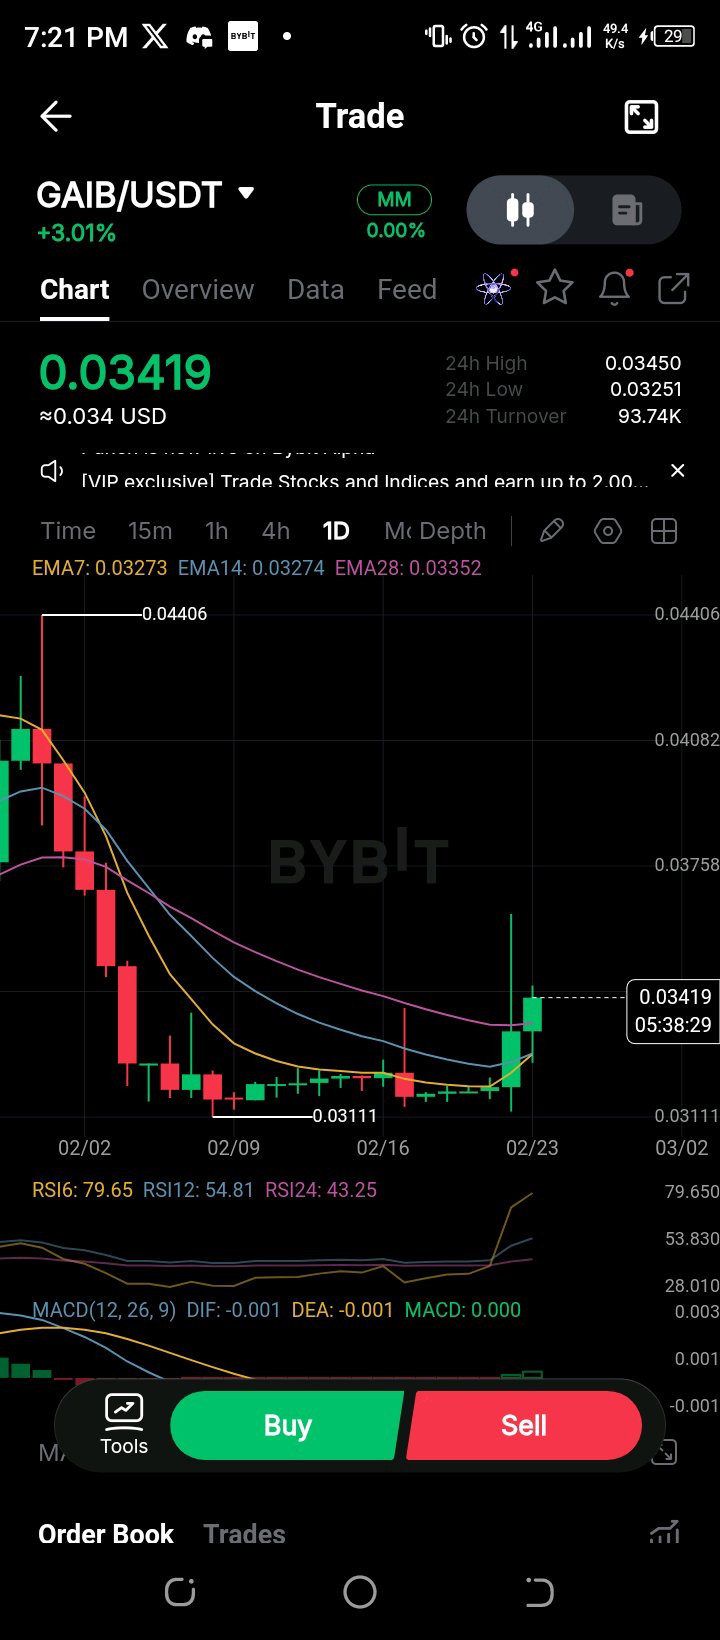
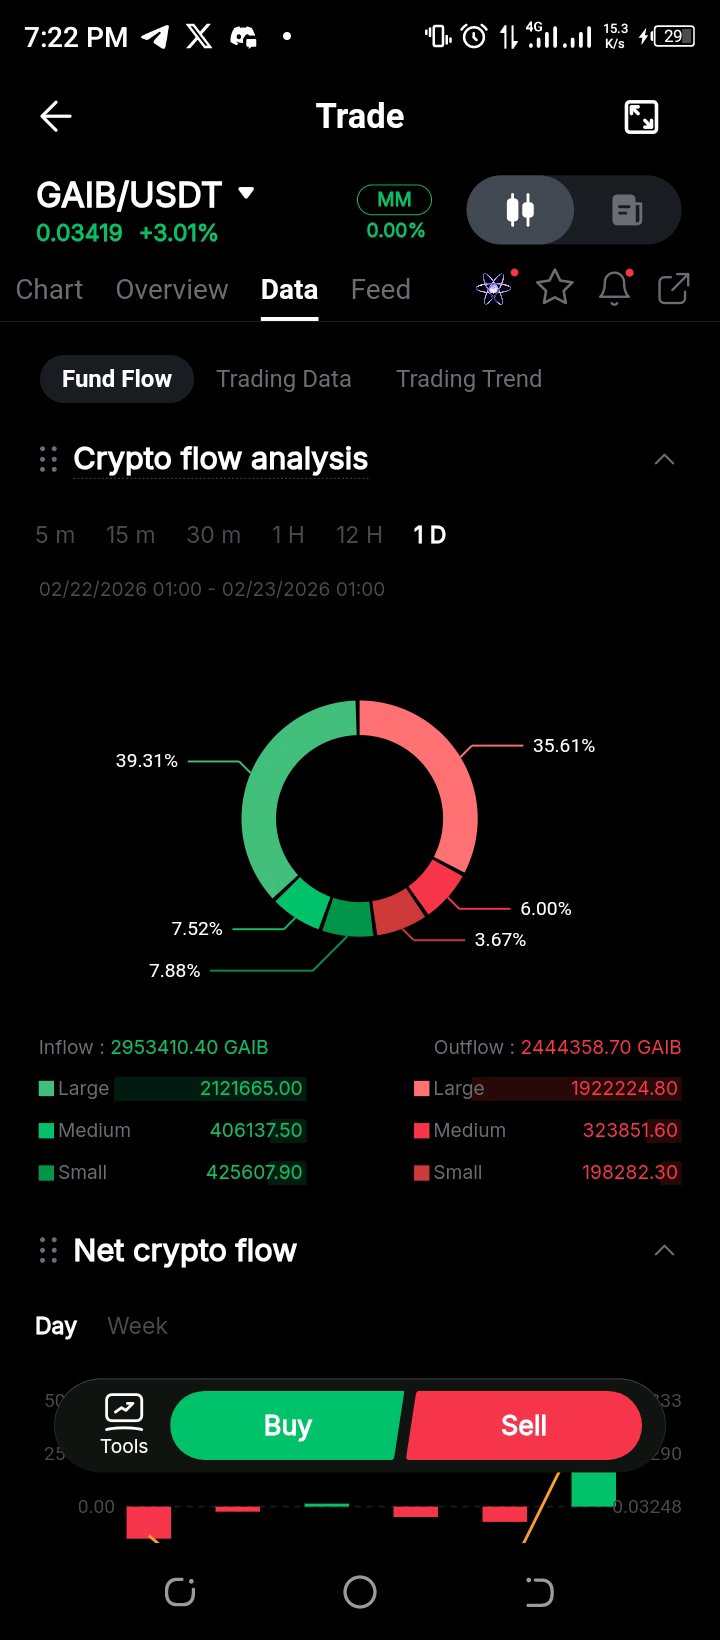
$GAIBUSDT Trend Reversal Analysis GAIB/USDT is showing early technical signals that may indicate the possible end of the downtrend, although confirmation is still developing. After a prolonged bearish structure marked by lower highs and consistent selling pressure, price has formed a consolidation base near the 0.031 support zone, followed by a strong bullish breakout candle reclaiming short-term EMA levels. RSI has surged into bullish territory, reflecting strong momentum expansion, while MACD is flattening with signs of a potential bullish crossover, often an early indication of trend exhaustion on the bearish side. The recent increase in buying volume also suggests accumulation activity rather than simple short-term relief. If price successfully holds above the EMA cluster and maintains higher lows, this could confirm a transition from downtrend to accumulation or early uptrend phase. However, sustained volume and resistance breakout confirmation remain key for a full trend reversal. 📈 #DipAndEarnUp555%APR #TradeGoldandSilver #WednesdayAirdrop #FarmMNTonAlpha #TradFiVsCrypto
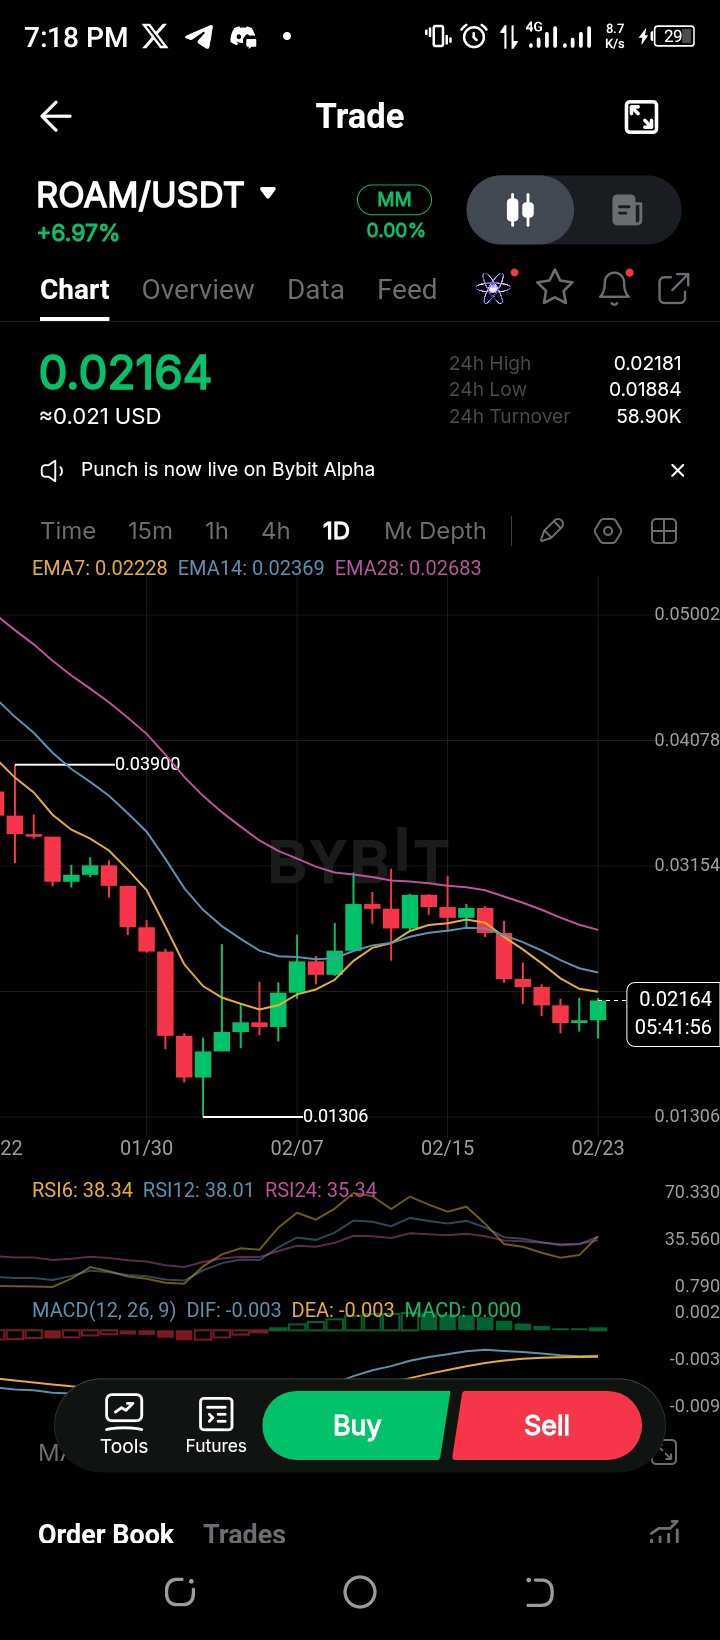
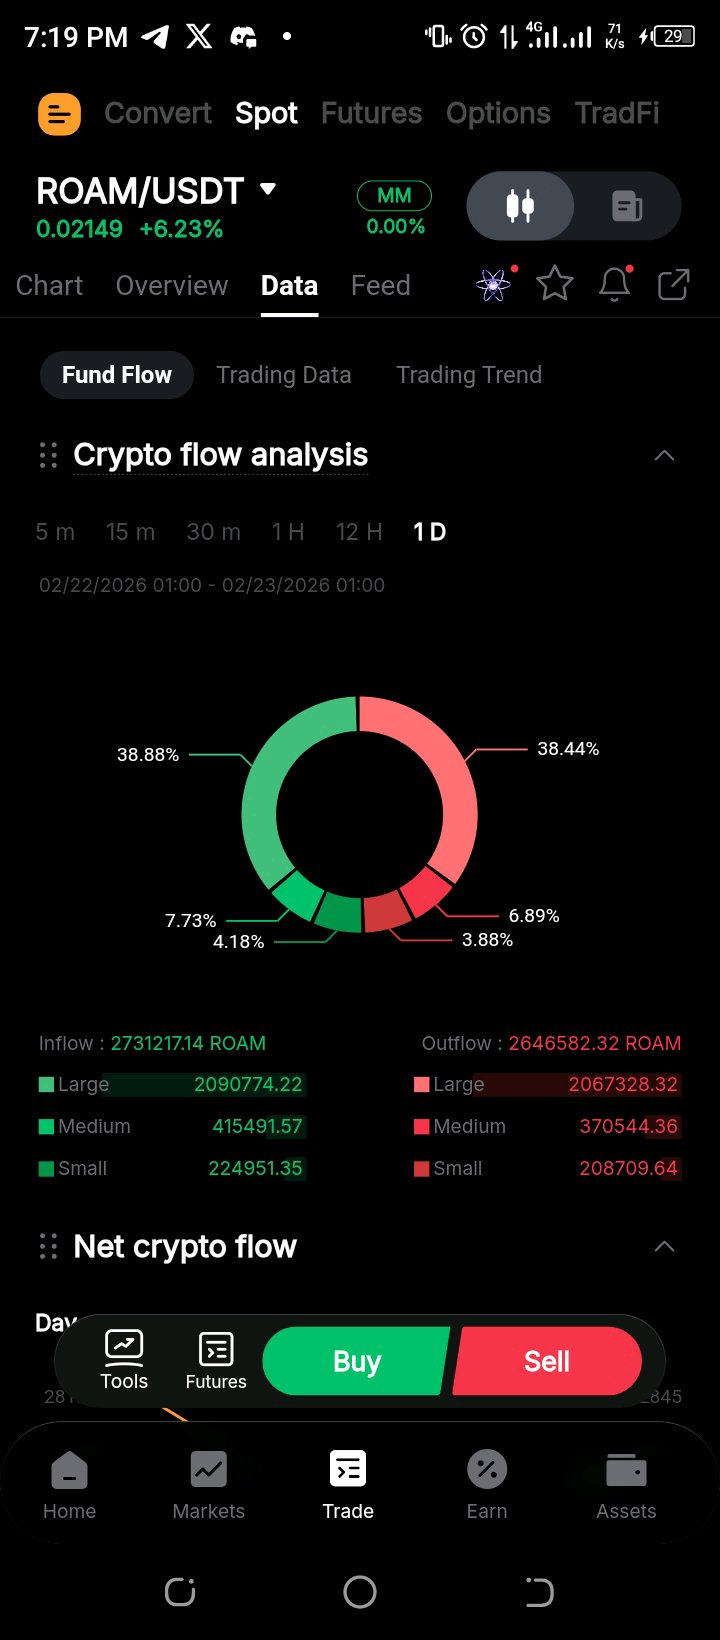
$ROAMUSDT Short Technical Analysis ROAM/USDT is showing early recovery signs after a prolonged downtrend, with price attempting to stabilize above the recent local support zone near 0.020–0.021. The formation of small higher lows suggests weakening selling pressure and potential accumulation. Key Observations: • Price trying to hold above short-term consolidation range • RSI gradually rising from oversold territory, indicating momentum recovery • MACD flattening, signaling bearish momentum exhaustion • Buyers slowly regaining control after trend slowdown If price sustains above current levels and reclaims nearby EMA resistance, a short-term bullish continuation toward higher resistance zones becomes possible. Volume confirmation will be important to validate reversal strength. 📈 Full sent is coming? #DipAndEarnUp555%APR #TradeGoldandSilver #FarmMNTonAlpha #ByXLeaderboard #WednesdayAirdrop