HUSNAH2666
Crypto Learner | Web3 Enthusiast Sharing market insights, ideas & opportunities Building. Learning. Growing. 🚀 Let’s grow together on ByX.
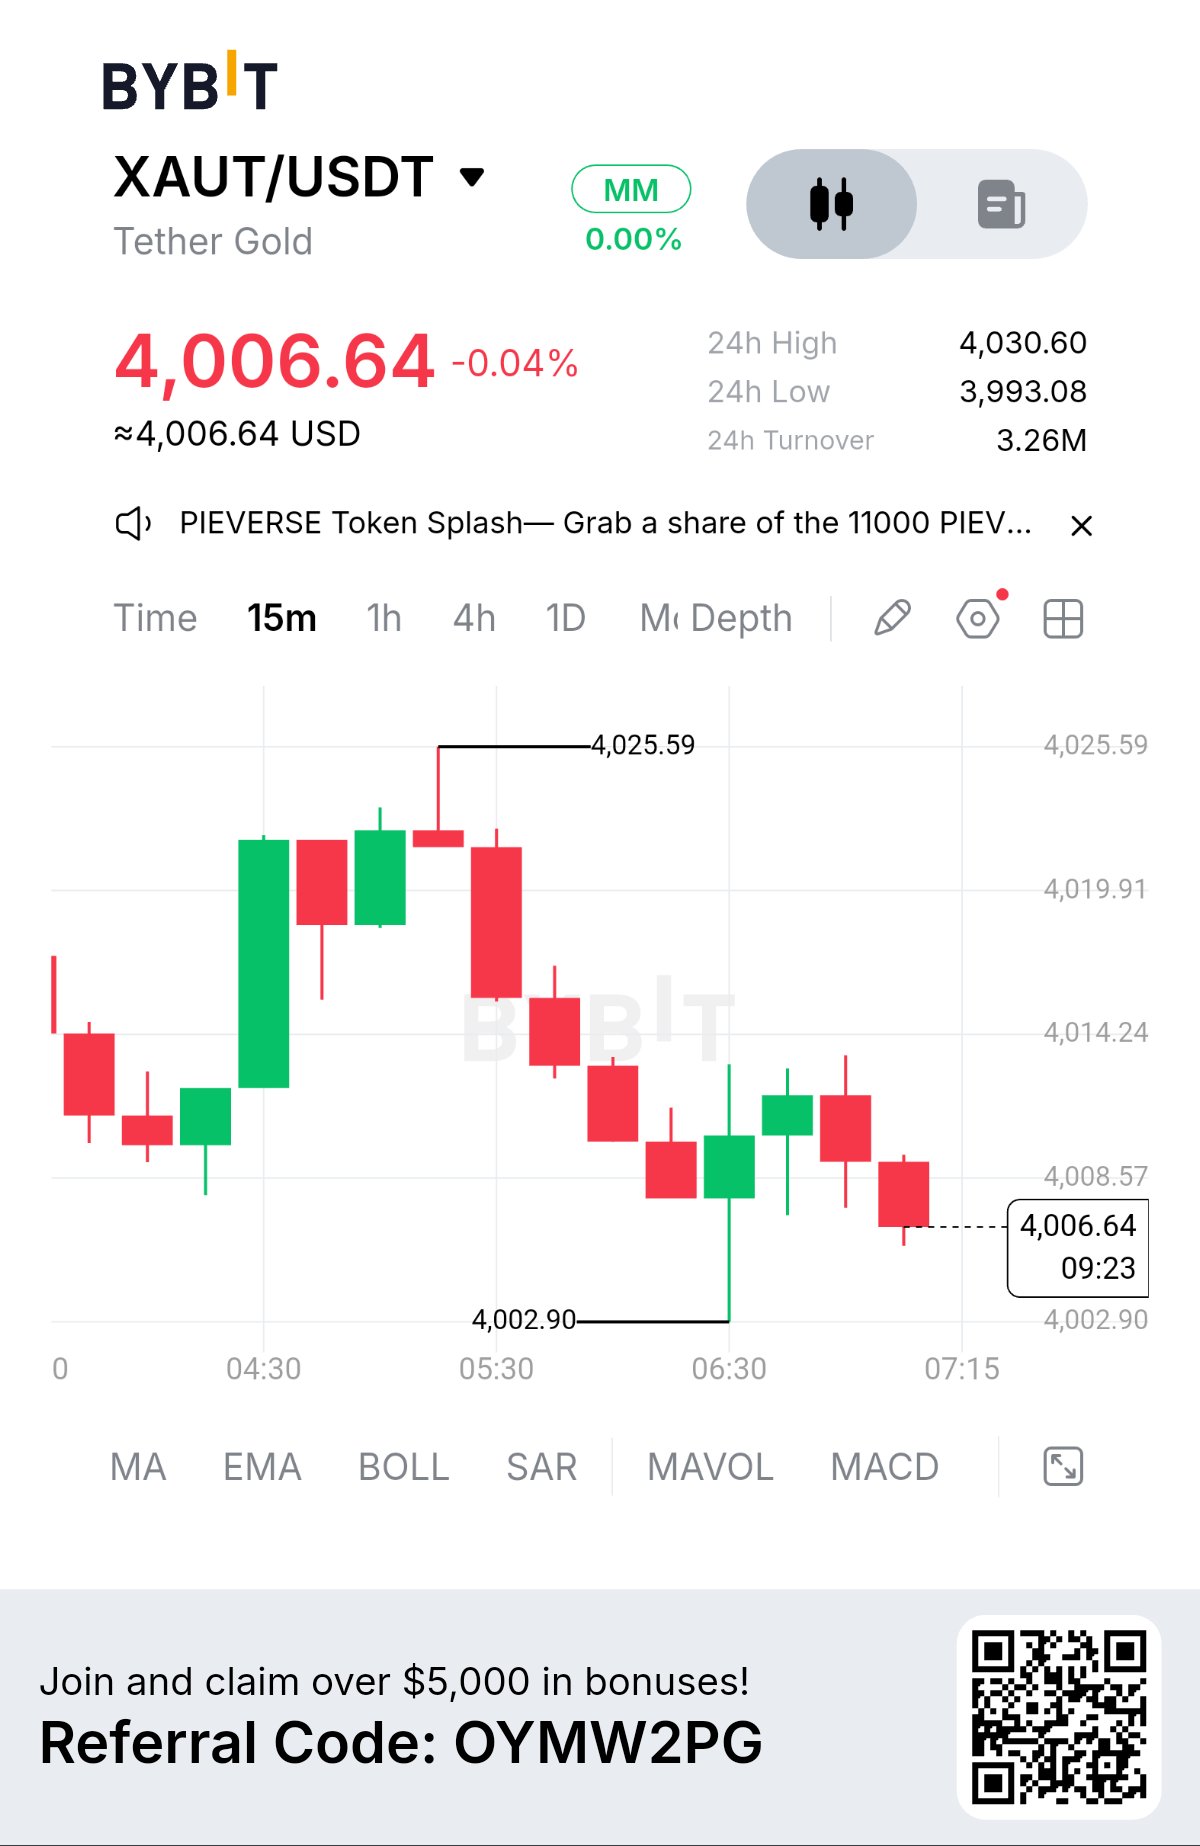
XAUT FACES REJECTION AT 4,025: WHAT COMES NEXT?
Market Snapshot • Price: 4,006.64 • 24H Change: -0.04% • 24H High: 4,030.60 • 24H Low: 3,993.08 • 24H Turnover: 3.26M Market Structure $XAUTUSDT is showing short-term weakness on the 15-minute chart after failing to hold its upward move. Price climbed from around 4,002.90 but faced strong rejection near 4,025.59. Since then, lower highs and lower lows have developed, suggesting that sellers currently have the advantage. However, price is approaching an important support zone where buyers may attempt to regain control. Key Levels • Resistance: 4,025.59 • Recovery Threshold: 4,014.24 • Immediate Support: 4,002.90 • Deeper Support: 3,993.08 Bullish Scenario If buyers regain momentum and push XAUT above 4,014.24 with a strong 15-minute close, price could move toward another test of 4,025.59. A confirmed break above resistance would provide stronger evidence of recovery. Bearish Scenario If price fails to recover and closes below 4,002.90, selling pressure could increase toward the 24-hour low of 3,993.08. A break of support would weaken the case for an immediate bullish recovery. Market Insight A strong rally followed by a steady pullback can indicate that buying momentum is fading. But a pullback does not automatically mean the next move must be downward. The important signals are whether buyers defend 4,002.90 and whether price can reclaim 4,014.24. Until one of these levels is convincingly broken, patience and confirmation remain essential. Discussion Is XAUT preparing for another recovery toward 4,025.59, or could a break below 4,002.90 bring further downside? #ByXIMPACT #MyByXTake $GRAMUSDT

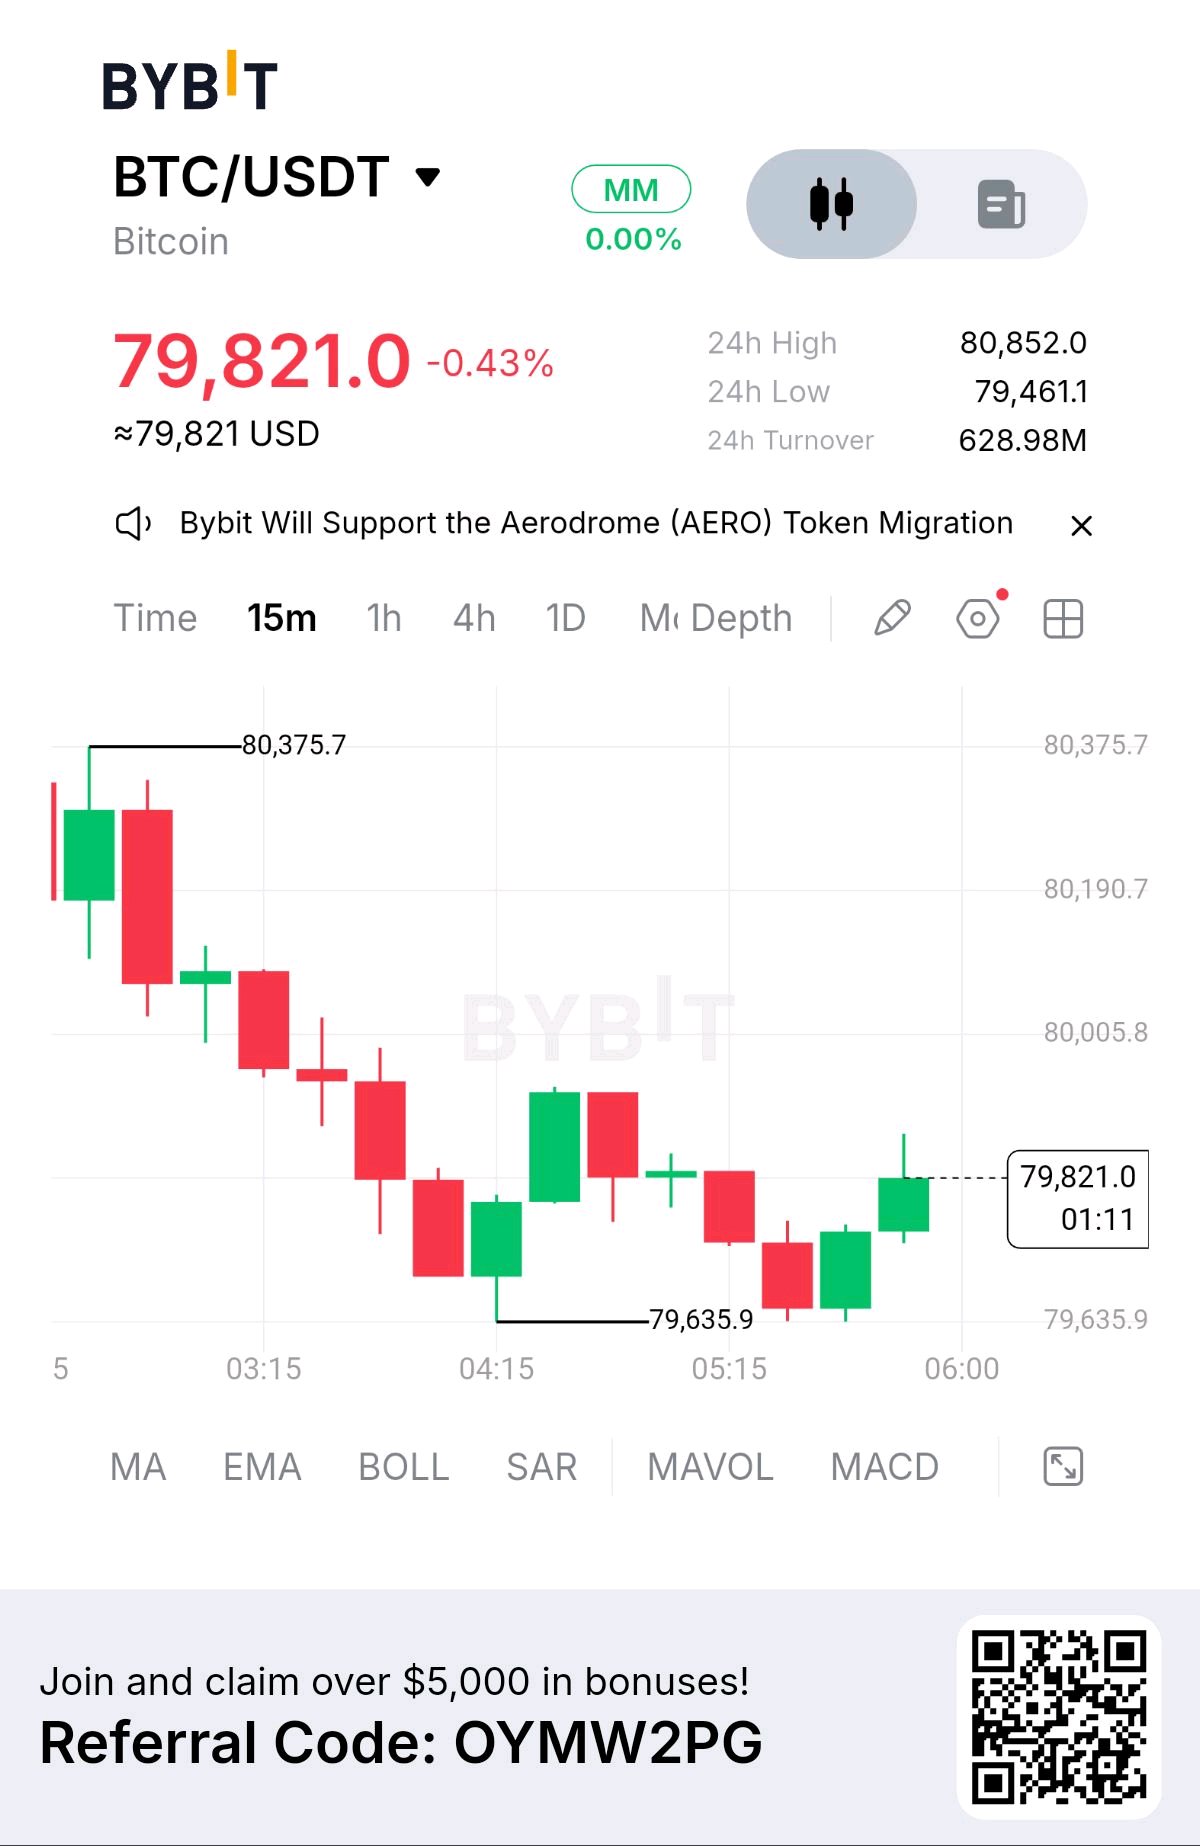
BTC HOLDS 79.6K: REVERSAL OR RELIEF BOUNCE?
Market Snapshot • BTC/USDT Price: 79,821.0 • 24H Change: -0.43% • 24H High: 80,852.0 • 24H Low: 79,461.1 • 24H Turnover: 628.98M Market Structure Bitcoin is attempting to stabilize after a sharp decline on the 15-minute timeframe. Price fell from the local high of 80,375.7, forming lower highs and lower lows before reaching 79,635.9. Since testing that level, selling pressure appears to have slowed, with smaller candles and a recent green candle pushing price back toward 79,821.0. However, a bounce alone does not confirm a reversal. BTC still needs to reclaim nearby resistance before the short-term structure can improve. Key Levels to Watch • Resistance: 80,005.8 • Local High: 80,375.7 • Immediate Support: 79,635.9 • 24H Support: 79,461.1 Bullish Scenario A strong 15-minute close above 80,005.8 could signal improving momentum and open the way for a retest of 80,375.7. Buyers need to defend the reclaimed level to strengthen the recovery. Bearish Scenario If BTC fails to break 80,005.8, sellers may push price back toward 79,635.9. A confirmed break below this support could expose the 24-hour low at 79,461.1. Market Insight The key signal is not simply the appearance of a green candle. It is whether BTC can break the most recent lower-high structure and hold above it. Until that happens, the current move remains a potential relief bounce rather than a confirmed reversal. The more disciplined approach is to wait for confirmation instead of reacting to the first sign of recovery. Discussion Will BTC reclaim 80,005.8 and build a short-term recovery, or will sellers push price below 79,635.9? #ByXIMPACT #IMPACTbyTrade $BTCUSDT $BTCUSDC

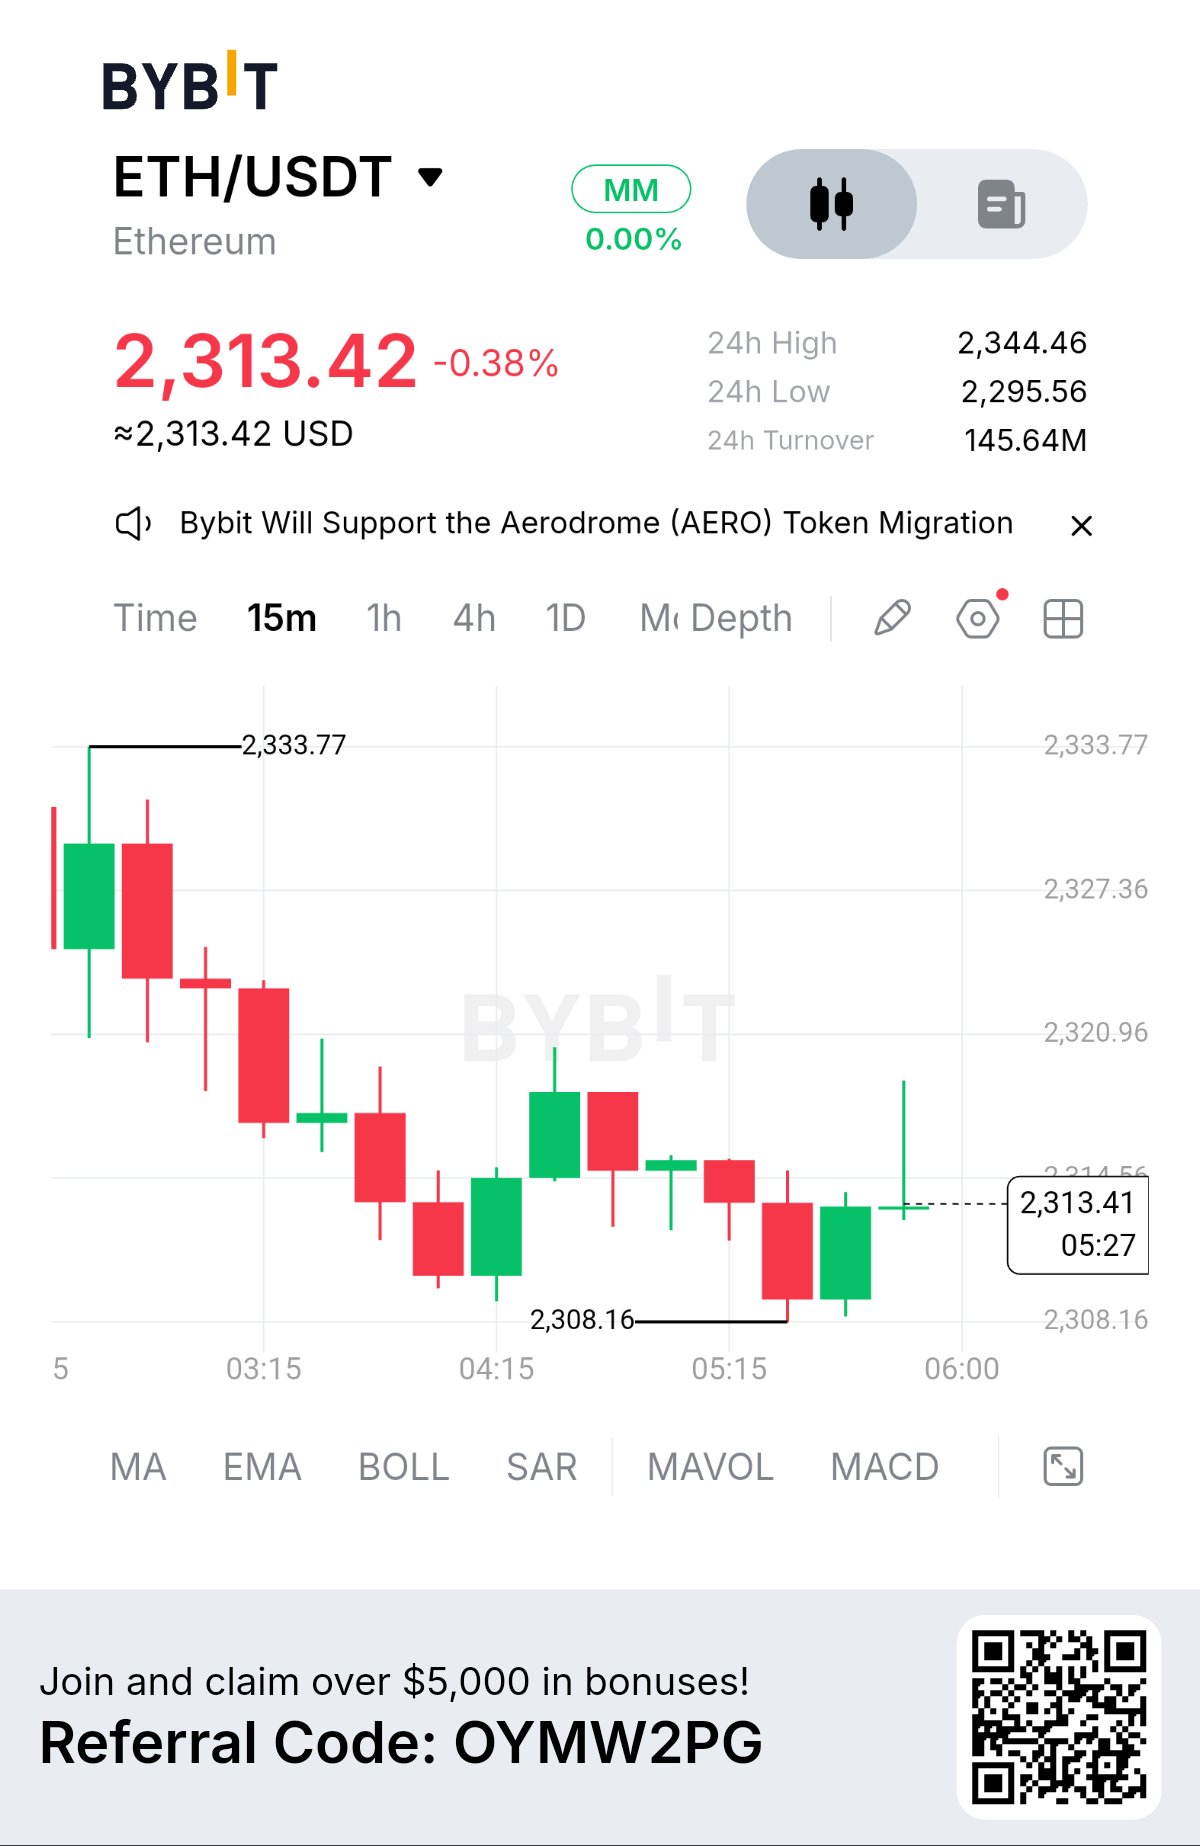
ETH Tests $2,308 Support as Selling Pressure Builds Market Insight: Will Buyers Defend This Level? Ethereum is trading at $2,313.42, down 0.38% over the last 24 hours. On the 15 minute chart, ETH has pulled back from the local high of $2,333.77 and is now consolidating near $2,308.16. The daily decline may appear modest, but the short term structure reveals persistent selling pressure. The critical question is whether buyers can defend the current support or whether ETH will extend its decline. Market Snapshot • Current price: $2,313.42 • 24 hour change: −0.38% • 24 hour high: $2,344.46 • 24 hour low: $2,295.56 • 24 hour turnover: $145.64M • Chart timeframe: 15 minutes What the Chart Reveals ETH has formed a sequence of lower highs and lower lows after reaching $2,333.77. This structure suggests that sellers have maintained short term control. Price is now hovering above $2,308.16, where the next reaction could become important. A pause near support does not confirm a reversal, but it gives buyers an opportunity to demonstrate whether demand is returning. Key Levels to Watch • Immediate support: $2,308.16 • Recovery threshold: $2,320.96 • Previous local high: $2,333.77 • Deeper support: $2,295.56 Two Scenarios That Matter Bullish Recovery If ETH holds $2,308.16 and produces a convincing 15 minute close above $2,320.96, the short term structure could begin to improve. Sustained buying pressure could then bring the $2,333 area back into focus. Bearish Continuation A confirmed 15 minute close below $2,308.16 would weaken the current support structure. If selling continues, the $2,295.56 daily low becomes the next important level to monitor. Neither scenario is guaranteed. Confirmation from subsequent price action remains essential. Risk and Confirmation Trying to predict the exact bottom while price continues to form lower highs can be risky. A stronger recovery signal would involve buyers reclaiming resistance and holding the recovered level. Likewise, a brief wick below support is not the same as a sustained breakdown. Candle closes and follow through matter. The Deeper Insight ETH is showing why a small daily percentage change can hide a meaningful shift in short term market structure. The next move around $2,308.16 could reveal whether sellers still have the advantage or buyers are beginning to absorb the pressure. Discussion Question Will ETH defend $2,308.16 and reclaim $2,320.96, or will sellers push price toward $2,295.56? Which signal would carry more weight for you: a confirmed recovery above resistance or a sustained break below support? #ByXIMPACT #IMPACTbyTrade $ETHUSDT $ETHUSDC
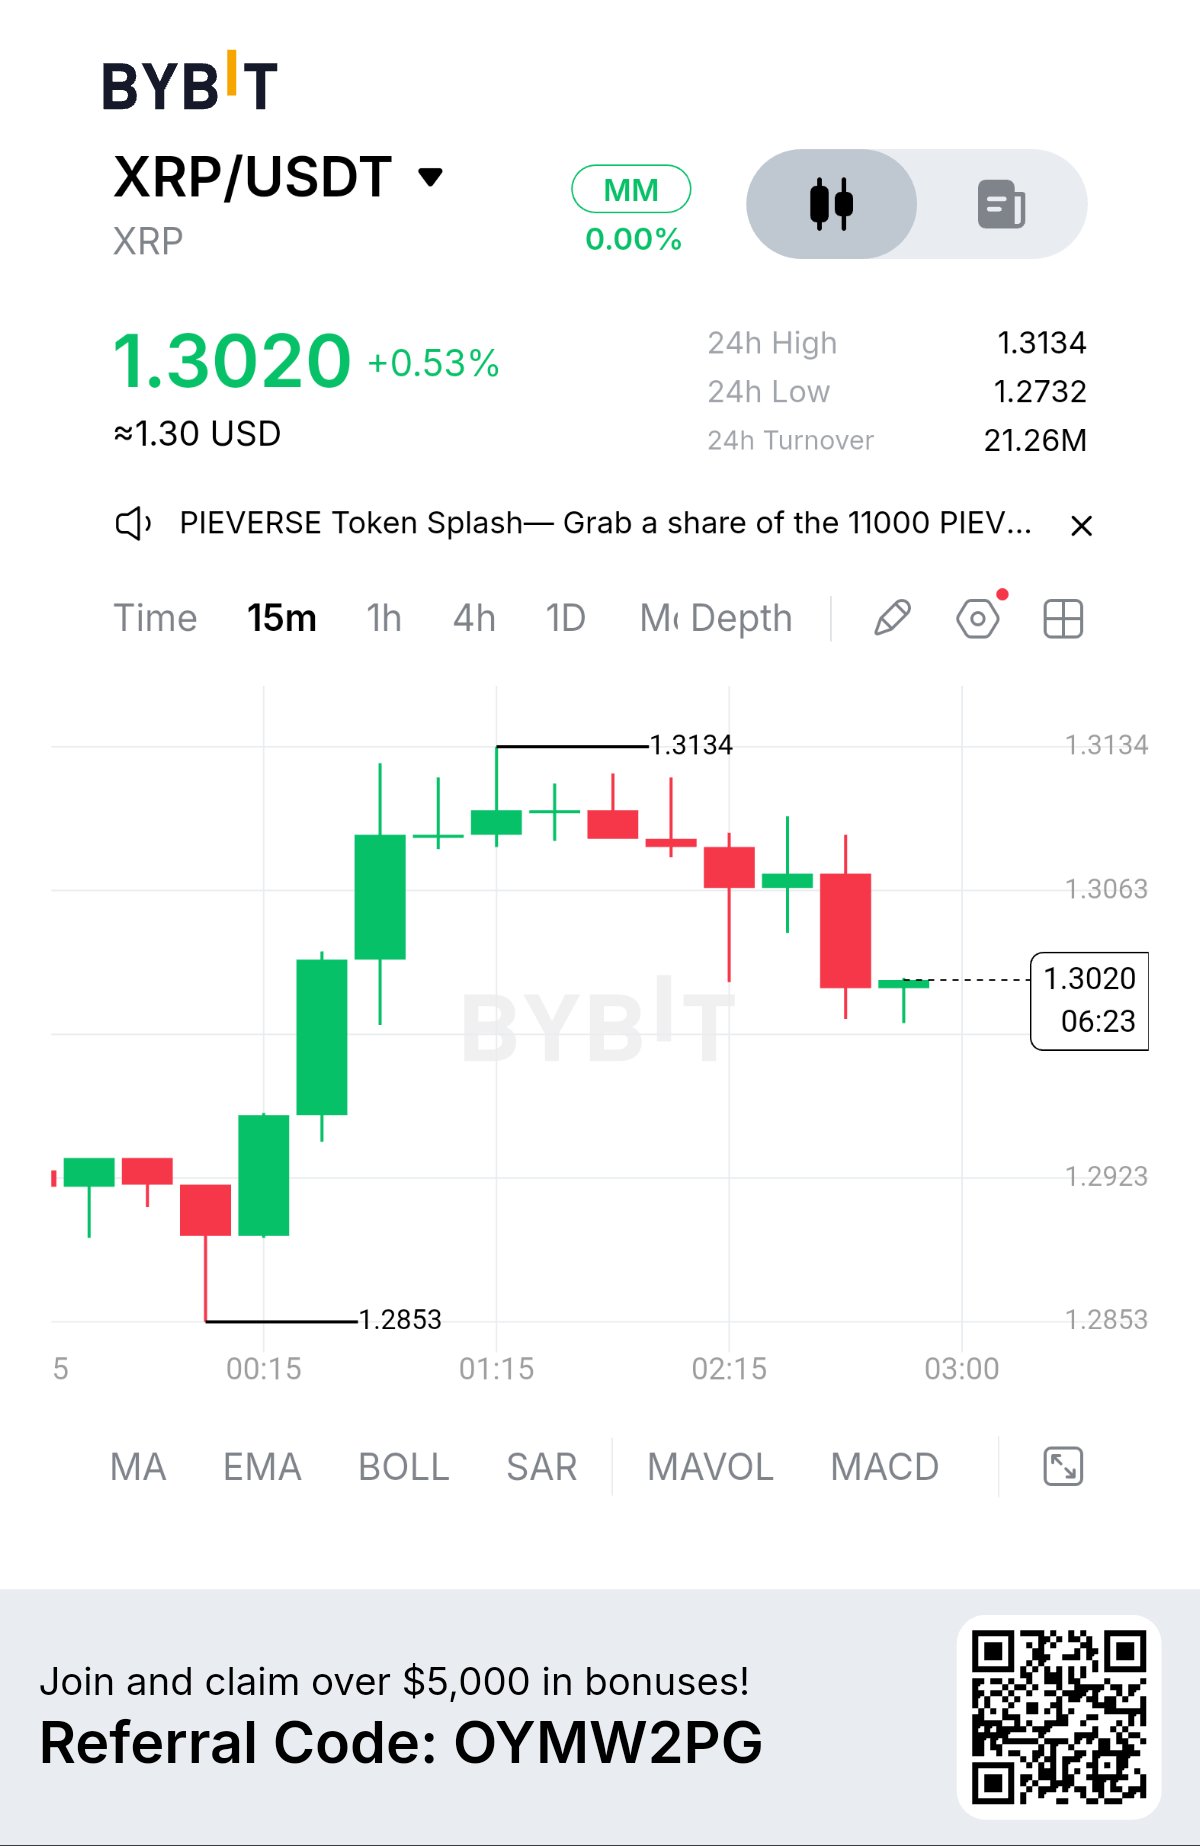
XRP FACES A CRITICAL TEST NEAR $1.30 SUPPORT
Market Insight: Can Buyers Recover Control? $XRPUSDT is trading at $1.3020, up 0.53% over the last 24 hours. Despite the positive daily performance, the 15 minute chart reveals a short term pullback after price reached $1.3134 and failed to sustain the upward move. The rally showed strong buying interest, but the latest decline raises an important question: are buyers preparing for another attempt higher, or is selling pressure building? Market Snapshot • Current price: $1.3020 • 24 hour change: +0.53% • 24 hour high: $1.3134 • 24 hour low: $1.2732 • 24 hour turnover: 21.26M • Chart timeframe: 15 minutes What the Chart Reveals XRP advanced from the $1.2853 area before encountering resistance at $1.3134. The subsequent pullback suggests that short term bullish momentum has weakened. The price is now testing the $1.30 region. Although the decline indicates selling pressure, it does not yet confirm a complete bearish reversal. The next important signal is whether XRP can stabilize above support and begin forming a stronger recovery structure. Key Levels to Watch • Immediate recovery level: $1.3063 • Major resistance: $1.3134 • Critical support: $1.2923 • Structural support: $1.2853 Two Scenarios That Matter Bullish Recovery A convincing 15 minute close above $1.3063 could indicate that buyers are regaining momentum. If the recovery continues, XRP may retest $1.3134. A sustained break above that level would provide stronger evidence of renewed upward momentum. Bearish Continuation A confirmed close below $1.2923 would weaken the current support structure and increase the possibility of a retest of $1.2853. If that lower level also fails, the market may need to search for support at lower prices. Further downside is possible, but it is not guaranteed. Risk and Confirmation Buying simply because XRP has pulled back from its high can be risky. The more useful signal is how price behaves around support and whether buyers can reclaim nearby resistance. A recovery above $1.3063 would strengthen the short term bullish case, while a sustained break below $1.2923 would weaken it. The Deeper Insight A positive 24 hour return does not always mean the market is bullish across every timeframe. XRP has demonstrated buying strength during its rally, but the current pullback is testing whether that demand can withstand renewed selling pressure. The reaction around $1.2923 may reveal more about the market's next direction than the daily percentage alone. Will XRP defend $1.2923 and recover toward $1.3134, or will sellers extend the pullback? Which signal matters more to you: a confirmed reclaim of $1.3063 or a sustained break below support? #ByXIMPACT $NEARUSDT
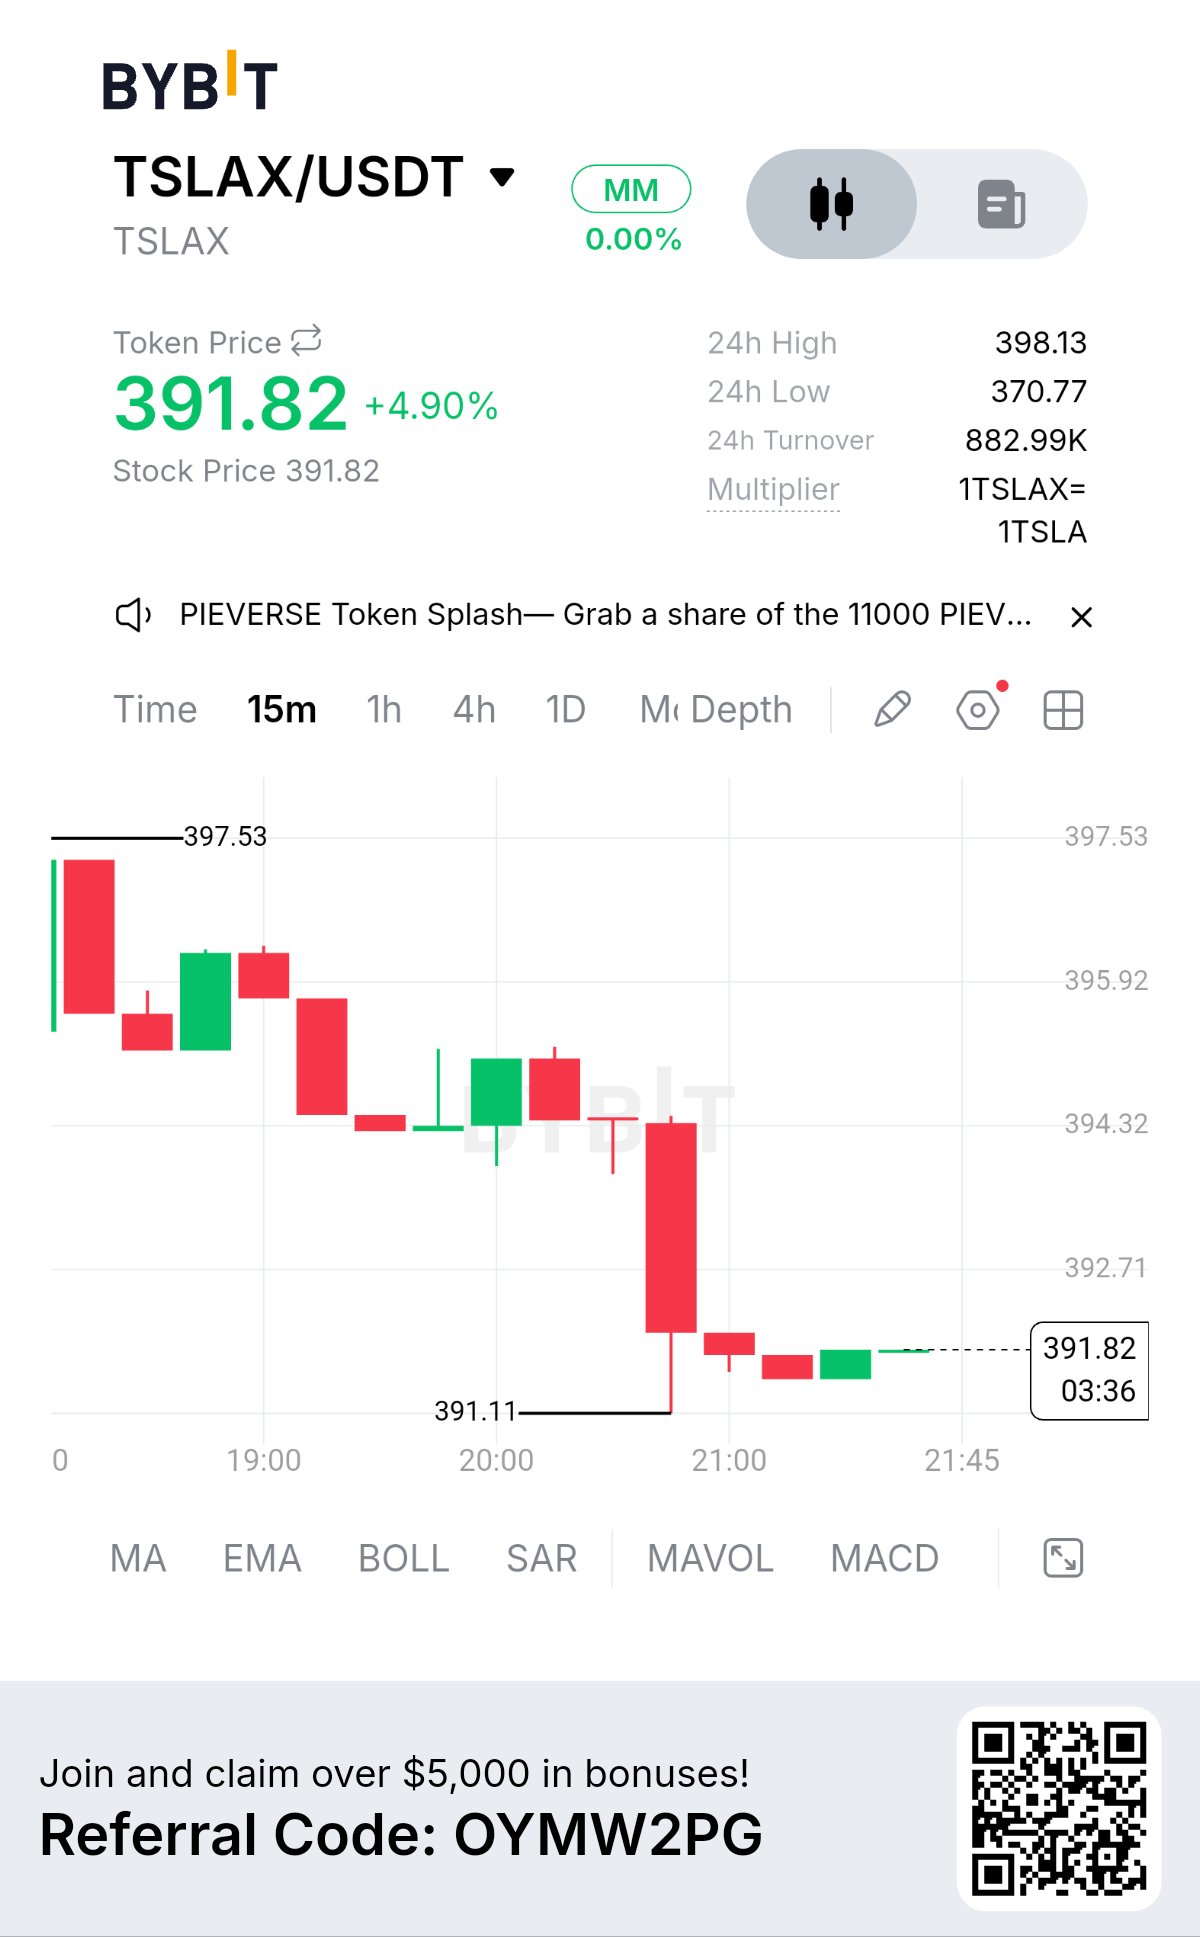
TSLAX FACES A CRITICAL TEST AFTER SUDDEN SELL OFF
Market Insight: Can Buyers Defend $391.11? $TSLAXUSDT is trading at $391.82, up 4.90% over the last 24 hours. However, the 15 minute chart reveals a sharp change in short term momentum after a sudden sell off pushed price down to $391.11. The daily performance remains positive, but the latest price action raises an important question: is this a temporary shakeout before recovery, or the beginning of another downward move? Market Snapshot • Current price: $391.82 • 24 hour change: +4.90% • 24 hour high: $398.13 • 24 hour low: $370.77 • 24 hour turnover: 882.99K • Chart timeframe: 15 minutes What the Chart Reveals The sharp red candle signals a sudden downward move that disrupted the previous price structure. After the drop, smaller candles appeared near the low, suggesting that the market has paused. However, a pause in selling does not automatically mean buyers have regained control. The next confirmed move around $391.11 could provide a clearer signal. Key Levels to Watch • Immediate support: $391.11 • Short term recovery level: $392.71 • Breakdown resistance: $394.32 • 24 hour low: $370.77 Two Scenarios That Matter Bullish Recovery If TSLAX holds above $391.11 and closes a 15 minute candle above $392.71, it could signal an initial recovery attempt. Reclaiming $394.32 would provide stronger evidence that buyers are recovering control. Bearish Continuation A confirmed 15 minute close below $391.11 would weaken the current support structure. Further selling could follow, although the distance and path toward the $370.77 daily low remain uncertain. Risk and Confirmation After a sudden price drop, entering immediately can expose traders to further volatility. Waiting for a confirmed reversal or a clear break of nearby levels may provide better evidence than reacting to a single candle. A sustained reclaim of $394.32 would weaken the immediate bearish setup, while a confirmed break below $391.11 would weaken the recovery case. The Deeper Insight A strong daily gain can coexist with serious short term weakness. TSLAX is a reminder that percentage performance alone does not reveal the full market structure. The important question is not simply how far price has fallen, but whether buyers can establish support after the decline. Discussion Question Will TSLAX reclaim $394.32 and begin a recovery, or will sellers break $391.11 and extend the decline? Which signal would you trust more: a confirmed recovery above resistance or a sustained breakdown below support? #ByXIMPACT $XRPUSDT
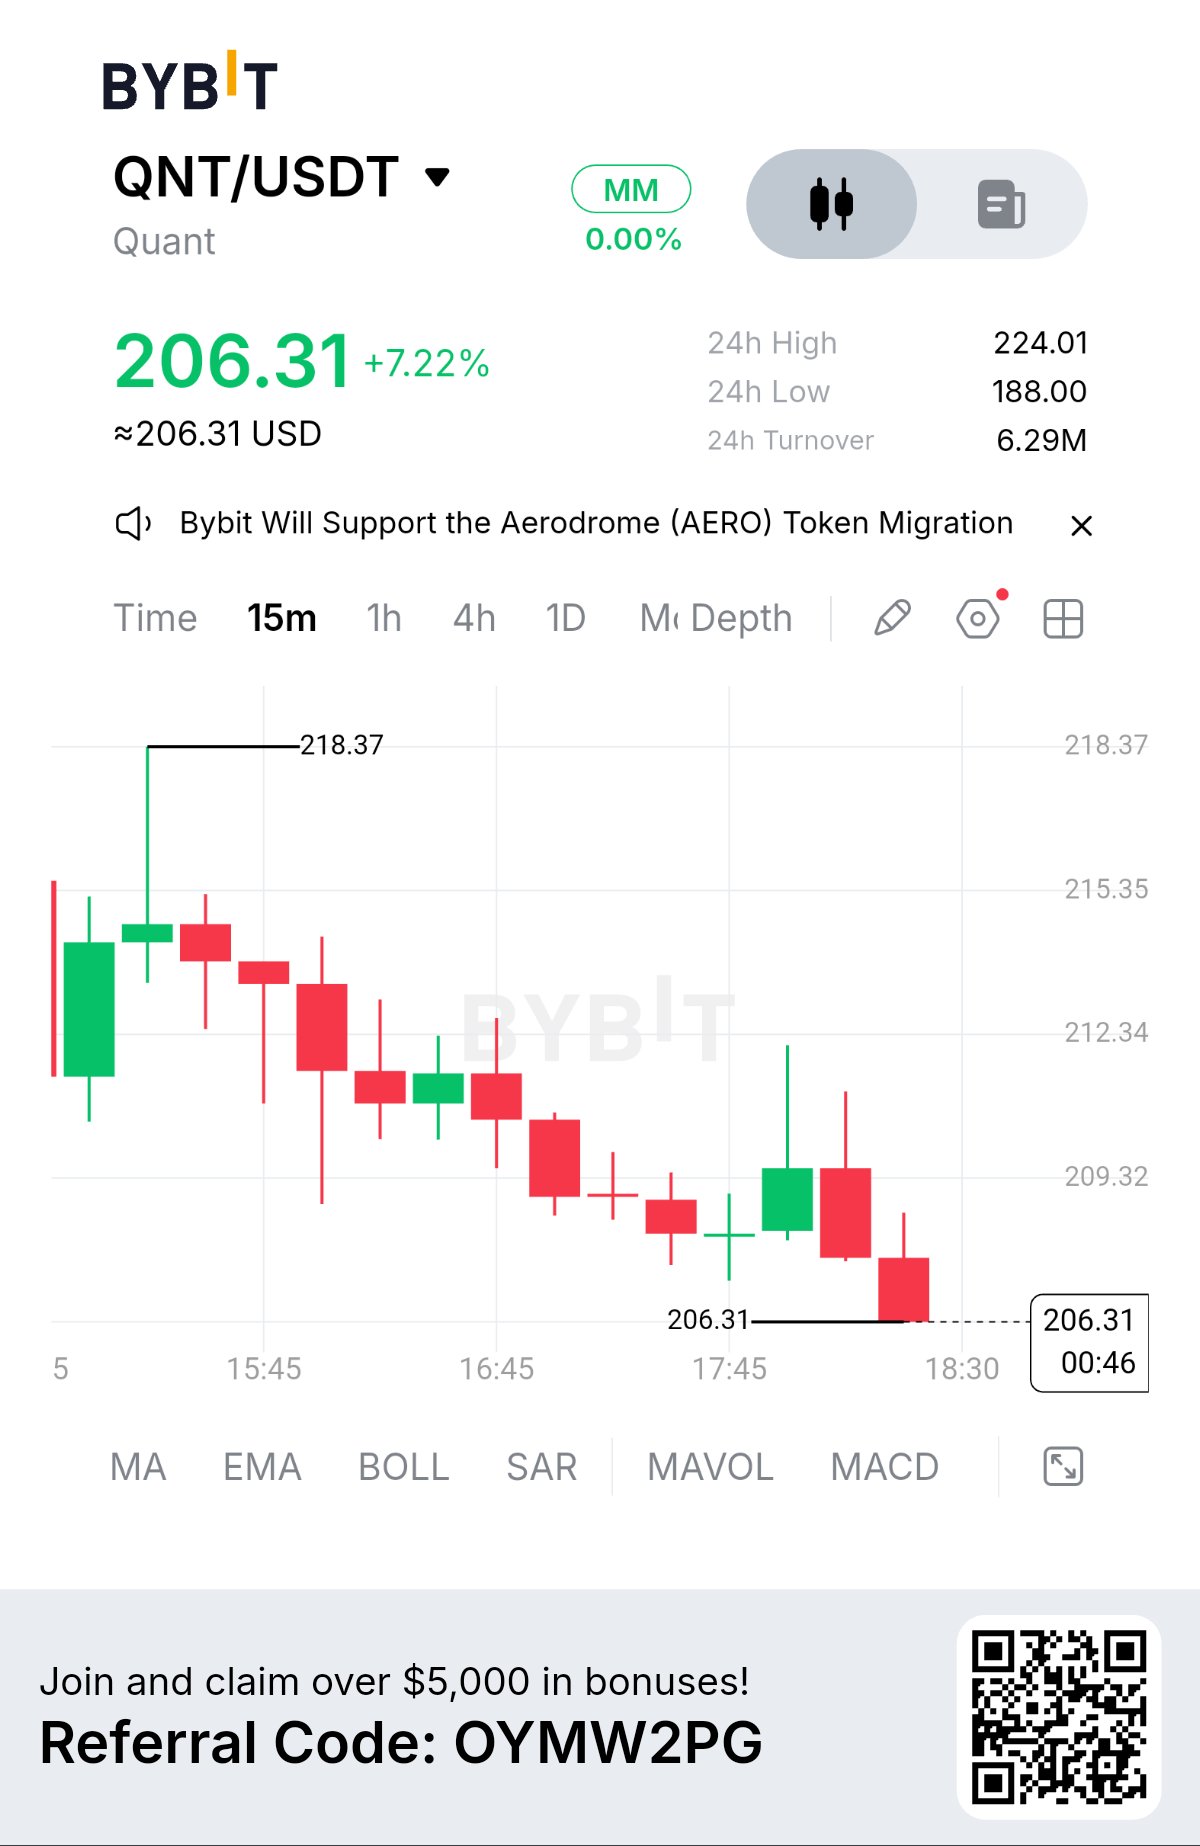
QNT FACES A CRITICAL TEST at $206 SUPPORT
Market Insight: Daily Strength Meets Intraday Pressure $QNTUSDT is trading at $206.31, up 7.22% over the last 24 hours. Yet beneath this strong daily gain, the 15 minute chart reveals a significant shift in short term momentum. After reaching a chart high of $218.37, sellers pushed price lower through a series of declining candles. QNT is now testing the $206.31 area, making this a critical moment for buyers and sellers alike. Market Snapshot • Current price: $206.31 • 24 hour change: +7.22% • 24 hour high: $224.01 • 24 hour low: $188.00 • 24 hour turnover: 6.29M • Chart timeframe: 15 minutes What the Chart Reveals The recent price structure shows lower highs and persistent selling pressure following the move toward $218.37. This suggests that short term buyers have lost some control of the market. However, a strong daily gain alongside an intraday pullback does not automatically confirm a complete trend reversal. It may reflect profit taking, changing sentiment or a temporary correction. The key question is whether buyers can defend support and establish a meaningful recovery. Key Levels to Watch • Immediate support: $206.31 • Recovery confirmation: $209.32 • Key resistance: $212.34 • Psychological level: $200.00 • 24 hour low: $188.00 Two Scenarios That Matter Bullish Recovery If QNT holds above $206.31 and produces a convincing 15 minute close above $209.32, a recovery toward $212.34 becomes a possibility. Buyers would need to sustain that move to demonstrate improving momentum. Bearish Continuation A confirmed close below $206.31 would weaken the immediate support structure. If selling pressure continues, $200.00 becomes an important psychological level to monitor, followed by the $188.00 daily low if weakness deepens. Neither scenario is guaranteed. Price confirmation is essential. Risk and Confirmation The current setup calls for patience. Entering solely because QNT appears cheaper after a decline can be risky while the short term structure remains weak. A stronger bullish case requires support to hold and price to reclaim nearby resistance. A sustained break below support would weaken that recovery thesis. The Deeper Insight QNT highlights an important market principle: a strong 24 hour gain can hide significant short term selling pressure. The daily percentage tells only part of the story. The reaction around $206.31 may reveal whether buyers are ready to defend the market or sellers still control the immediate trend. Discussion Question Will QNT defend $206.31 and recover toward $212.34, or will sellers push price toward the $200 level? Which confirmation would matter more to you: a strong reclaim of $209.32 or a sustained break below support? #ByXIMPACT
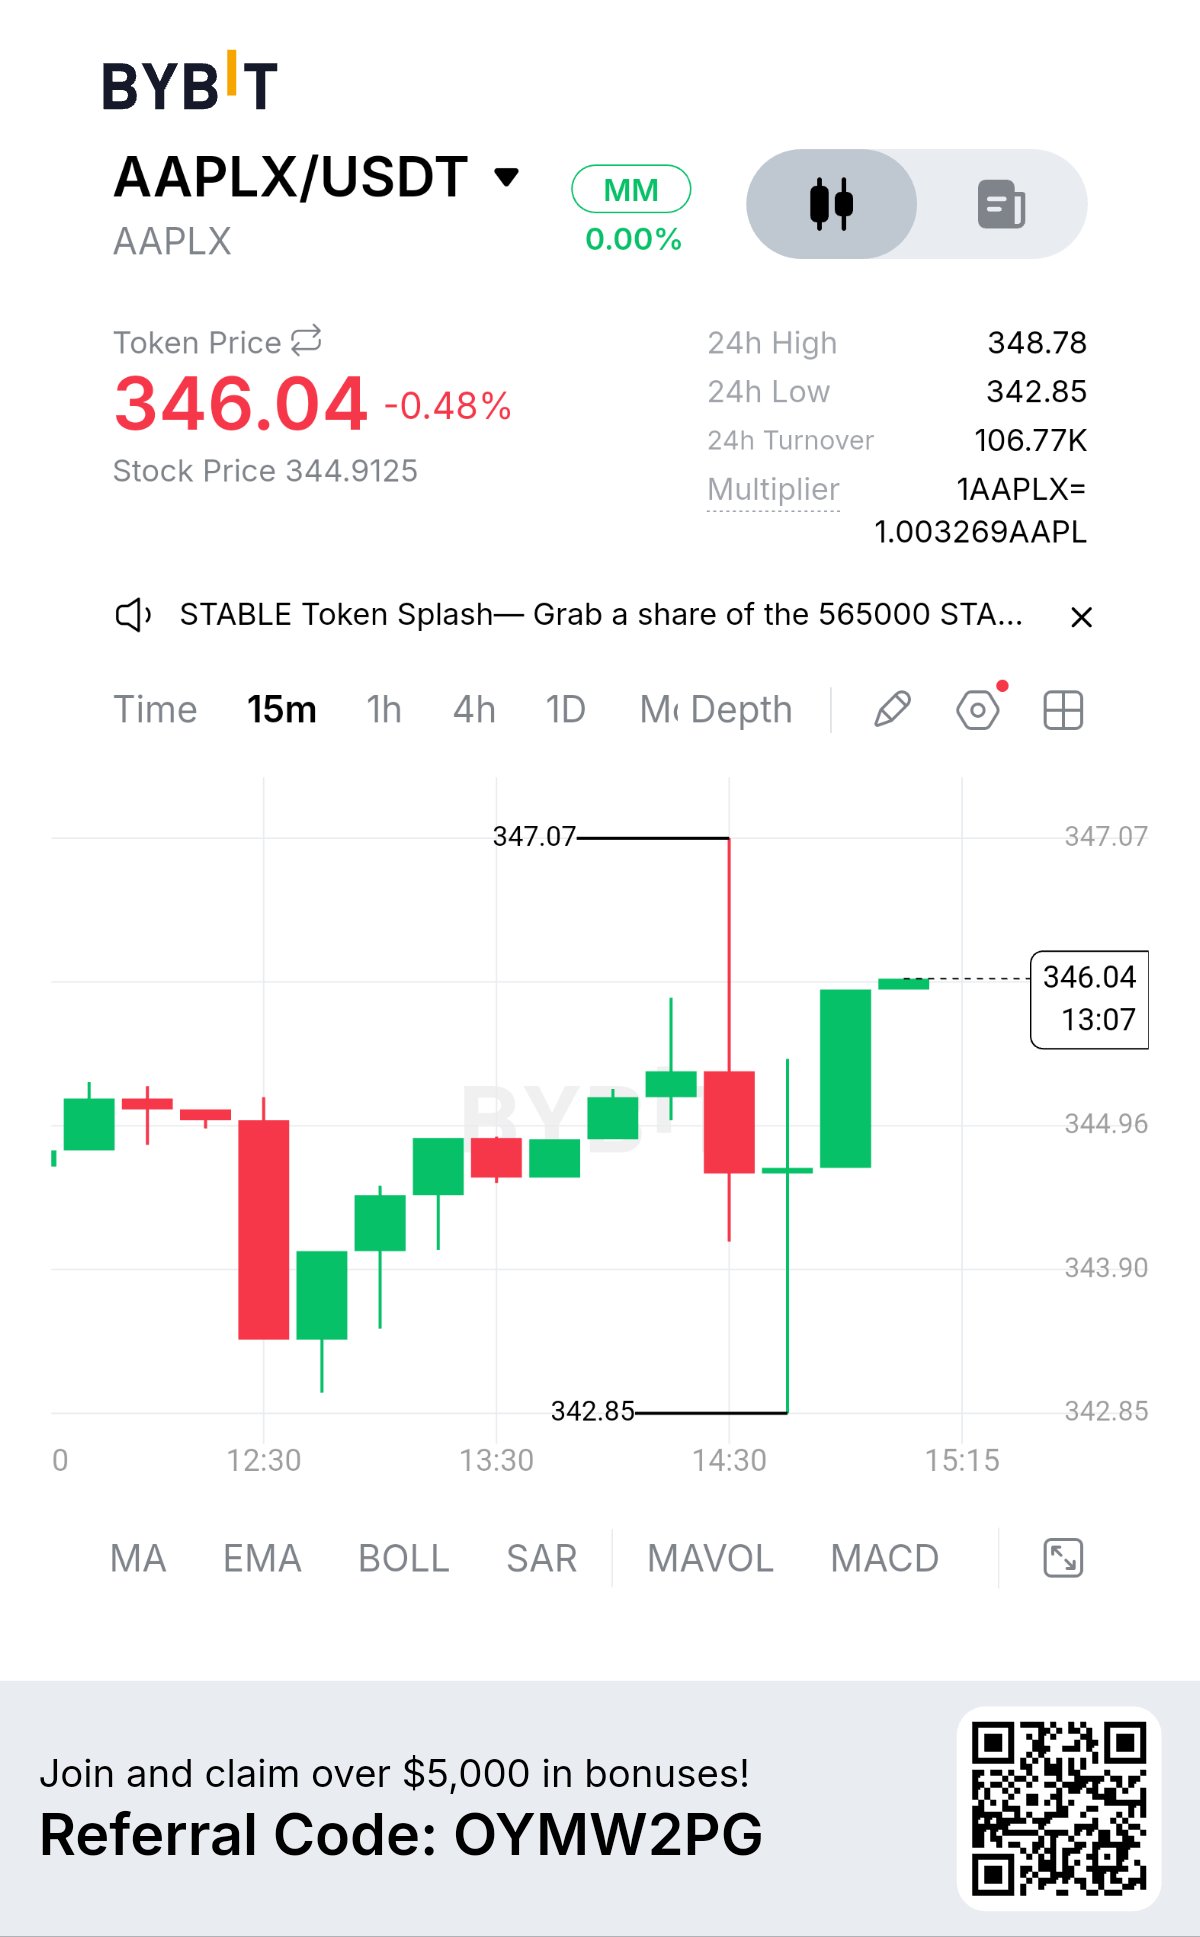
AAPLX REBOUNDS: CAN BUYERS BREAK $347
Market Insight: Recovery Meets a Critical Test $AAPLXUSDT is trading at $345.96, down 0.51% over the last 24 hours. On the 15 minute chart, price has recovered from $342.85 and climbed back toward $346.00. The rebound shows renewed buying interest, but the market has not yet cleared the recent high of $347.07. The next move could determine whether this recovery develops into a stronger upward push or fades under selling pressure. Market Snapshot • Current token price: $345.96 • 24 hour change: −0.51% • 24 hour high: $348.78 • 24 hour low: $342.85 • 24 hour turnover: $106.79K • Chart timeframe: 15 minutes • Reference stock price shown: $344.8327 What the Chart Reveals AAPLX experienced a sharp decline toward $342.85 before buyers stepped in. Subsequent candles show a recovery, culminating in a strong green candle returning price to $345.96. However, the earlier rejection near $347.07 remains important. One strong candle can signal renewed demand, but it does not independently confirm a sustained breakout. Key Levels to Watch • Immediate resistance: $347.07 • Near term reaction zone: $345.00 to $346.00 • Major visible support: $342.85 • 24 hour high: $348.78 Two Scenarios That Matter Bullish Continuation A sustained move above $347.07 would strengthen the recovery. If buyers maintain momentum, the $348.78 24 hour high becomes the next important level to watch. Bearish Rejection If price fails to hold the recovery and falls back below the $345 area, short term momentum could weaken. A renewed decline would put the $342.85 low back in focus. The Deeper Insight The important signal is the contrast between the sharp rejection and the subsequent recovery. Buyers have managed to bring price back toward $346, but the real test is whether they can overcome resistance without immediately losing momentum. The next confirmed candle close matters more than the size of a single green candle. Discussion Question Can AAPLX break above $347.07 and challenge $348.78, or will sellers force another retest of $342.85? Which price level would give you the strongest confirmation of the next move? #IMPACTbyTrade #ByXIMPACT #WSOT2026$WLDUSDT
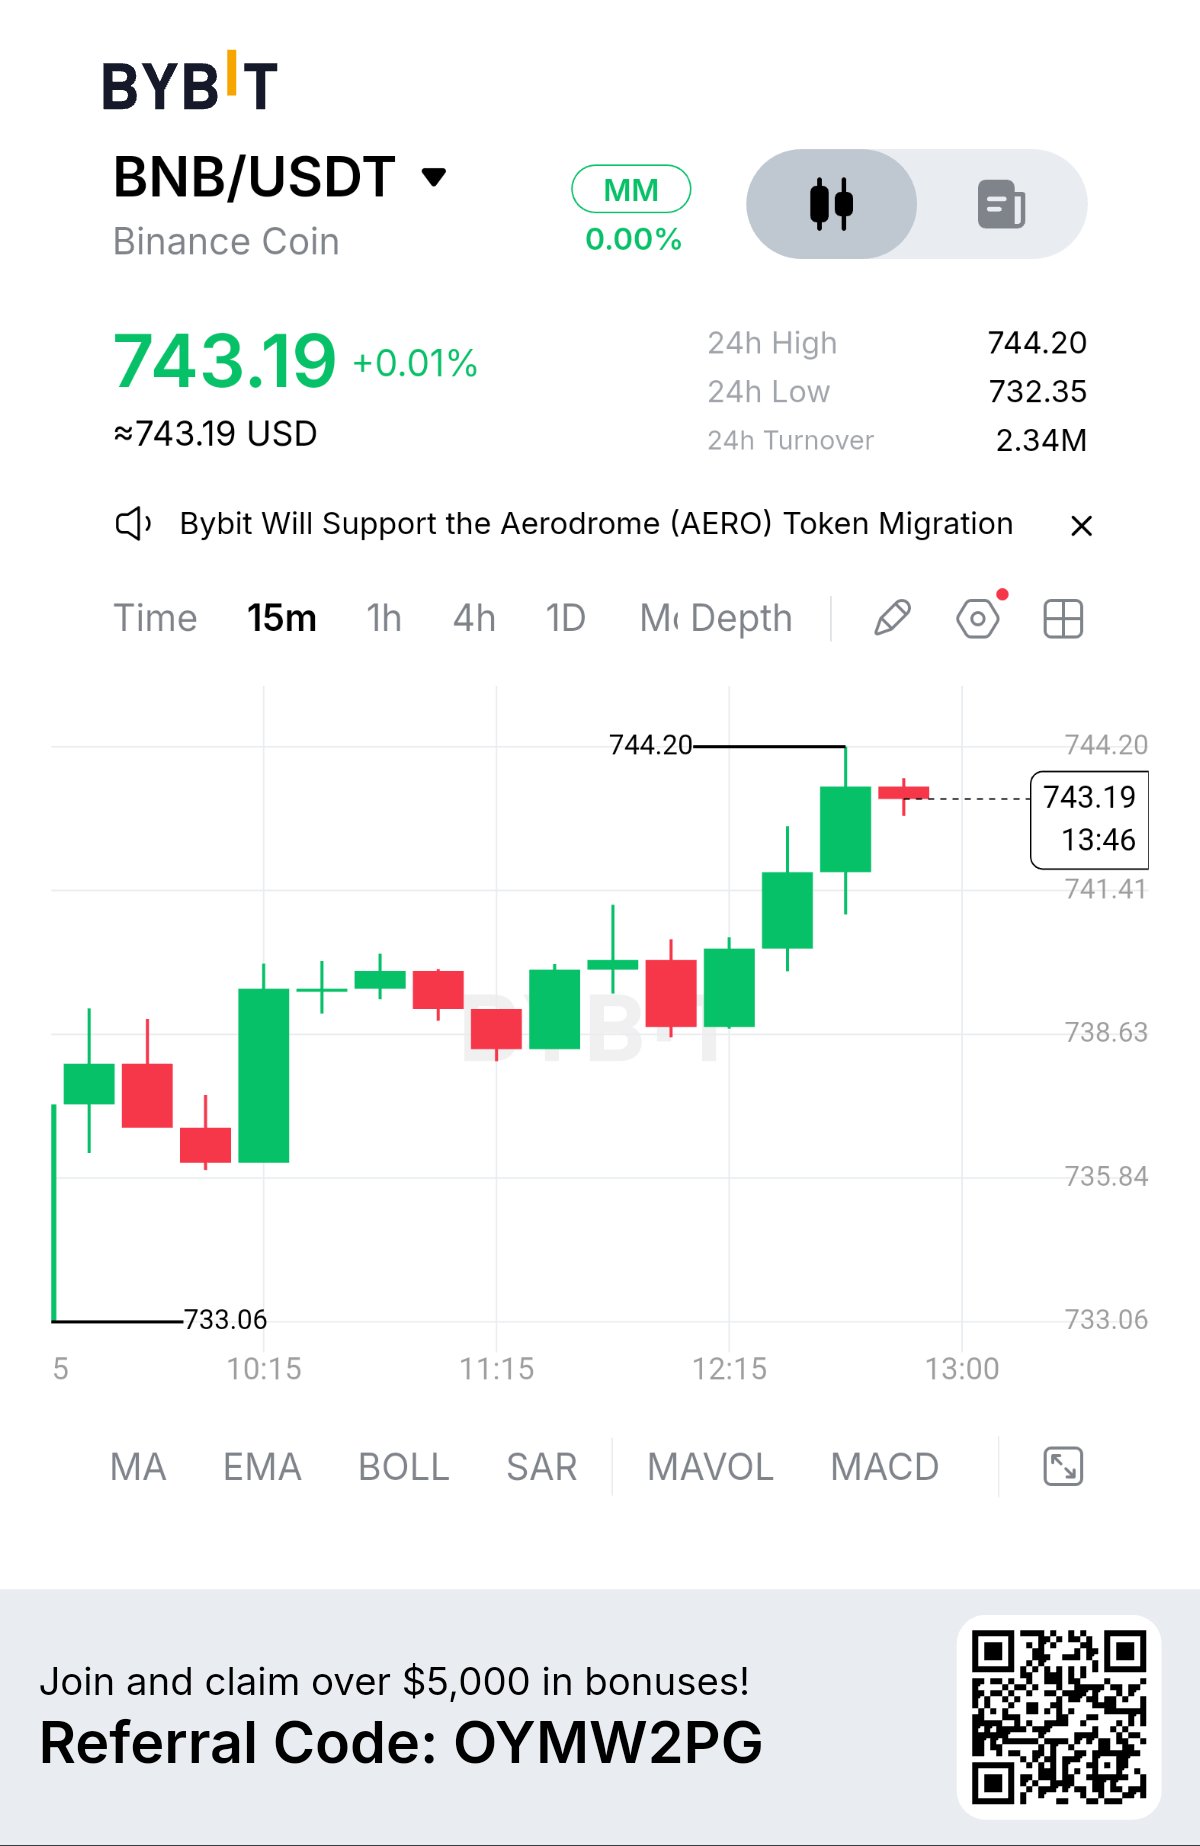
BNB TESTS $744 RESISTANCE: BREAKOUT OR REJECTION?
Market Insight: Buyers Face a Critical Decision $BNBUSDT is trading at $743.19, with a modest 24 hour gain of 0.01%. On the 15 minute chart, buyers have pushed price upward toward the $744.20 high after recovering from the $733.06 area. The uptrend is clear in the recent candle structure. However, reaching resistance is not the same as breaking through it. The next move will determine whether buyers can extend the rally or sellers will force a pullback. Market Snapshot • Current price: $743.19 • 24 hour change: +0.01% • 24 hour high: $744.20 • 24 hour low: $732.35 • 24 hour turnover: 2.34M • Timeframe: 15 minutes What the Chart Reveals BNB has formed a sequence of higher highs and higher lows, showing that buyers have maintained short term control during the recovery. Price is now testing $744.20, a level where selling pressure could increase. The recent pause near the high suggests hesitation, but it does not confirm a reversal. The important signal is whether buyers can turn resistance into support. Key Levels to Watch • Immediate resistance: $744.20 • Near term support: $741.41 • Potential retest zone: $738.00 • Structural support: $733.06 Two Scenarios That Matter Bullish Continuation A strong 15 minute candle close above $744.20 would provide initial breakout confirmation. If price then holds above this level, the bullish structure would gain further support. Bearish Rejection If BNB fails to break resistance and falls below $741.41, short term momentum could weaken. A continued decline may bring $738.00 into focus, with $733.06 remaining an important structural reference. Risk and Confirmation The current setup calls for patience rather than assuming a breakout before it happens. A brief wick above resistance is not enough to establish a sustained move. Candle closes and the market's reaction after the breakout matter more. The bullish scenario would weaken if price loses $741.41, while a sustained move above $744.20 would strengthen the case for continuation. The Deeper Insight Strong trends are tested at resistance. BNB has shown buying strength on the way up, but the real test is whether buyers can absorb selling pressure at the 24 hour high. Confirmation matters more than anticipation. Discussion Question Will BNB secure a confirmed break above $744.20, or will sellers push price back toward $741.41 before the next move? What evidence would you need to see before trusting the breakout? #IMPACTbyTrade #WSOT2026 #MyByXTake $BONKUSDT
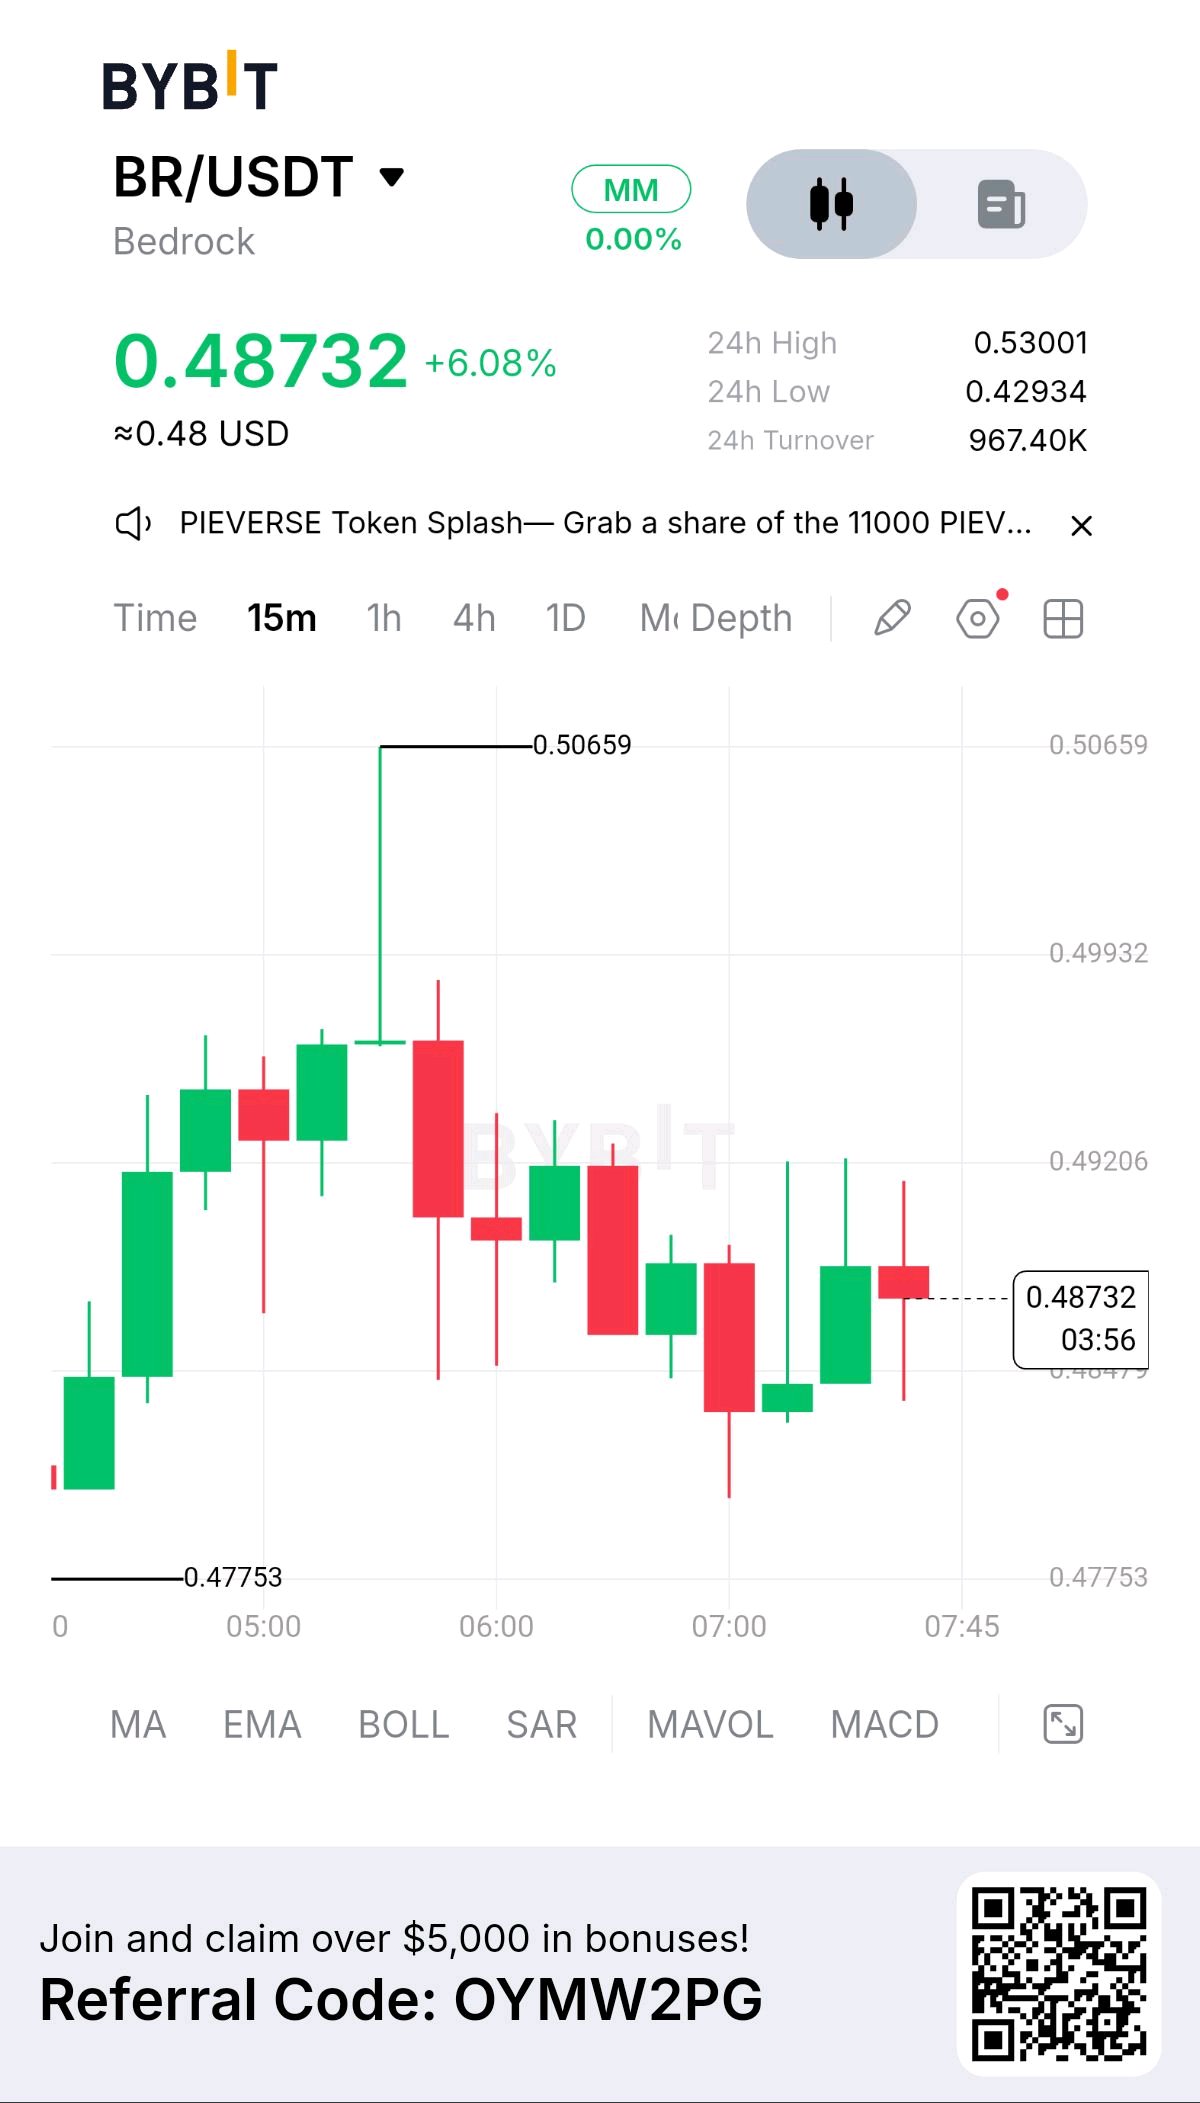
BR STRUGGLES TO RECLAIM THE $0.492 RESISTANCE
Market Insight: Recovery Faces Selling Pressure $BRUSDT Bedrock (BR/USDT) is trading at $0.48732, up 6.08% over the last 24 hours. However, the 15 minute chart reveals a more complex picture: after reaching $0.50659, price pulled back and is now struggling to regain its previous momentum. The daily gain remains positive, but the short term structure shows that buyers still need to prove their strength. Market Snapshot • Current price: $0.48732 • 24 hour change: +6.08% • 24 hour high: $0.53001 • 24 hour low: $0.42934 • 24 hour turnover: $967.40K • Chart timeframe: 15 minutes What the Chart Reveals BR experienced a strong upward move before facing rejection near $0.50659. Subsequent candles formed lower highs and moved back toward the $0.484 area. A recent rebound toward $0.49206 suggests buyers are attempting to regain control, but the latest candle shows renewed hesitation. The key question is whether this recovery can develop into sustained upward momentum or remain a temporary bounce. Key Levels to Watch • Immediate resistance: $0.49206 • Higher resistance: $0.49932 • Major visible resistance: $0.50659 • Near term support: $0.48470 area • Lower support: $0.47753 Two Scenarios That Matter Bullish Recovery A sustained move above $0.49206 could strengthen the recovery and bring $0.49932 into focus. A break above $0.50659 would provide stronger evidence of renewed upward momentum. Bearish Continuation If BR fails to reclaim $0.49206 and loses the $0.48470 area, selling pressure could increase toward $0.47753. These are conditional scenarios, not guaranteed price targets. The Deeper Insight A token can remain strongly positive over 24 hours while showing weakness on a shorter timeframe. BR is a clear example of why daily performance alone does not tell the full market story. The next confirmed move around resistance may reveal whether buyers are ready to resume control. Discussion Question Can BR reclaim $0.49206 and build another upward move, or will sellers push it back toward $0.47753? What confirmation would you look for before choosing a direction? #ByXIMPACT #MyByXTake $BTCUSDT

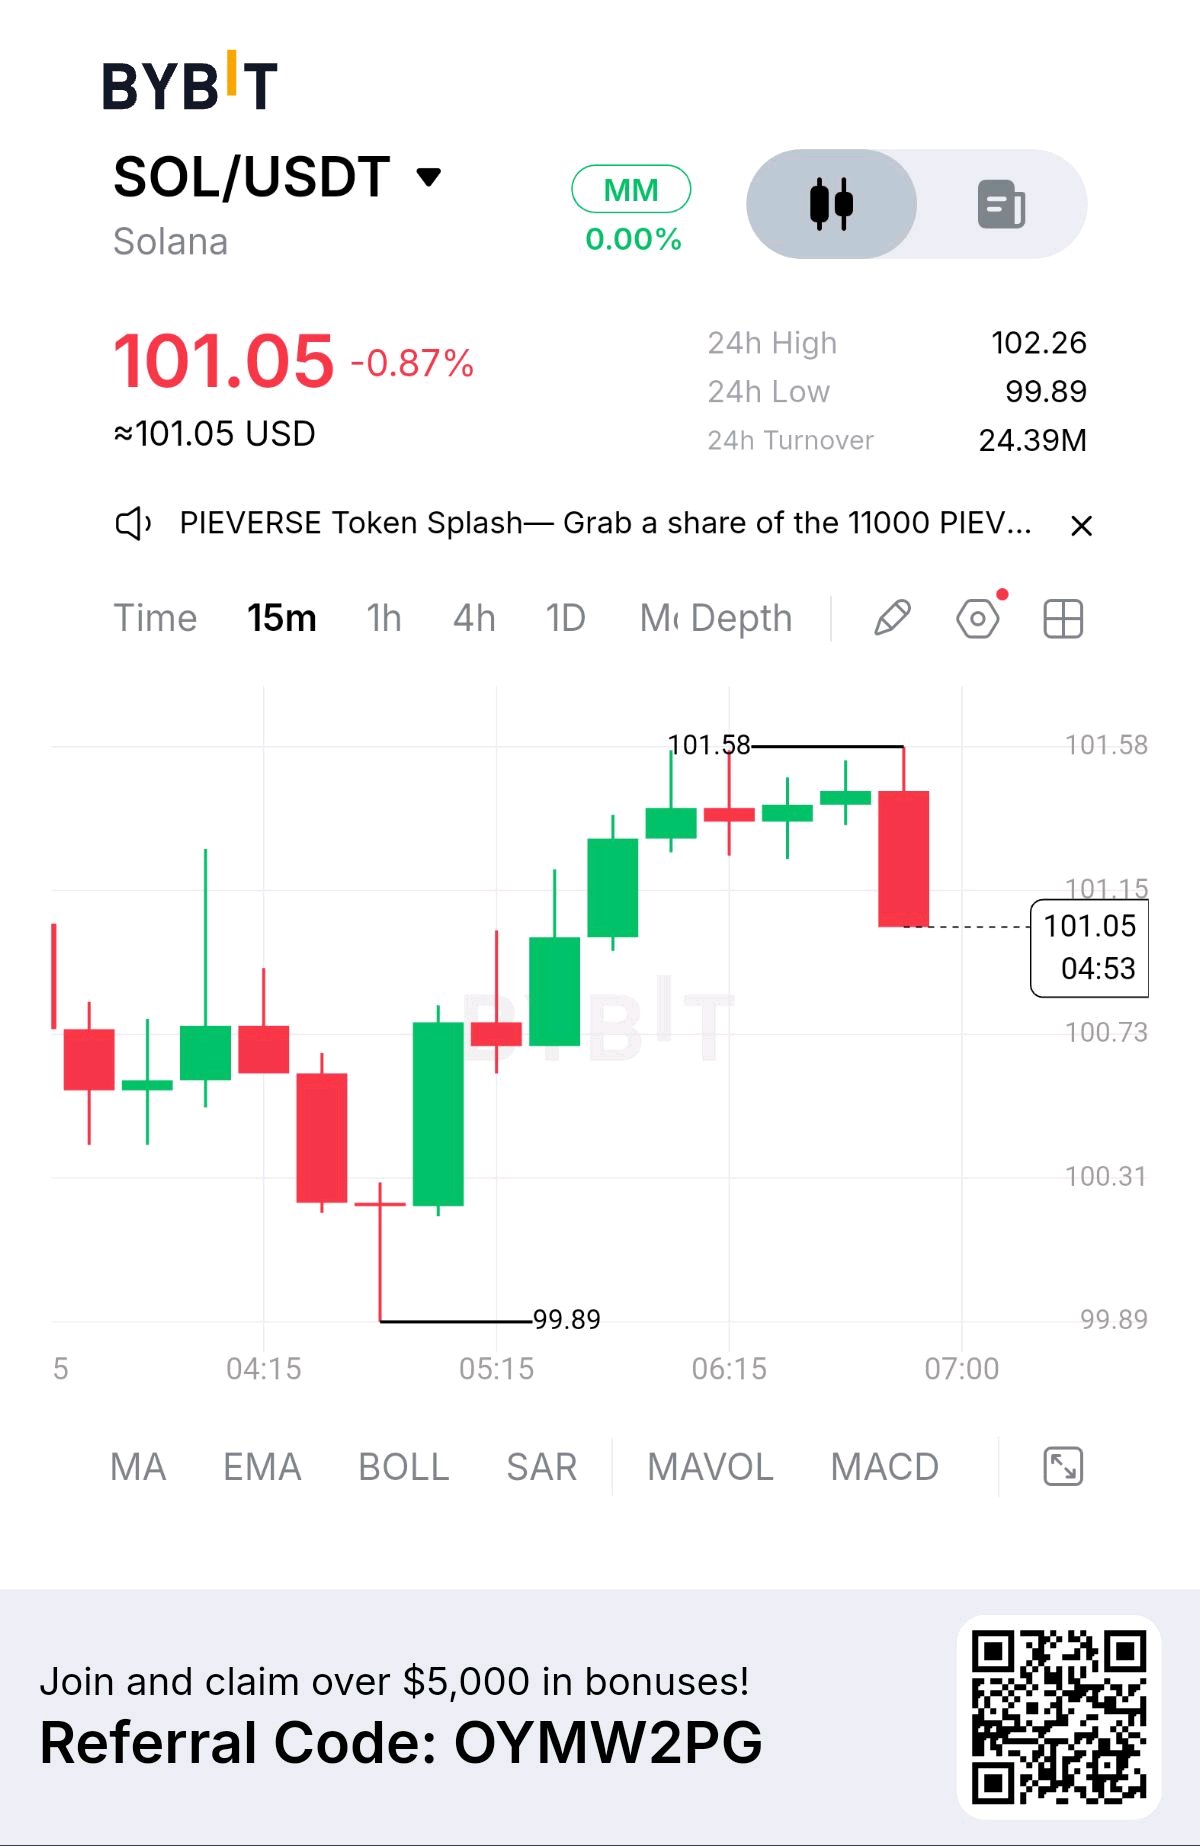
SOL Faces Rejection After Climbing to $101.58
Market Insight: Buyers Lose Short Term Control $SOLUSDT is trading at $101.05, down 0.87% over the last 24 hours. On the 15 minute chart, SOL recovered strongly from $99.89 before meeting resistance near $101.58. The latest large red candle signals a setback for short term buyers. The key question is whether this is a normal pullback or the beginning of a deeper correction. Market Snapshot • Current price: $101.05 • 24 hour change: −0.87% • 24 hour high: $102.26 • 24 hour low: $99.89 • 24 hour turnover: $24.39M • Chart timeframe: 15 minutes What the Chart Is Telling Us SOL rebounded from $99.89 and formed several upward candles, gradually moving toward $101.58. However, price failed to maintain that higher level, and the latest candle erased part of the recovery. This suggests that selling pressure has returned near resistance. One candle alone cannot confirm a full trend reversal, but it does make the next support test important. Key Levels to Watch • Immediate resistance: $101.58 • Near term reaction zone: $101.15 • Immediate support: $100.73 • Lower support: $100.31 • Major visible support: $99.89 Two Scenarios That Matter Bullish Recovery If SOL holds above $100.73 and reclaims $101.15, buyers may attempt another test of $101.58. A convincing breakout would need sustained price action above resistance. Bearish Continuation If selling pressure pushes SOL below $100.73, the $100.31 zone becomes the next area to watch. A deeper move could bring the $99.89 low back into focus. The Deeper Insight A strong rebound does not automatically mean the market has regained control. SOL must show that buyers can defend support and recover the levels lost in the latest pullback. The next reaction around $100.73 may reveal more than the daily percentage alone. Discussion Question Will SOL defend $100.73 and attempt another breakout, or will sellers drive price toward $100.31? What confirmation would you watch before choosing a direction? #ByXIMPACT #MyByXTake

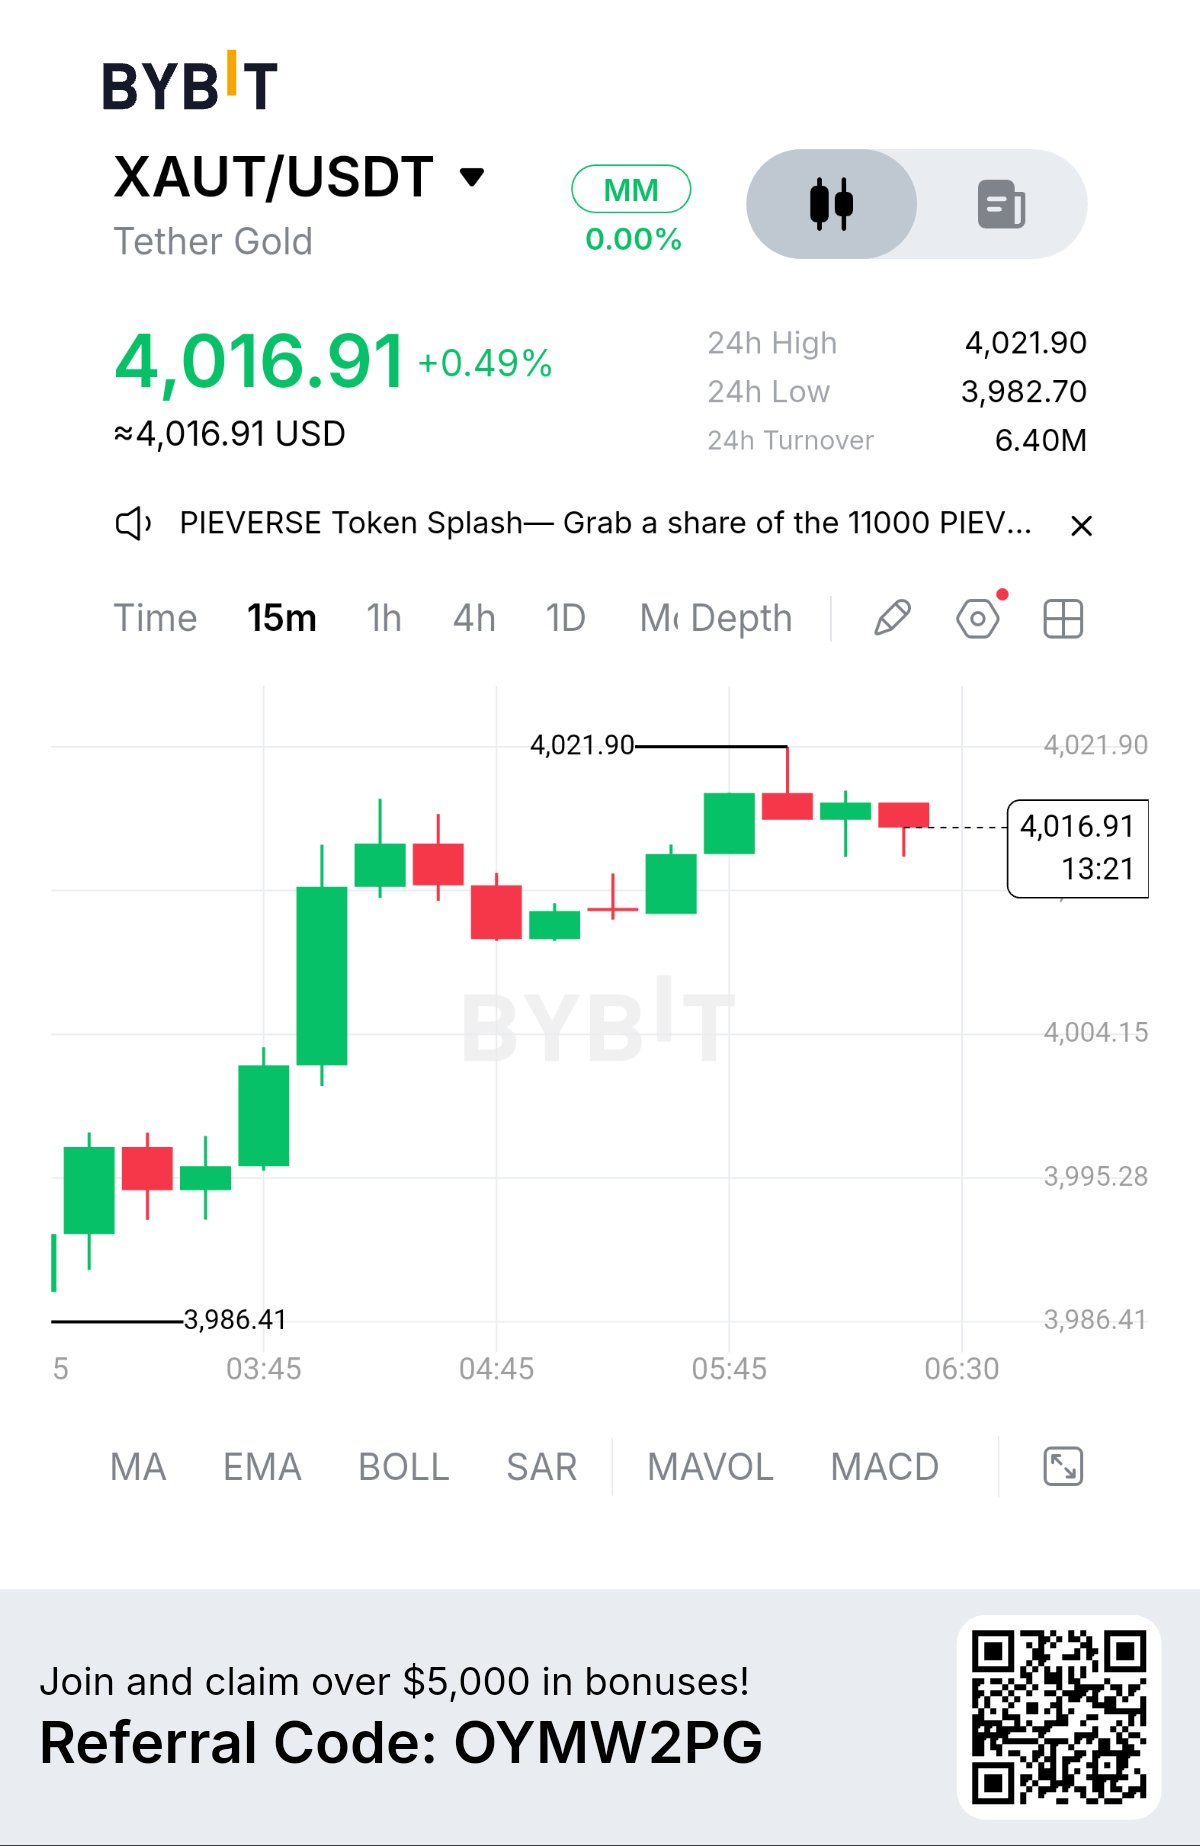
XAUT APPROACHES RESISTANCE AT $4,021
Market Structure: Bullish Momentum Meets Resistance $XAUTUSDT is trading at $4,017.61, up 0.51% over the last 24 hours. The 15 minute chart shows a strong upward move from the $3,986 area, followed by a pause near the session high of $4,021.90. The key question now is whether buyers can sustain momentum or whether resistance will trigger another pullback. Market Snapshot • Current price: $4,017.61 • 24 hour change: +0.51% • 24 hour high: $4,021.90 • 24 hour low: $3,982.70 • 24 hour turnover: $6.39M • Timeframe: 15 minutes What the Chart Reveals XAUT advanced through several price levels, forming a sequence of upward candles before reaching $4,021.90. Recent candles are smaller, suggesting that upward momentum has paused near resistance. This does not confirm a reversal. It shows that the market is approaching a level where the next price reaction matters. Key Levels to Watch • Immediate resistance: $4,021.90 • Nearby support: $4,013 area • Secondary support: $4,004.15 • Stronger visible support: $3,995.28 • Earlier swing low: $3,986.41 Possible Market Scenarios Bullish Continuation A convincing break above $4,021.90, followed by sustained trading above that level, would strengthen the case for further upside. Confirmation is more reliable if buying activity also increases. Bearish Pullback If XAUT fails to clear resistance and falls below the $4,013 area, price could revisit $4,004.15. A deeper decline would bring the $3,995.28 area into focus. The Market Insight A strong upward move does not guarantee another breakout. XAUT is now testing whether buyers have enough strength to push beyond the recent high. The next confirmed move matters more than the latest green candles. Discussion Question Will XAUT break above $4,021.90, or will resistance trigger a pullback? Which confirmation signal would you watch before drawing a conclusion? #ByXIMPACT #MyByXTake #Bybit8thAnniversary $SOLUSDT
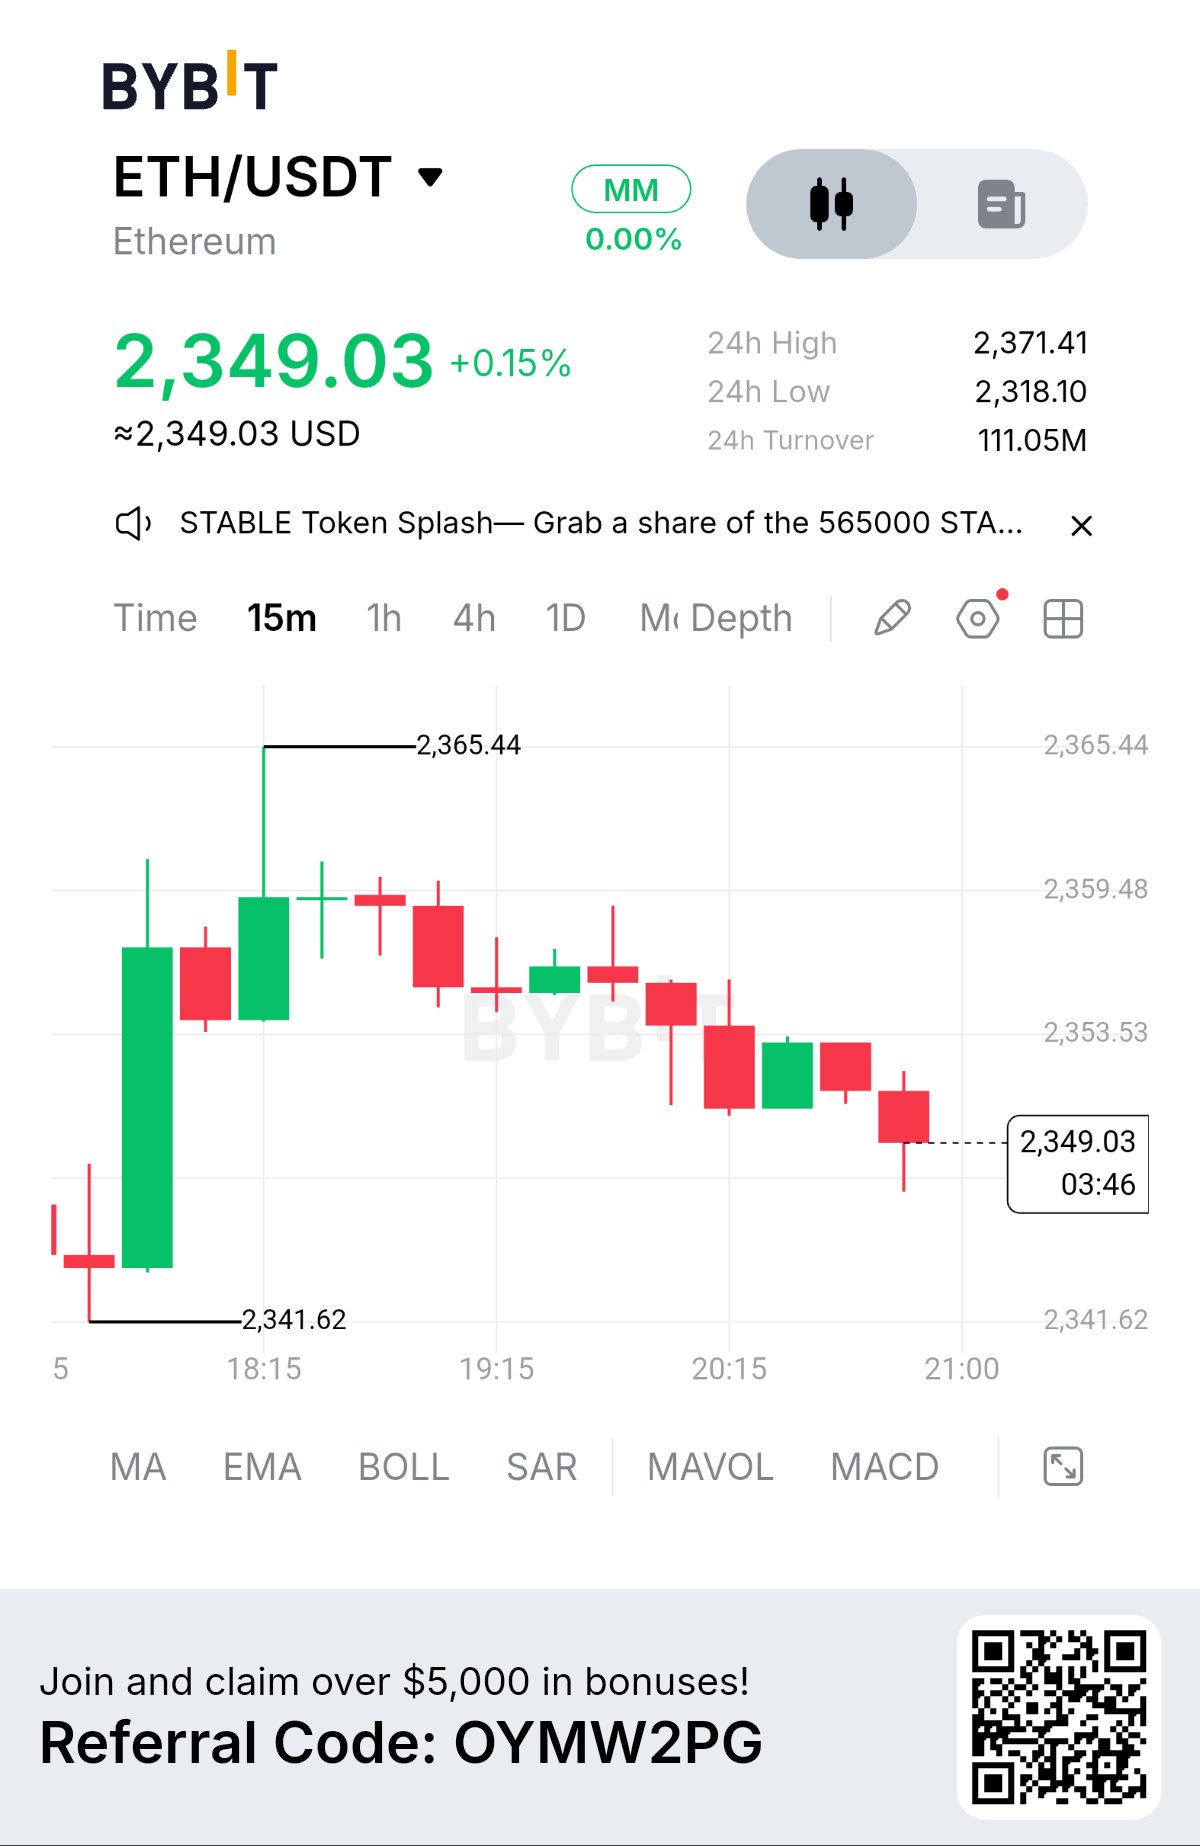
ETH FACES SELLING PRESSURE NEAR $2,349
Market Structure: Short Term Weakness $ETHUSDT is trading at $2,349.03, up 0.15% over the last 24 hours. Despite the small daily gain, the 15 minute chart shows weakening short term momentum after rejection from the $2,365.44 area. Market Snapshot • Current price: $2,349.03 • 24 hour change: +0.15% • 24 hour high: $2,371.41 • 24 hour low: $2,318.10 • 24 hour turnover: $111.05M • Timeframe: 15 minutes What the Chart Reveals After a strong upward candle, ETH failed to sustain its move toward the $2,365 area. The subsequent candles show lower highs and renewed selling pressure, with price returning toward $2,349. This suggests that short term buyers are losing momentum. However, the chart alone does not confirm a broader bearish reversal. Key Levels to Watch • Immediate support: $2,341.62 • Immediate resistance: $2,353.53 • Higher resistance: $2,359.48 • Major nearby resistance: $2,365.44 Possible Market Scenarios Bullish Case If ETH holds above $2,341.62 and recovers $2,353.53, buyers may attempt another move toward $2,359.48 and the previous $2,365.44 high. Bearish Case A clear break below $2,341.62 could expose ETH to further downside. Confirmation would require additional price action rather than a single candle. The Bigger Insight The important signal is not simply that ETH is up 0.15%. It is whether buyers can defend nearby support and reclaim lost resistance. Until that happens, caution remains justified. Discussion Question Will ETH defend $2,341.62 and recover momentum, or will sellers push price lower? What confirmation would you need before choosing a direction? #ByXIMPACT #MyByXTake $BTCUSDT
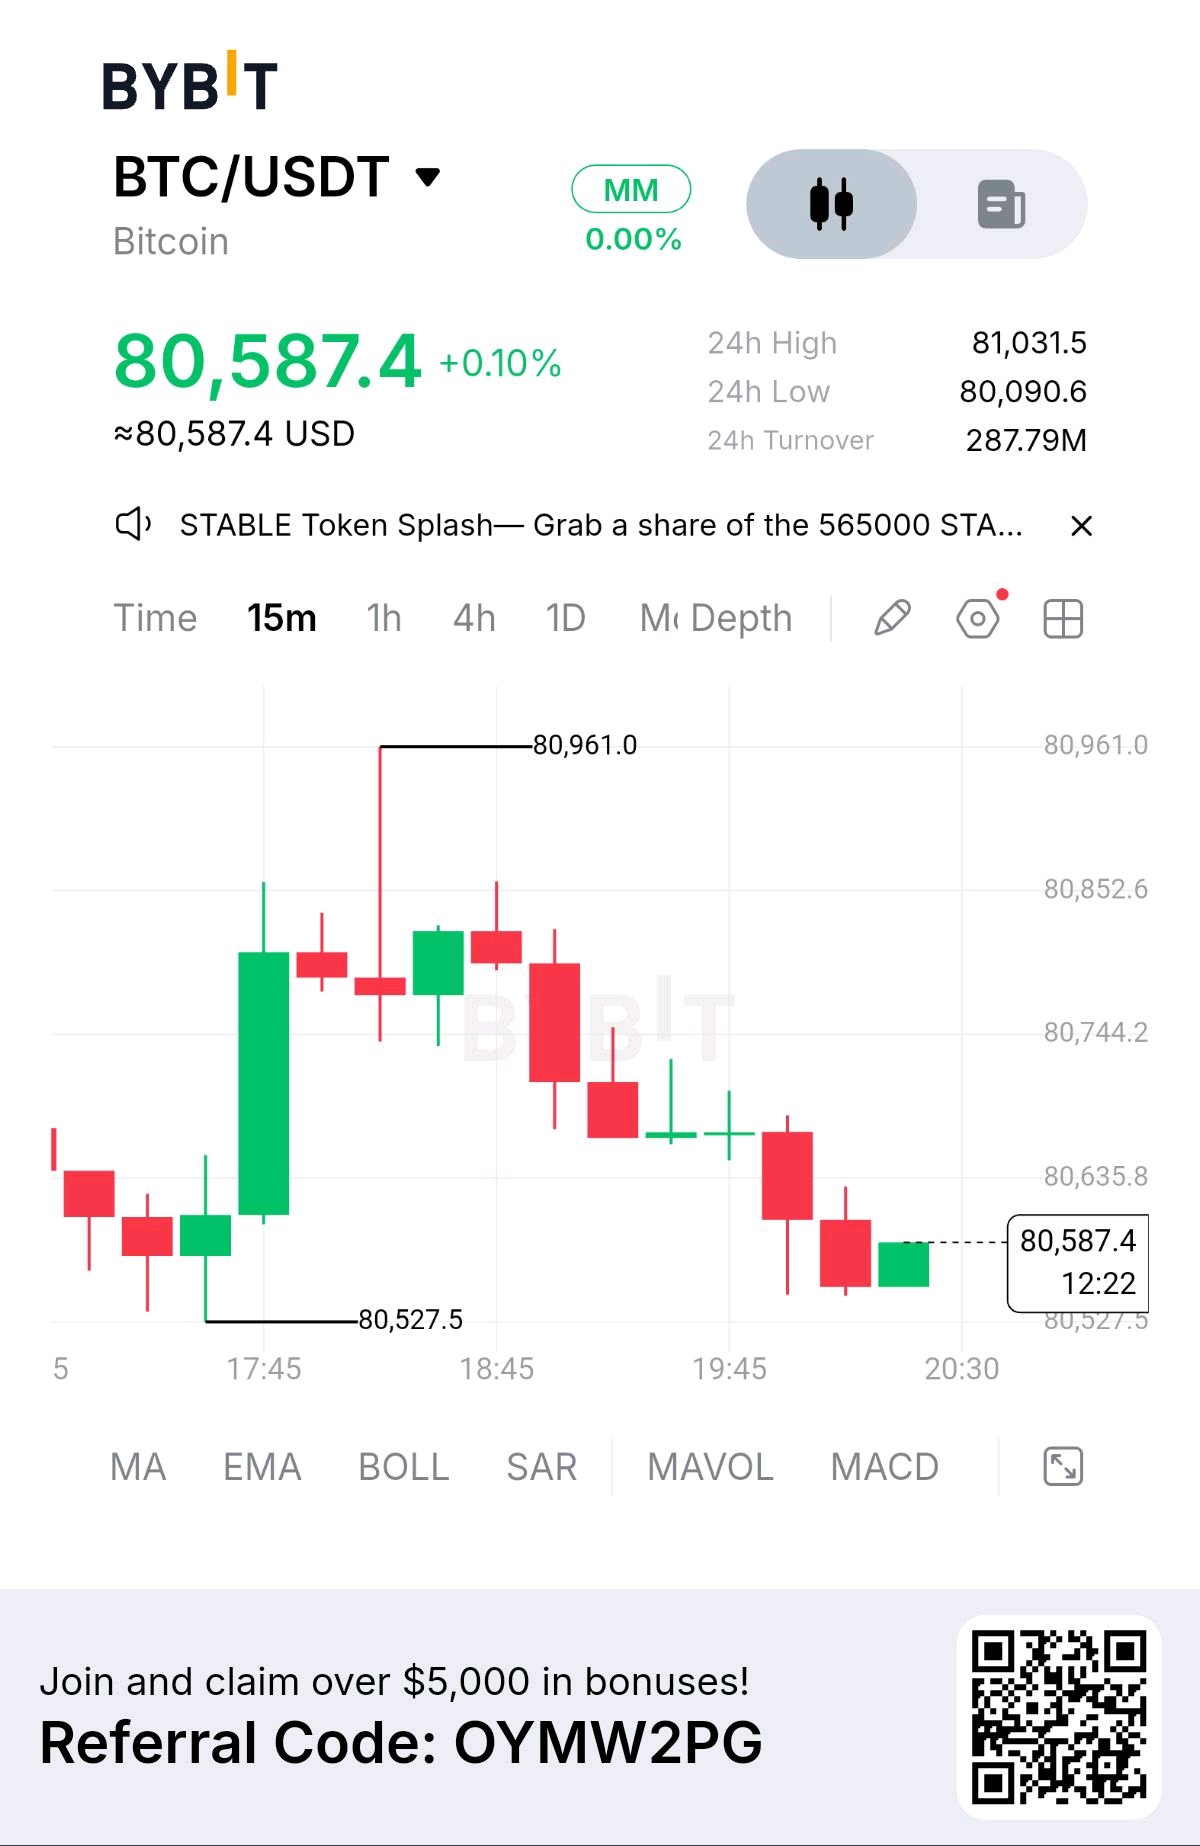
BTC REJECTS 80,961: PULLBACK IN PLAY
Market snapshot: $BTCUSDT is trading at 80,587.4, currently up +0.10% on the day. The 24-hour range shows a high of 81,031.5 and a low of 80,090.6, with a robust 24-hour turnover of 287.79M. Market structure: On the 15-minute timeframe, the market structure has shifted from a sharp impulsive move to a controlled pullback. After aggressively rallying off the 80,527.5 base, price surged to a local peak of 80,961.0. Since hitting that high, the structure has formed a series of lower highs and lower lows. The market is currently testing the lower boundary of this recent consolidation, indicating that short-term sellers are in control of the immediate price action. Technical evidence: The chart shows a distinct loss of bullish momentum. The initial upward thrust was strong, but the subsequent candles are predominantly bearish, steadily grinding lower. Notice the cluster of doji-like and small-bodied candles around the 19:45 mark—this represents a brief pause before the sellers pushed price down again. Price is currently hovering just above the 80,527.5 session low, with no clear signs of immediate buyer absorption on the visible chart. EMA, MACD, and volume data are not displayed, so analysis is based purely on price action and candle structure. Key levels: · Resistance: 80,961.0 — The absolute local high and the level where the initial rally was rejected. · Support: 80,527.5 — The base of the recent impulsive leg up. This is the critical line in the sand for short-term bulls. Bullish and bearish scenarios: · Bullish scenario: For the uptrend to resume, price must stabilize here and print a strong bullish engulfing candle that closes decisively back above the 80,744.2 level, with a subsequent break of 80,961.0 to confirm a trend continuation. · Bearish scenario: If the current price action continues to grind down and the 15-minute candle closes below 80,527.5, it would invalidate the recent bullish impulse entirely, likely leading to further downside toward the 80,090.6 24-hour low. Risk and invalidation: The setup is currently WAIT for a long entry. Catching a falling knife in a 15-minute downtrend is risky, and the price is pressing against critical support. The bearish thesis is invalidated if price finds immediate, high-volume support here and breaks back above 80,744. The bullish thesis is invalidated if we get a clean close below 80,527.5. Trader insight: When a strong impulse is followed by a slow, grinding pullback, it is often a healthy retracement before continuation. However, if that pullback accelerates and breaks the origin of the impulse (80,527.5), it usually means the initial move was a fakeout or a liquidity grab. Watch the reaction at this current level closely—how the next few 15-minute candles close will dictate the short-term direction. Engagement question: Are you treating this 15-minute pullback as an accumulation zone before the next leg up, or is a break below 80,527.5 your signal to look short? #ByXIMPACT #MyByXTake #USNonfarmPayrolls $ETHUSDT
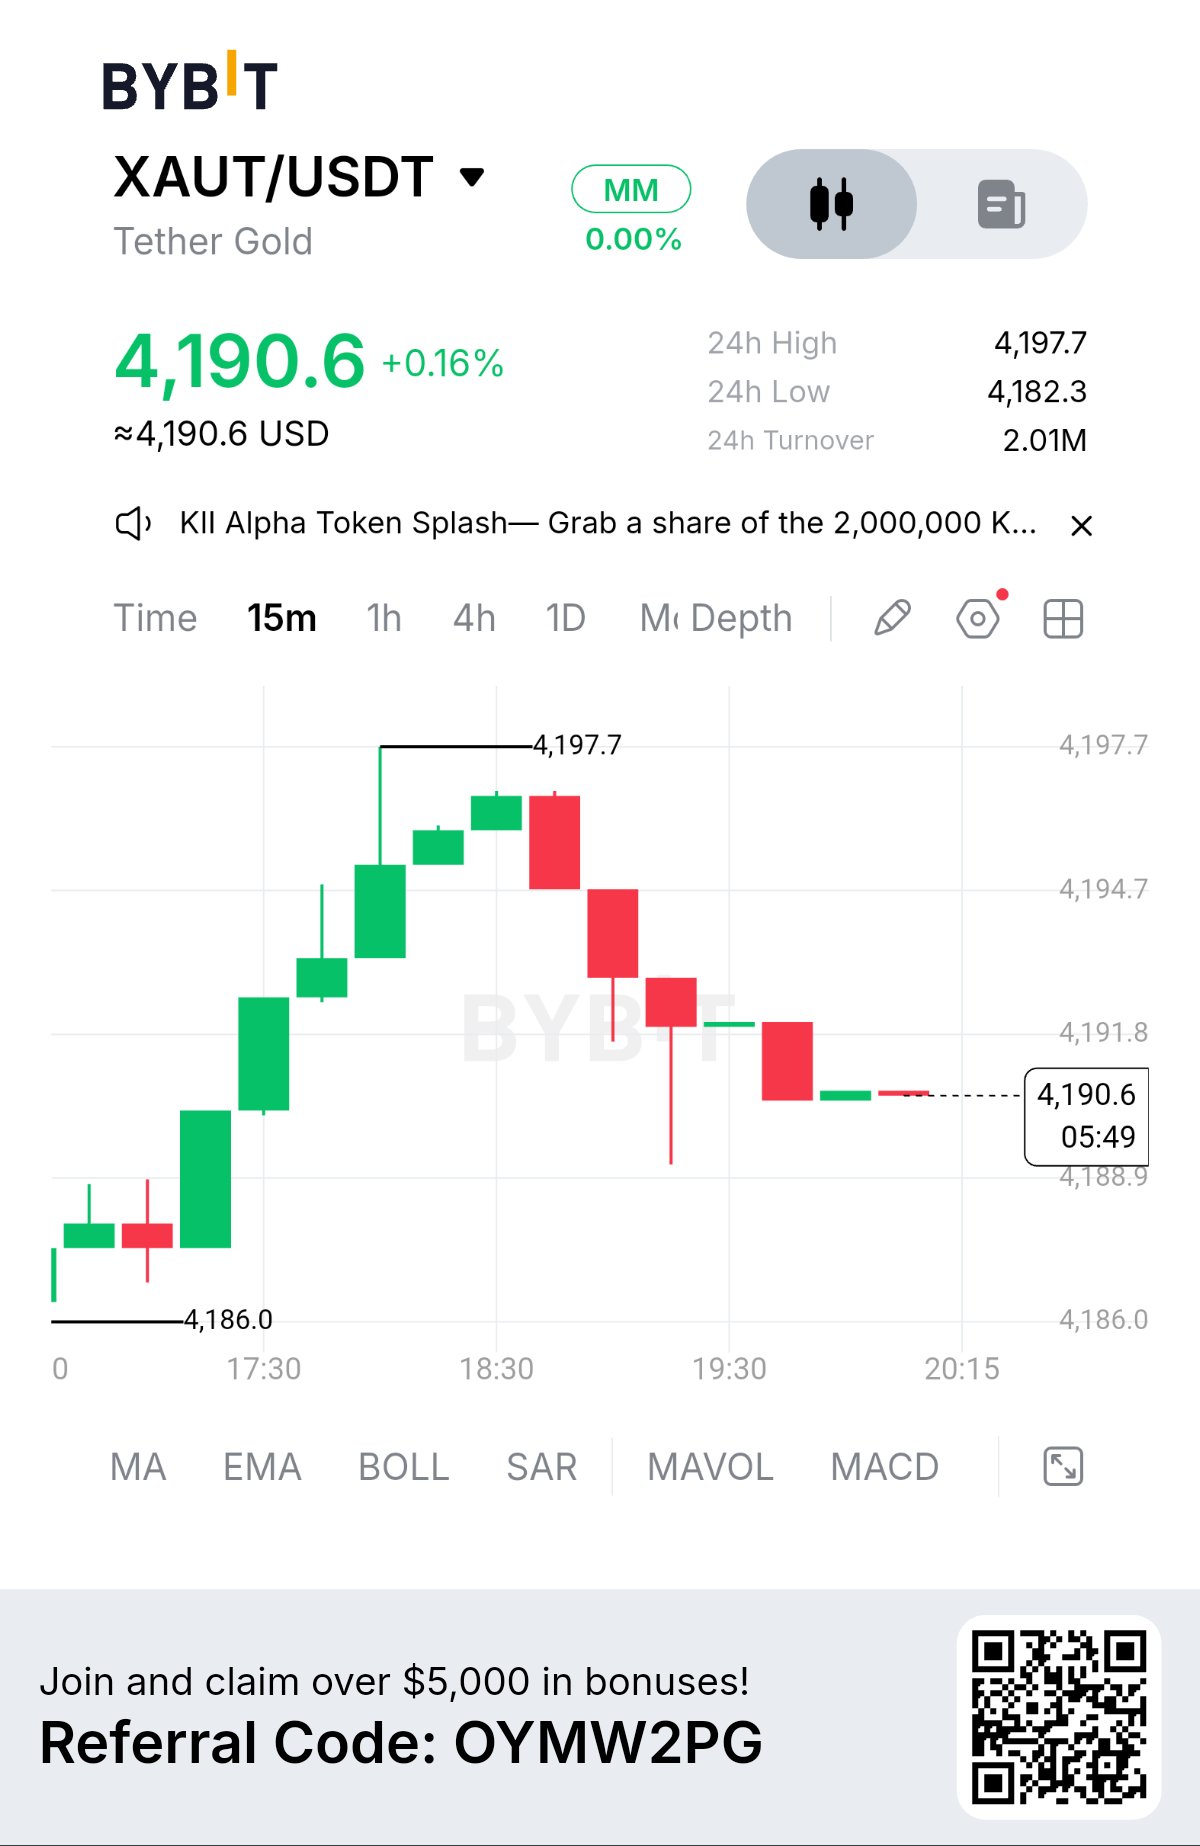
XAUT PULLS BACK AFTER REJECTION AT 4,197
Market snapshot: $XAUTUSDT is trading at 4,190.6, up +0.16% on the day. The 24-hour range is tight, with a high of 4,197.7 and a low of 4,182.3. 24-hour turnover sits at 2.01M USDT. Market structure: On the 15-minute timeframe, the market is showing a clear rejection pattern. After an impulsive upward move from the 4,186.0 session low, price rallied to tag the 4,197.7 24-hour high. Since that peak, we have seen a series of lower highs and lower lows, indicating short-term bearish pressure and a loss of immediate bullish momentum. Technical evidence: The chart currently shows a pullback structure. The rally to 4,197.7 was met with immediate selling, and the subsequent candles have retraced a significant portion of that move. Price is now consolidating near 4,190.6, essentially holding the midpoint of the recent swing. With no moving averages or MACD visible on the provided screenshot, the primary evidence here is pure price action: a failed breakout attempt followed by a controlled decline. Key levels: · Resistance: 4,197.7 — The 24-hour high and the exact level where sellers stepped in. Bulls need to reclaim this to resume the uptrend. · Support: 4,186.0 — The base of the recent impulse move. Losing this level would confirm a full retracement of the rally. Bullish and bearish scenarios: · Bullish scenario: If price stabilizes above 4,190 and prints a strong green candle that closes above 4,197.7, it would signal that the pullback is over and buyers are defending the trend. · Bearish scenario: If the current consolidation breaks down and price closes below 4,186.0, it would confirm a lower low on the 15-minute chart, opening the door for further downside toward the 4,180s. Risk and invalidation: The setup is currently unclear for a long entry because price is mid-range and lacking confirmation. The analysis would be invalidated if price suddenly spikes above 4,197.7 with high volume, negating the bearish pullback thesis. WAIT for a clear break of 4,197.7 or a breakdown below 4,186.0 before committing to a direction. Do not force a trade in this tight range. Trader insight: When an asset rallies to a 24-hour high and immediately rejects, it often traps late buyers. The subsequent pullback is a test of conviction. Watch how price behaves at the 4,186.0 support—if it bounces quickly, the uptrend is intact; if it breaks, the market is telling you the rally was just a liquidity grab. Engagement question: Given the tight 24-hour range, are you waiting for a breakout above 4,197.7 or a breakdown below 4,186.0 to confirm your next trade? #ByXIMPACT
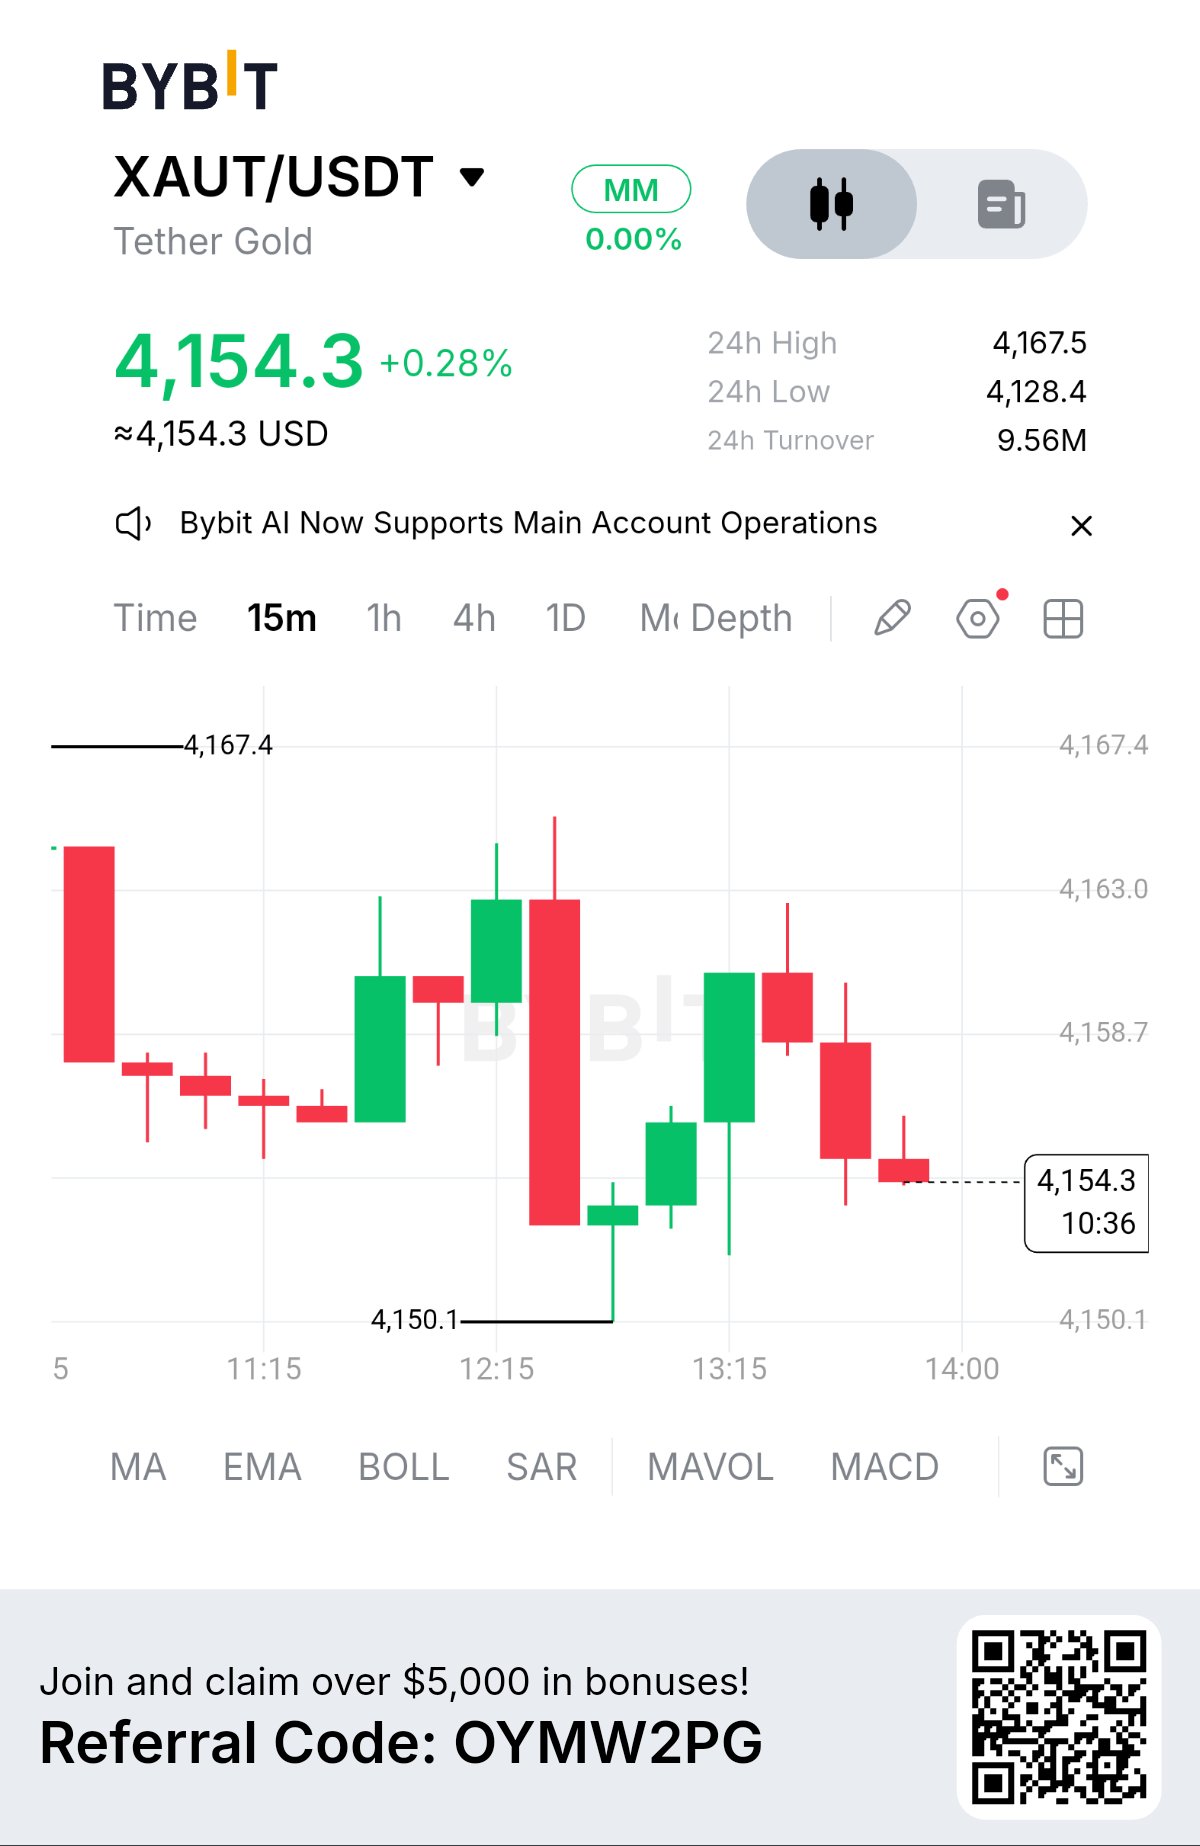
XAUT SITS ON 4,150: PRESSURE BUILDING
$XAUTUSDT is holding around 4,154.3, up 0.28% in 24 hours. Price has moved between 4,128.4 and 4,167.5, with 9.56M USDT in turnover. The interesting part is happening around 4,150. After getting rejected near 4,167.4, XAUT pulled back and buyers managed to defend 4,150.1. But the recovery has not shown much strength. Instead, price is slowly drifting back toward the same support zone. That makes 4,150.1 the level to watch. A strong bounce from here would show that buyers are still willing to defend the range and could put 4,158.7 and 4,167.4 back in focus. But if price keeps pressing against 4,150 without producing a meaningful bounce, the support could eventually give way. A breakdown would bring 4,128.4 into play. Levels on watch 4,167.4 — Range resistance 4,158.7 — Immediate barrier 4,150.1 — Critical support 4,128.4 — Deeper downside level For now, XAUT is not giving a clear directional signal. It is compressing around support, and the next decisive candle could reveal which side is gaining control. Is 4,150 becoming a launchpad for another move higher, or is the support slowly running out of strength? #ByXIMPACT $AAPLXUSDT
MNT HOLDS 0.6533: BREAKOUT OR BREAKDOWN
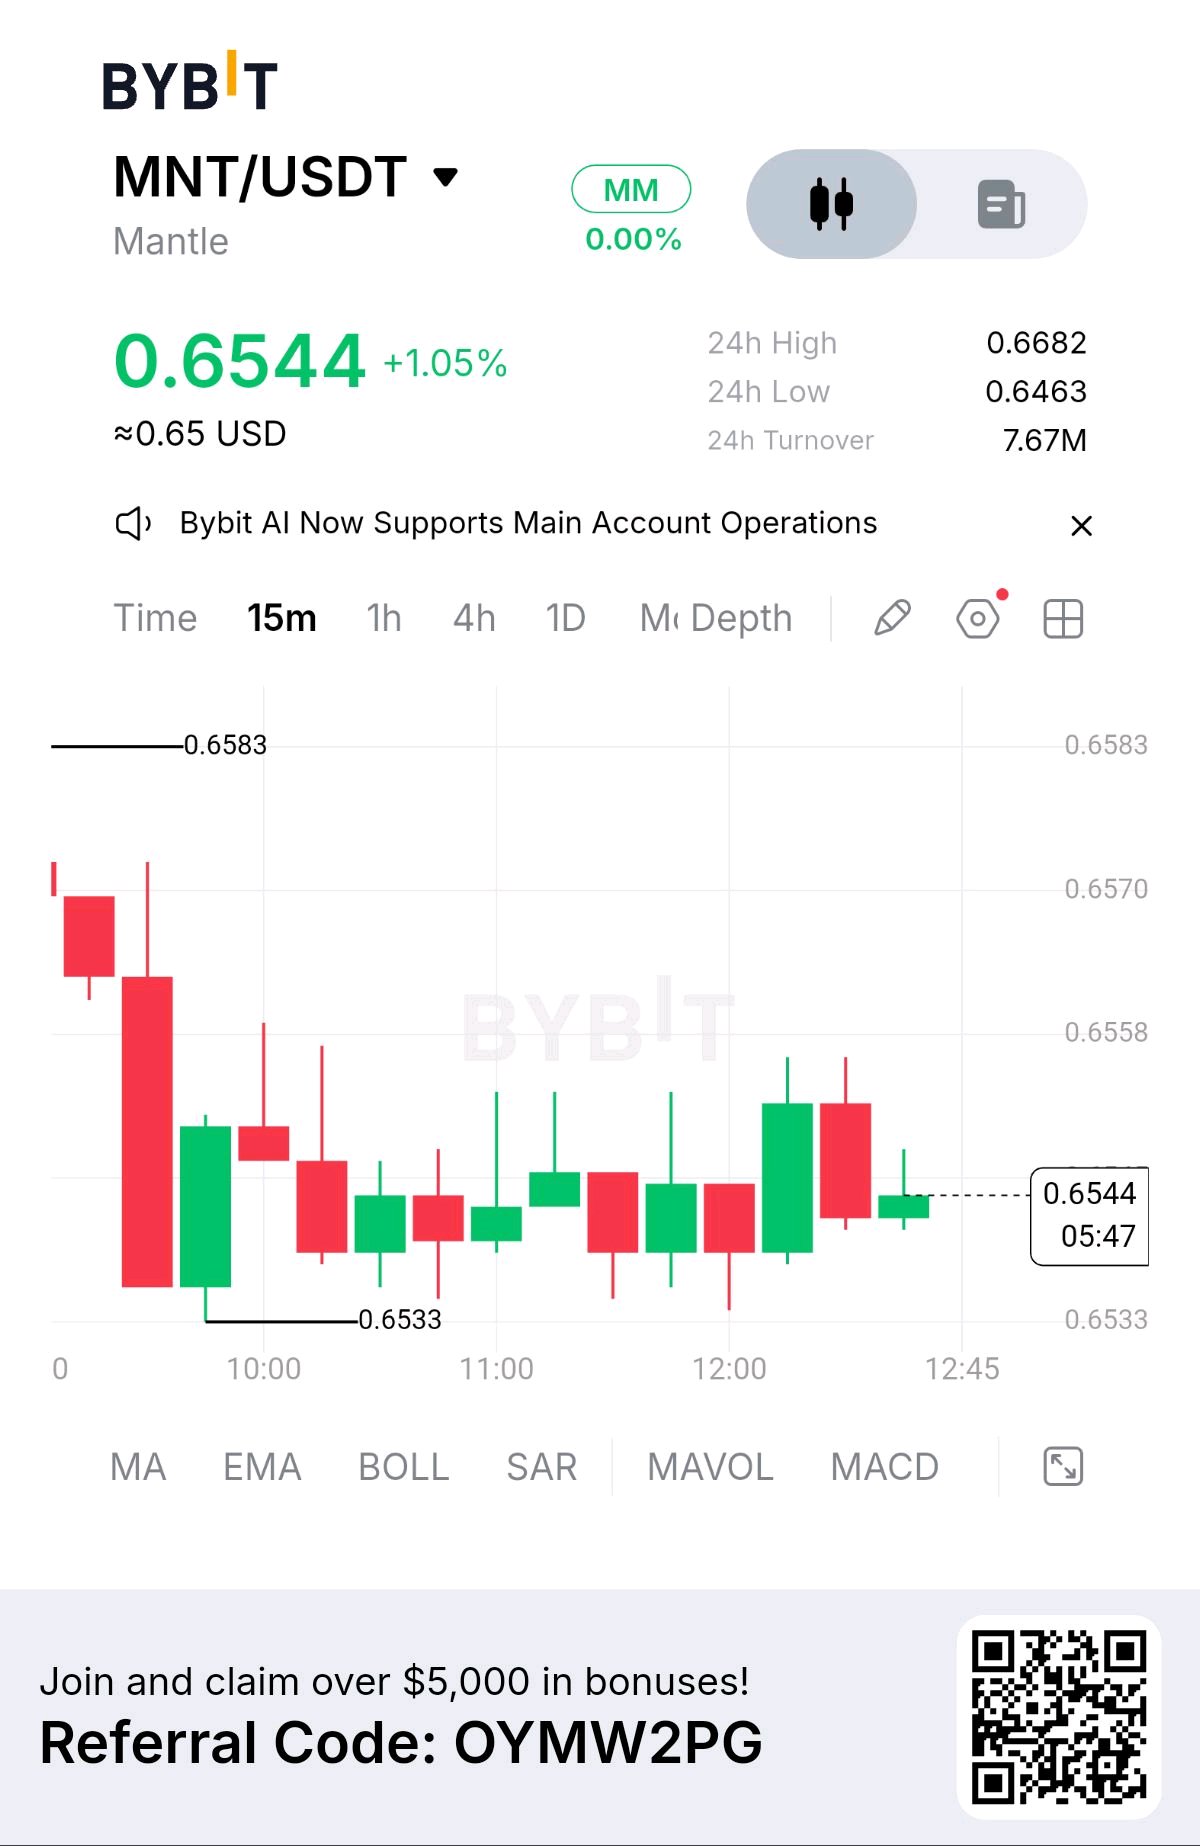
$MNTUSDT is trading at 0.6544, up 1.05% over the past 24 hours. Price reached a high of 0.6682 and a low of 0.6463, with 7.67M USDT in 24-hour turnover. On the 15-minute chart, MNT is consolidating after a sharp sell-off. Price found support around 0.6533 and has since moved sideways in a tight range, showing clear compression beneath short-term resistance. Buyers continue defending 0.6533, but repeated attempts to push above 0.6560 have been rejected. The small overlapping candles and wicks on both sides show strong indecision, with neither bulls nor bears fully in control. Key Levels Resistance: 0.6560 → 0.6583 → 0.6682 Support: 0.6533 → 0.6500 → 0.6463 Bullish Scenario A strong close above 0.6560 could confirm a breakout, opening the path toward 0.6583 and potentially the 0.6682 session high. Bearish Scenario A clean break below 0.6533 would weaken the structure and could send MNT toward 0.6500, with 0.6463 as the deeper support. MNT is now tightly compressed beneath resistance. The next volume-backed breakout or breakdown could reveal the direction of the next major move. Will MNT reclaim 0.6580, or will bears break the 0.6533 floor? #ByXIMPACT $SOLUSDT
BTC Tests 86,000: Breakout or Rejection?
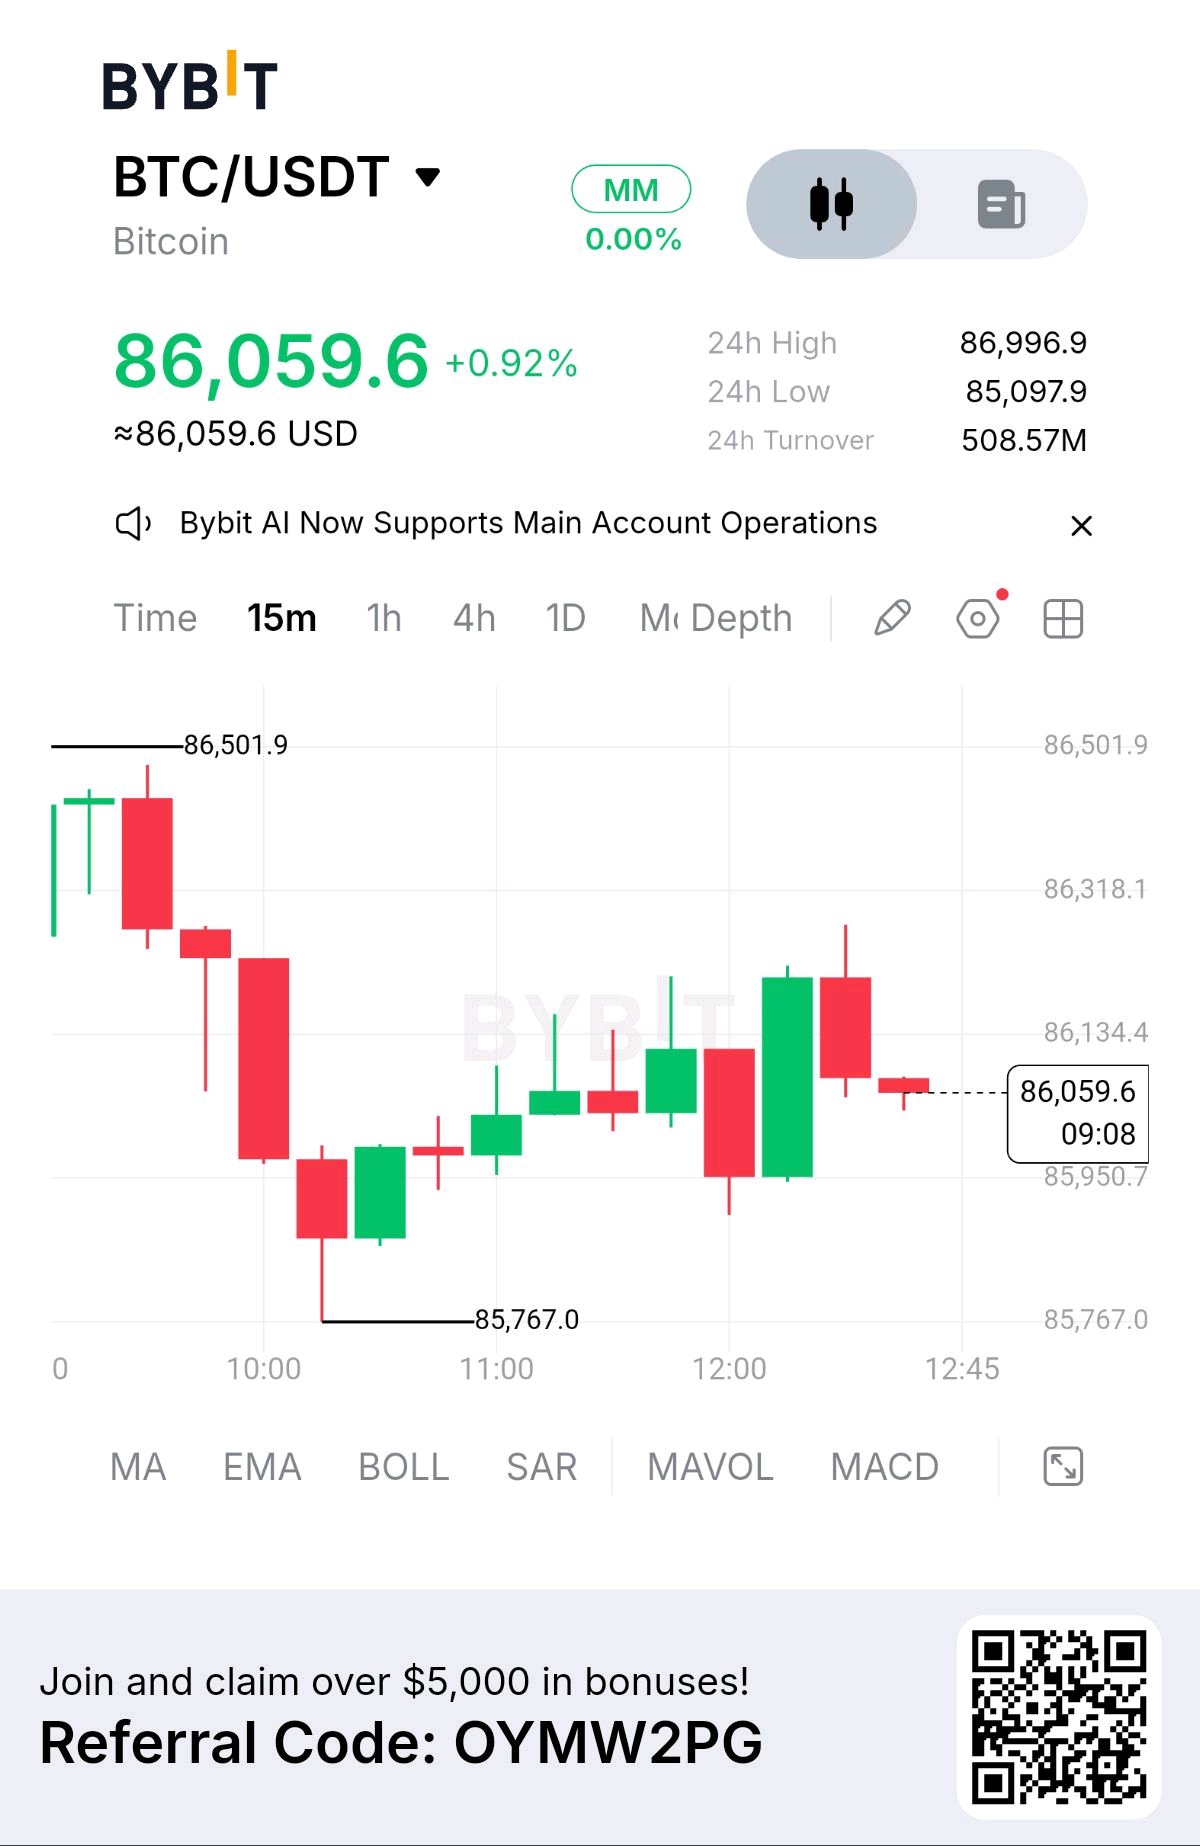
$BTCUSDT is trading at 86,059.6, up 0.92% over the past 24 hours. Price reached a high of 86,996.9 and a low of 85,097.9, with 508.57M USDT in 24-hour turnover. On the 15-minute chart, BTC is attempting to recover after a sharp sell-off. Price found support around 85,767.0 and has since formed a slow, choppy rebound toward the 86,000 zone. However, buyers are facing immediate resistance at 86,134.4. The recovery lacks strong impulsive candles, suggesting that buyers are still cautious rather than aggressively taking control. Key Levels Resistance: 86,134.4 → 86,318.1 → 86,501.9 Support: 85,950.7 → 85,767.0 Bullish Scenario A clean break and hold above 86,134.4 could strengthen momentum toward 86,318.1, with 86,501.9 becoming the next major test. Bearish Scenario Failure to reclaim 86,134.4, followed by a break below 85,950.7, could expose BTC to another retest of 85,767.0. BTC is currently consolidating beneath short-term resistance. The next decisive move could determine whether this is a genuine recovery or simply a pause before another leg lower. Will BTC reclaim 86,500, or will resistance trigger another retest of the lows? #ByXIMPACT $XRPUSDT
ETH RECLAIMS 2,720: CAN BULLS PUSH HIGHER
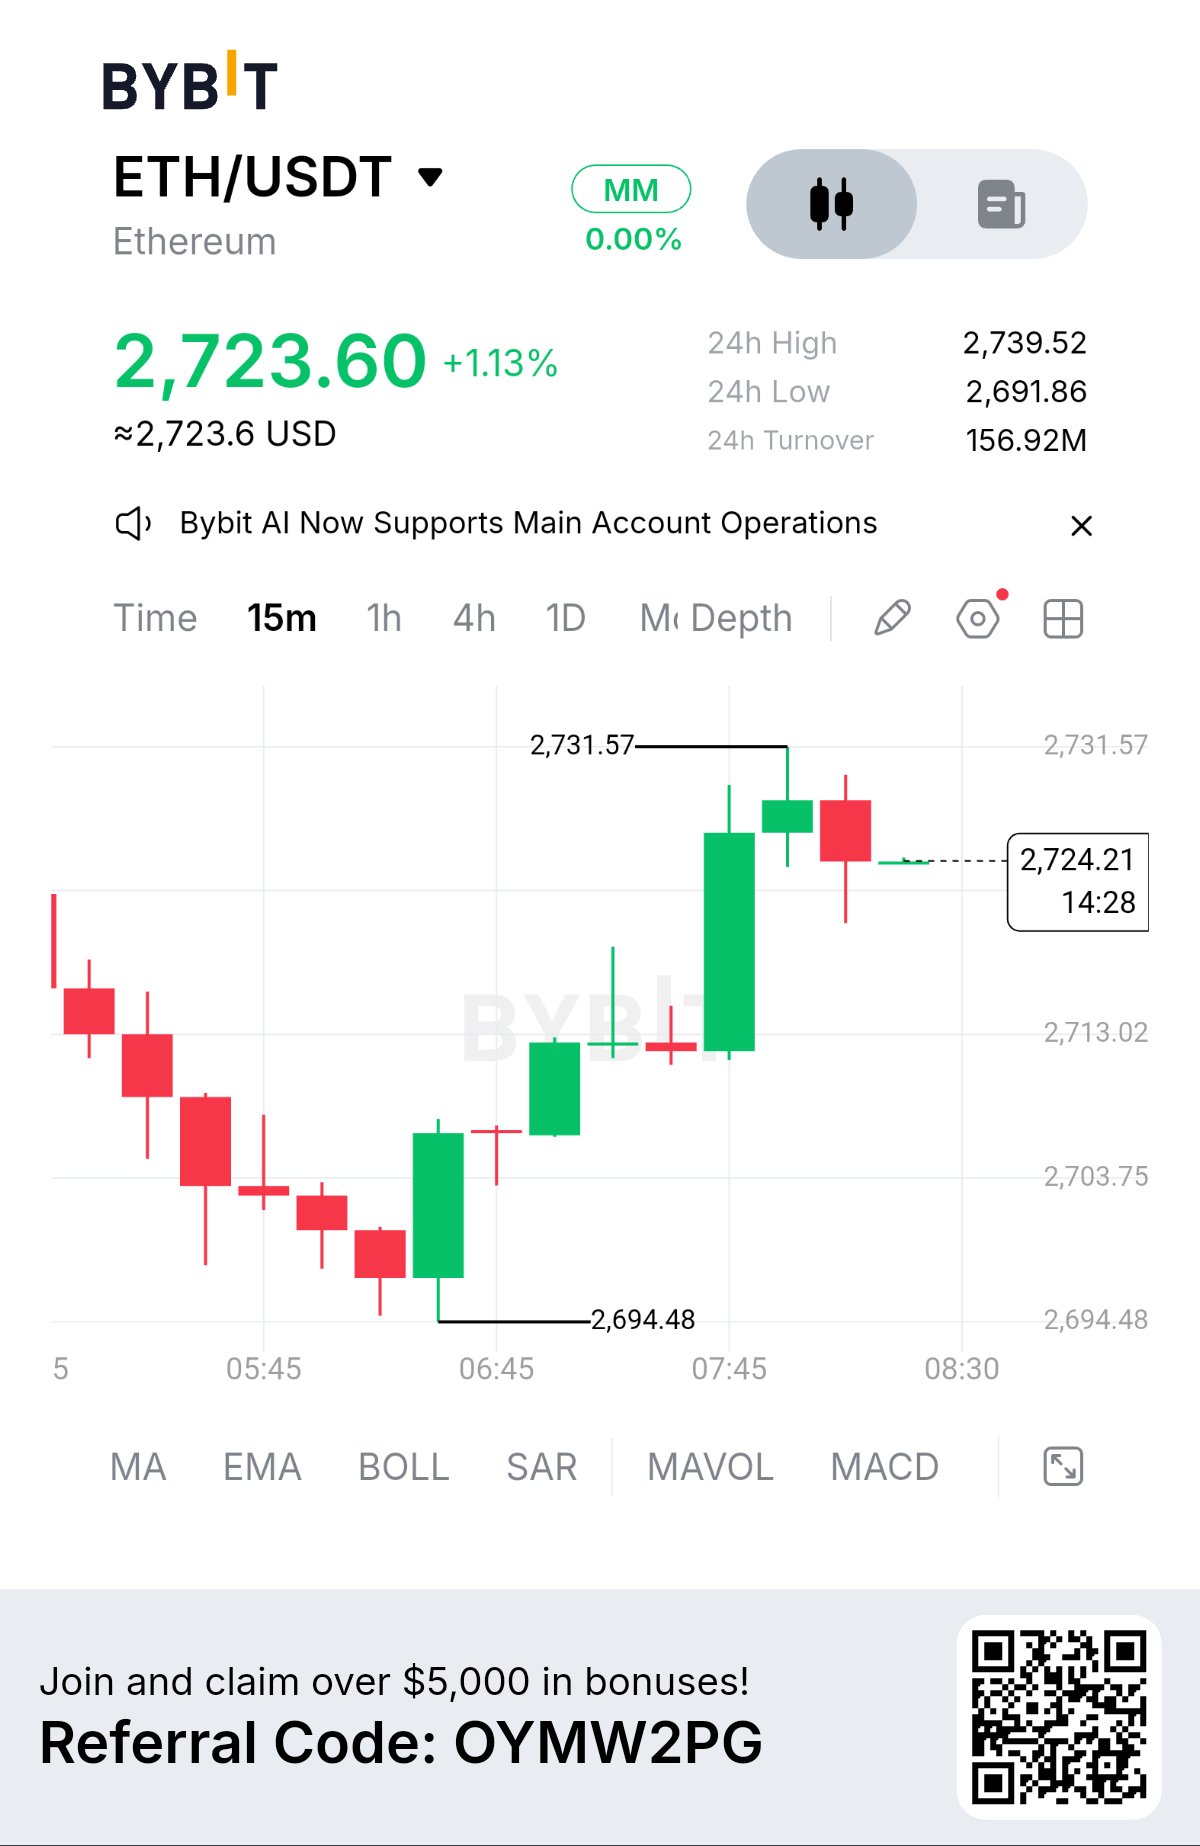
$ETHUSDT is trading at 2,723.60, up 1.13% in the last 24 hours. Price reached a session high of 2,739.52 and a low of 2,691.86, with 156.92M USDT in 24-hour turnover. On the 15-minute chart, ETH has shifted from a bearish structure into a strong short-term recovery. After finding support around 2,694.48, buyers stepped in aggressively, driving price back above the 2,720 zone. However, the move is now facing resistance near 2,731.57. The recent rejection wick suggests sellers are still active around this area, making the next few candles important. Key Levels Resistance: 2,731.57 → 2,739.52 → 2,745 Support: 2,713.02 → 2,700 → 2,694.48 Bullish Scenario If ETH holds above 2,713.02 and breaks 2,731.57, buyers could target 2,739.52 and potentially push toward 2,745+. Bearish Scenario A clear break below 2,713.02 could weaken the recovery and send ETH back toward the 2,700–2,694 support zone. ETH is now at a key decision point. The V-shaped recovery looks strong, but bulls still need to prove they can break the 2,731–2,739 resistance zone. Will ETH hold 2,713 and break higher, or are sellers preparing another pullback? #ByXIMPACT $BTCUSDT
BTC & ETH LEAD THE SHORT-TERM MARKET MOVE
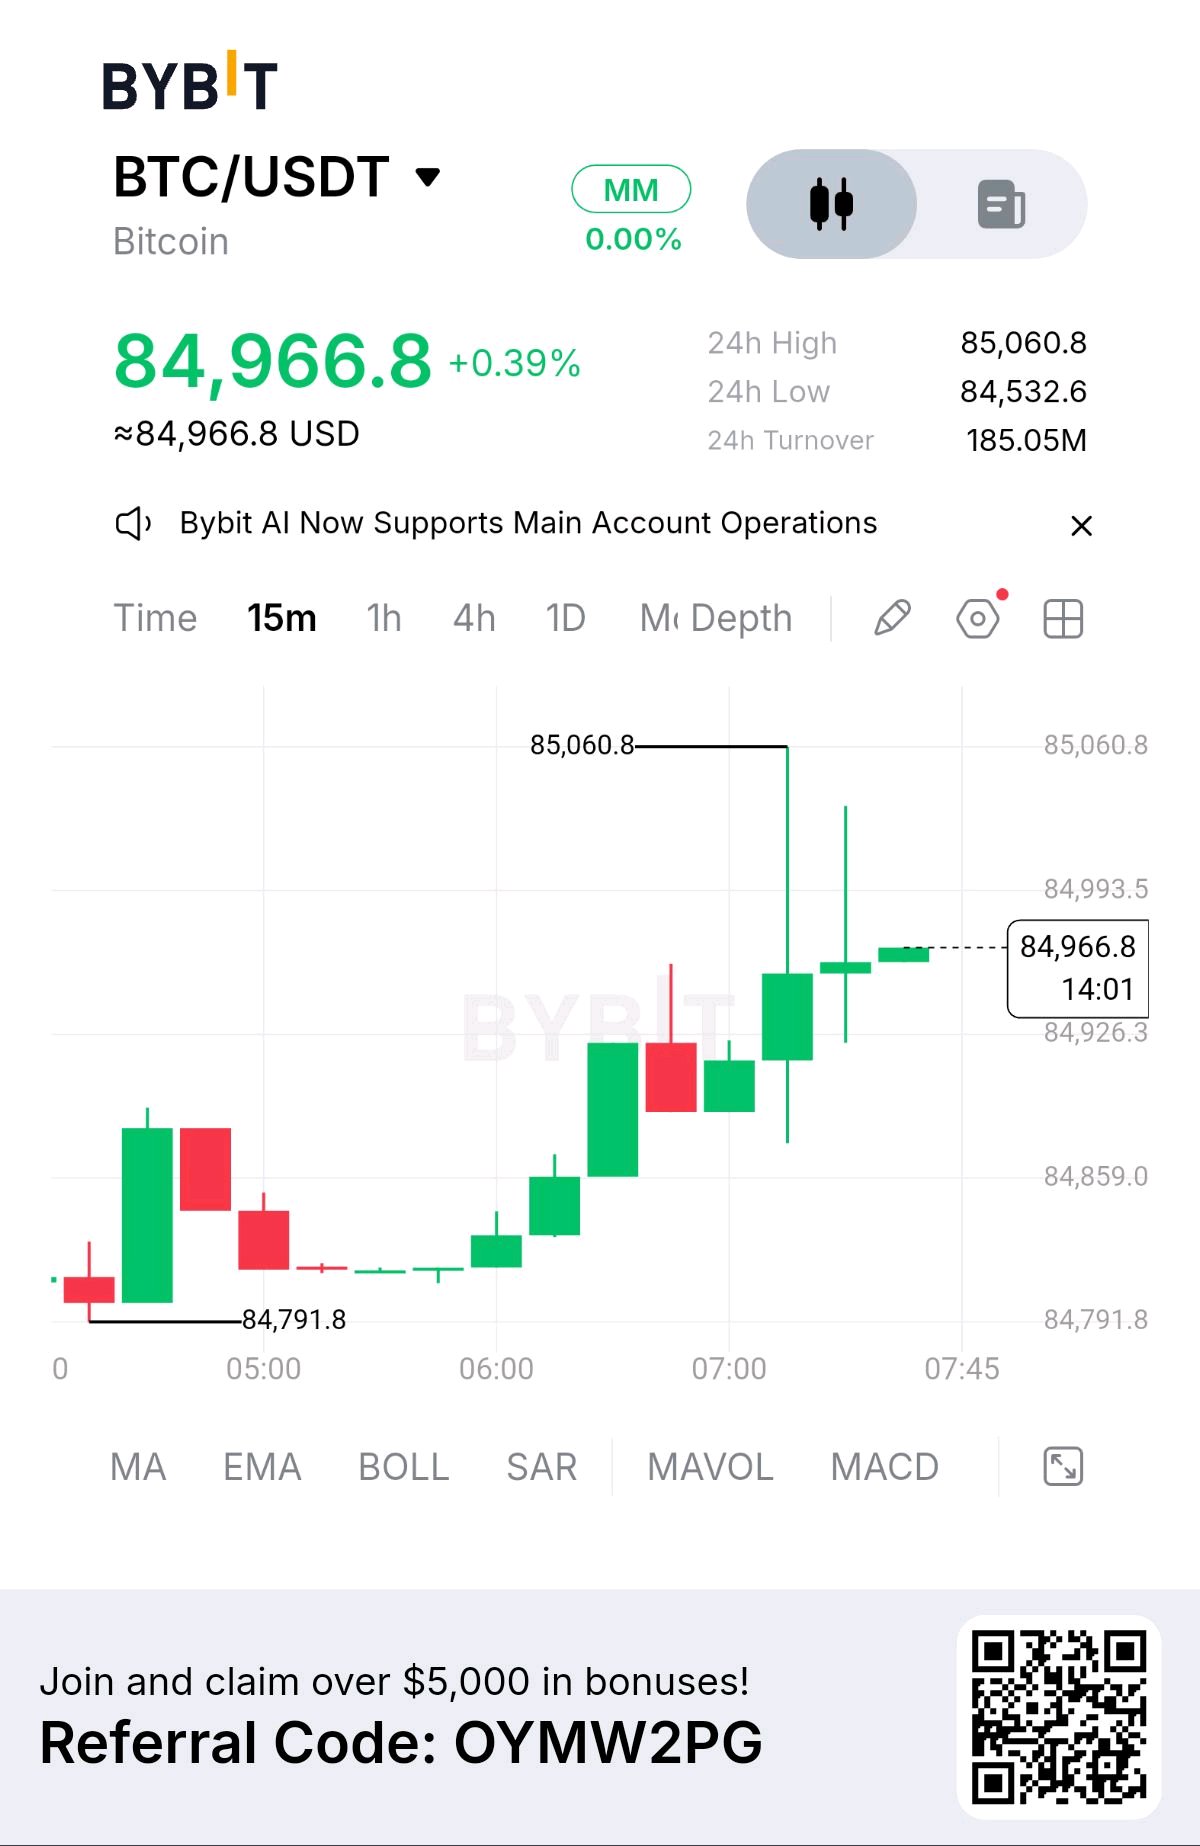
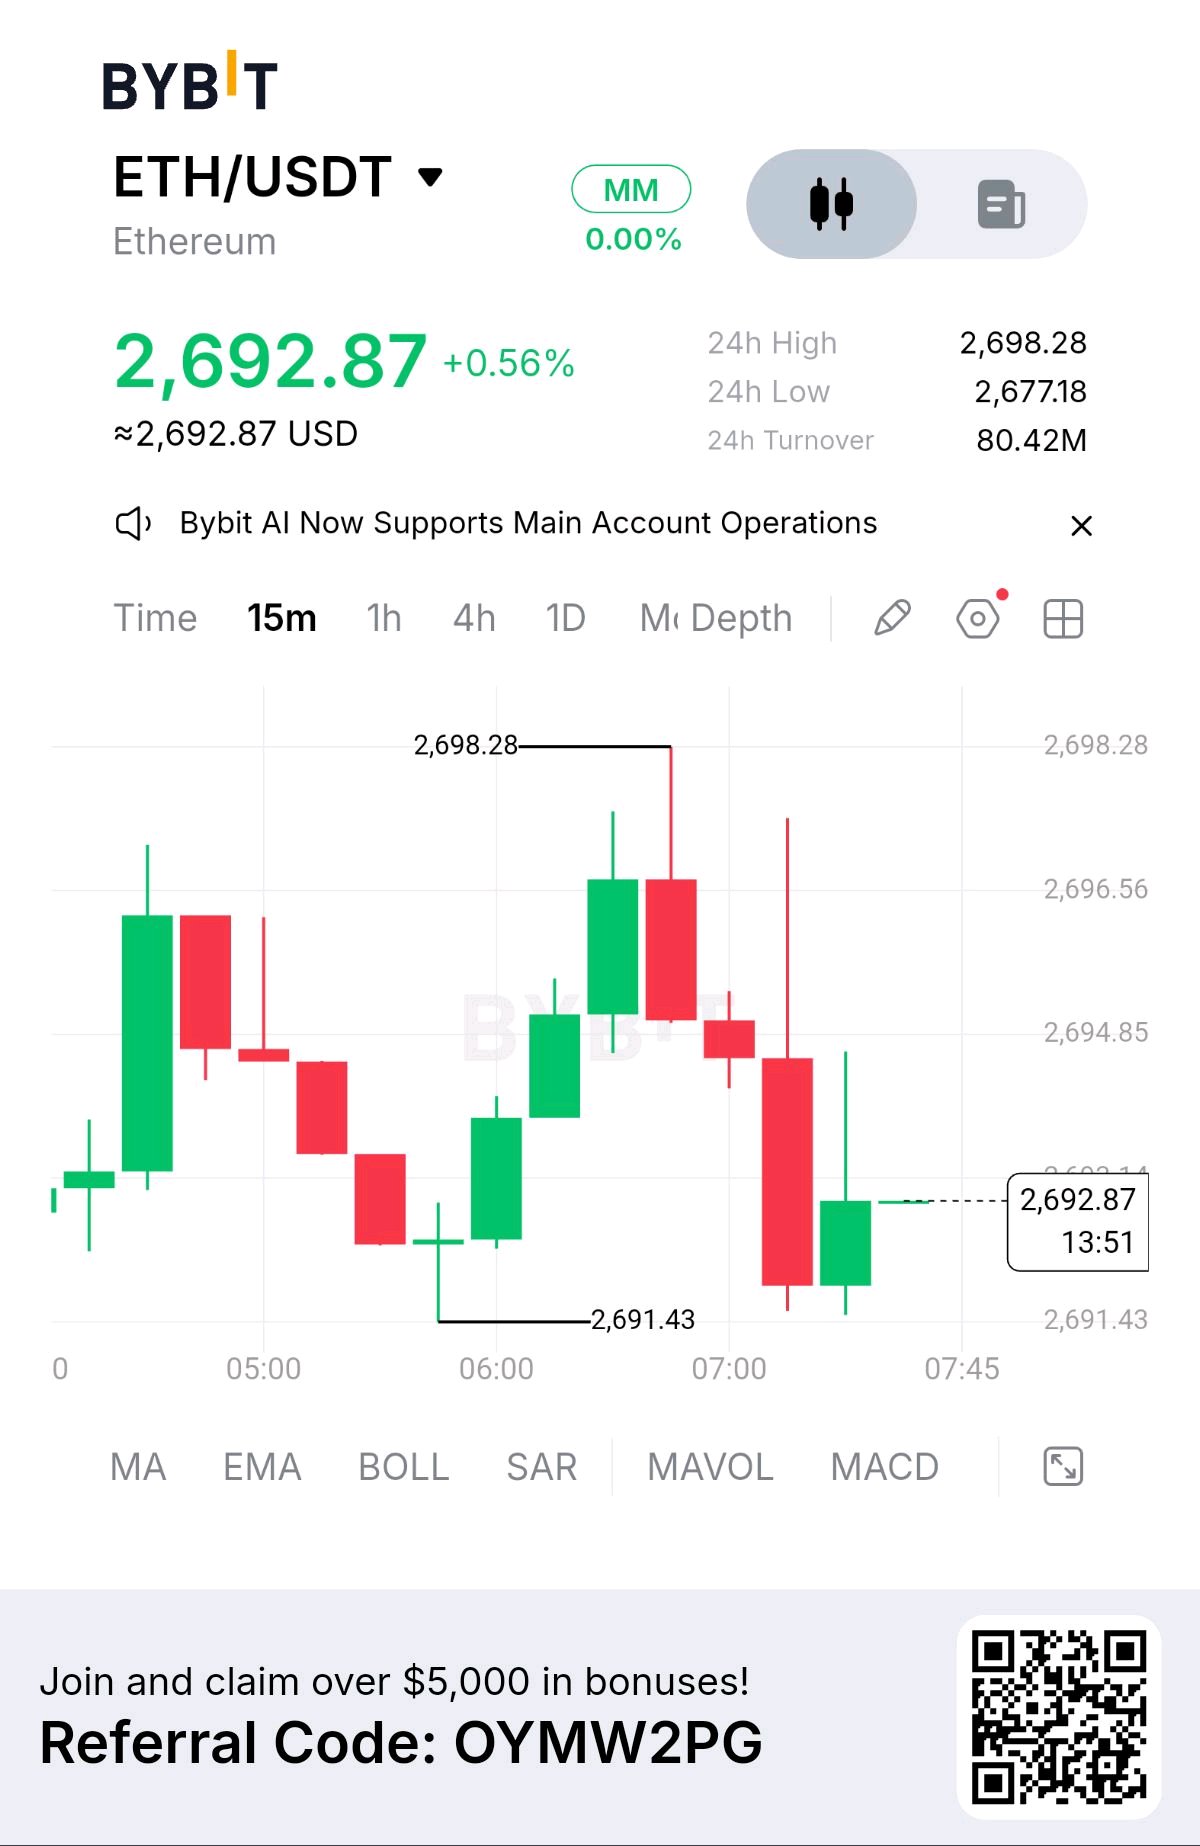
BTC is showing stronger short-term momentum, trading near 84,966.8 after recovering from 84,791.8, while ETH is holding around 2,692.87 after bouncing from 2,691.43. BTC is approaching the 85,060.8 resistance, where a clean breakout could strengthen the bullish structure. ETH, meanwhile, remains trapped between 2,691.43 support and 2,698.28 resistance, making its next breakout important. Both charts show buyers attempting to maintain control, but resistance remains close. The next few 15-minute candles could determine whether this recovery develops into a stronger move or turns into another rejection. Which one looks stronger to you right now — BTC or ETH? #ByXIMPACT $BTCUSDT $ETHUSDT
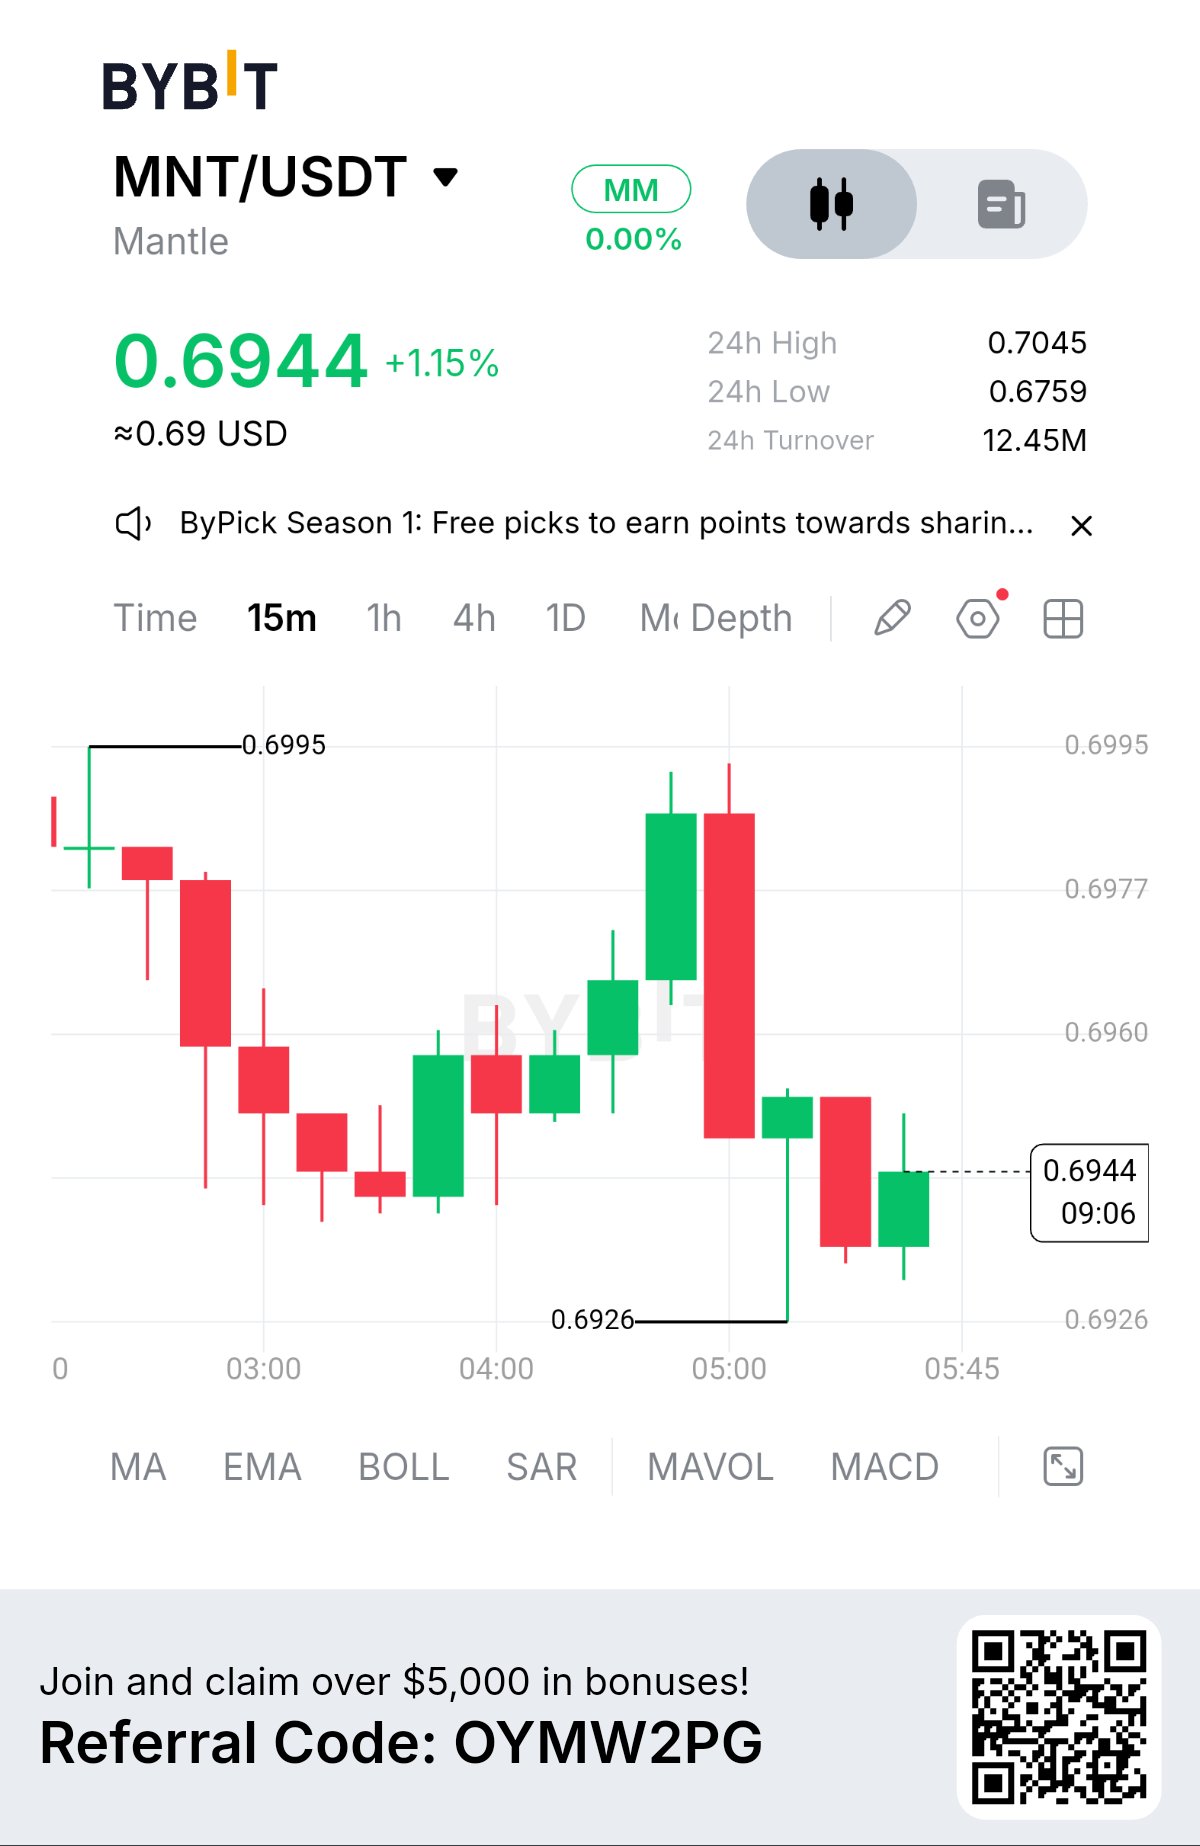
MNT RETESTS 0.6926: BOUNCE OR BREAKDOWN?
$MNTUSDT is trading at 0.6944, up 1.15% over the past 24 hours. Price has traded between 0.6759 and 0.7045, with 12.45M USDT in 24-hour turnover. On the 15-minute chart, MNT is showing signs of short-term weakness after being rejected near the 0.6995–0.7000 zone. Price pushed higher with strong momentum before sellers stepped in, producing a sharp bearish candle that erased part of the previous move. The pullback has now brought price back toward the key 0.6926 support. The important question is whether buyers can defend this level. Key levels Resistance: 0.6977 → 0.6995 → 0.7000 Support: 0.6926 → 0.6900 Bullish scenario If MNT holds 0.6926 and reclaims 0.6977, buyers could regain short-term control and challenge the 0.6995–0.7000 resistance zone. Bearish scenario A clean break below 0.6926 would weaken the structure further and could expose 0.6900 as the next area to watch. For now, MNT is sitting at an important decision zone. The reaction around 0.6926 may provide the clearest signal for the next short-term move. Will buyers defend 0.6926, or is MNT preparing for a deeper pullback? #ByXIMPACT #BybitOdds $BTCUSDT