Kaizo
Crypto Researcher | Web3 Analyst Market insights • On-chain data • Emerging narratives Research. Analyze. Share. 📊
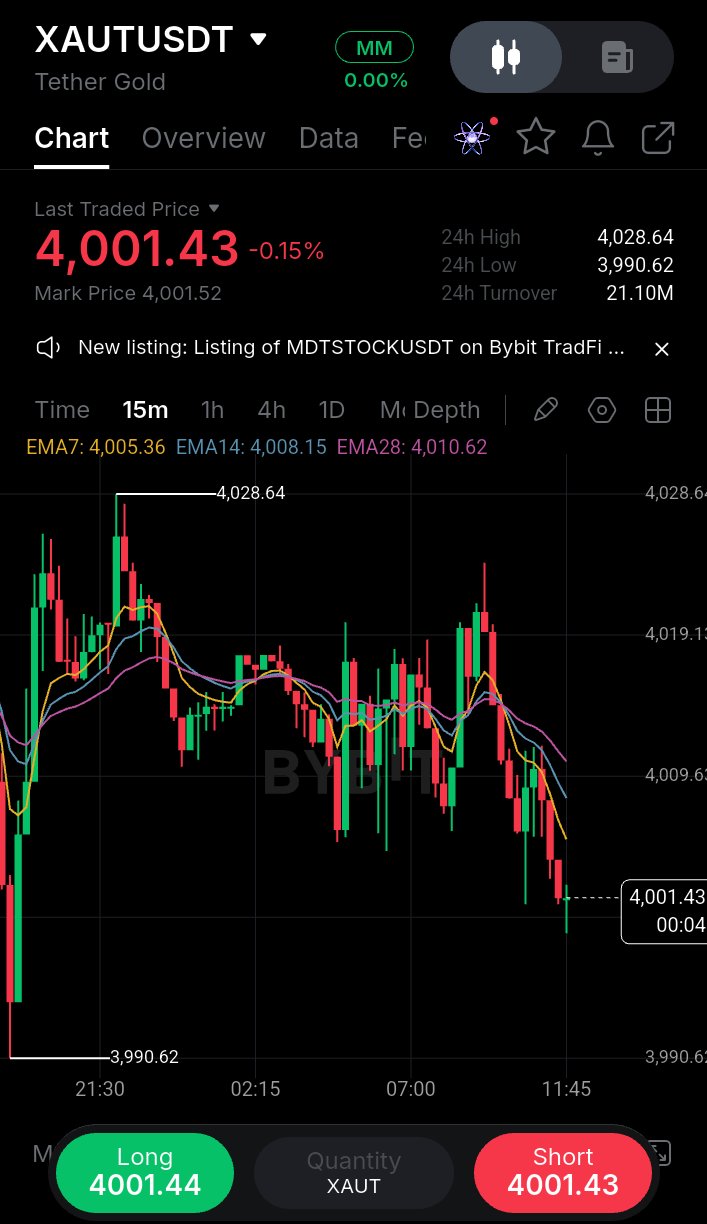
Gold bulls are losing their grip as XAUT slips below key moving averages, putting the $3,990 support zone in the spotlight. The next price reaction could reveal whether sellers have more room to push or buyers are ready to fight back. Trading around $4,001.43, XAUT has slipped below all three moving averages, putting immediate pressure on the bullish side. 📊 EMA Structure - EMA 7: $4,005.36 - EMA 14: $4,008.15 - EMA 28: $4,010.62 With price trading beneath these levels, the moving averages may now act as dynamic resistance. The recent price action also indicates that sellers currently have the advantage. 🔍 The Level That Matters Most $3,990.62 is the key support visible on this chart. A decisive breakdown below this area could open the door to further downside, while a successful defense may trigger a short-term relief bounce. For recovery, bulls first need to reclaim the $4,005–$4,011 zone. Holding above that cluster would be an early sign of improving momentum, although stronger confirmation would still be needed. ⚖️ Two Possible Scenarios 🔴 Bearish case: Rejection beneath the EMA cluster followed by a break of $3,990.62 could extend selling pressure. 🟢 Bullish case: Support holds, price forms a stronger base, and buyers reclaim the moving averages. That would improve the short-term recovery outlook. My takeaway: The current structure favors caution rather than blindly buying the dip. Watch how price reacts at support and wait for confirmation before choosing a direction. 💬 Will buyers defend $3,990.62, or will sellers drag gold lower? $XAUTUSDT $BTCUSDT #WSOT2026 #AnthropicS1Filing #IMPACTbyTrade #MyByXTake #ByXIMPACT

TSLA: Bulls Are Testing the Next Big Wall
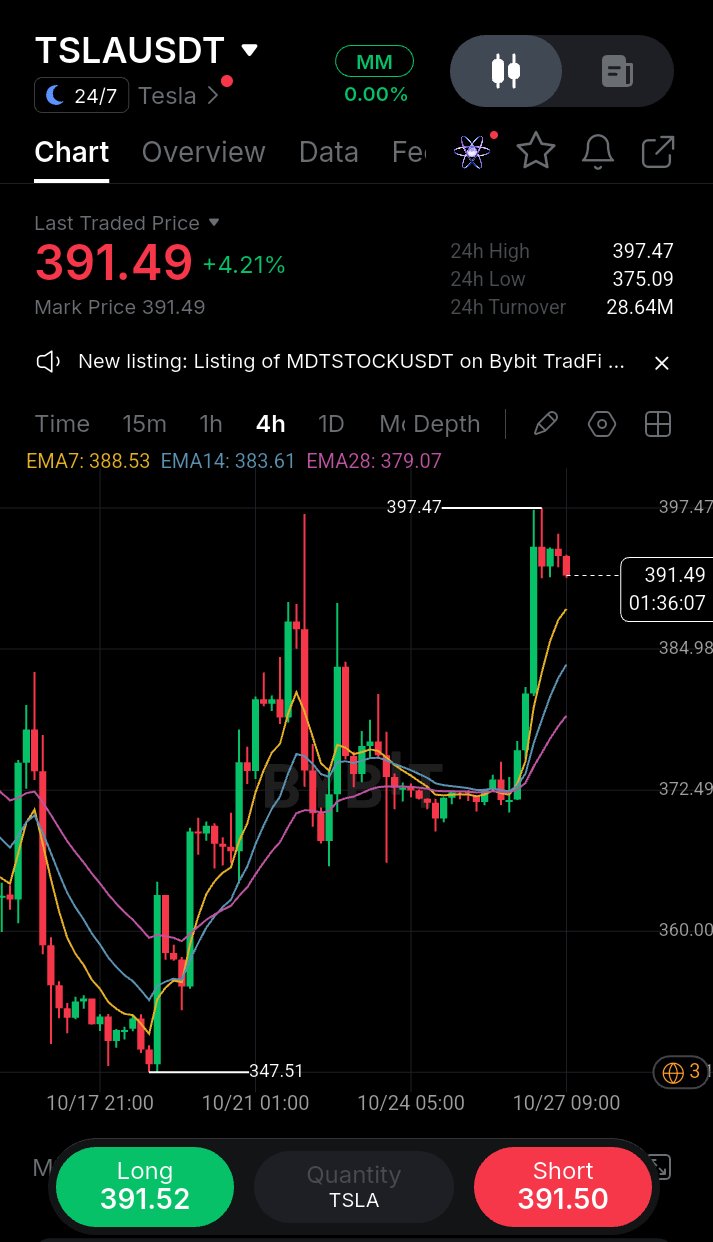
Tesla is making a statement on the 4-hour chart. After spending several sessions struggling around the $370–$373 region, TSLAUSDT has finally broken out with a powerful upward move, pushing the price to $391.49 and recording a gain of approximately 4.21%. But here is where the real battle begins: Can buyers turn this breakout into a sustained rally, or will the $397.47 resistance zone trigger another round of profit-taking? The structure is becoming increasingly interesting. Price has climbed above all three exponential moving averages, with EMA7 at $388.53, EMA14 at $383.61, and EMA28 at $379.07. Their bullish alignment suggests that buyers currently have the short-term advantage. What makes this move particularly notable is the transition from sideways trading to aggressive upside momentum. Instead of gradually grinding higher, price accelerated through resistance, suggesting that buying pressure increased significantly during the breakout. Now, the market needs to prove that this strength can hold. If TSLAUSDT maintains support above $388–$389, buyers may attempt another push toward $397.47. A convincing 4-hour close above that high could open the door toward the $400 psychological level, followed by the $405 area if momentum continues. However, a rejection near $397.47 should not be ignored. After such a sharp rally, a pullback toward $384 or even $379 would not automatically destroy the bullish structure. These areas could become important for determining whether the breakout has genuine staying power. 📍 Levels shaping the next move Current price: $391.49 Immediate resistance: $397.47 Breakout objective: $400.00 Extended upside area: $405.00 First support: $388.50 Secondary support: $383.60 Trend support: $379.00 For a potential LONG, I would prefer to see price hold the $388–$390 area and produce fresh bullish confirmation rather than chase the existing rally. 🚀 Entry: $389.00–$391.00 after confirmation 🎯 TP1: $397.00 🎯 TP2: $400.00 🎯 TP3: $405.00 🔴 SL: $384.00 These are conditional technical levels, not guaranteed outcomes. If price loses support and selling pressure increases, the bullish setup may need to be reconsidered. My focus right now is not simply on how much TSLAUSDT has already gained. It is on what happens when the price challenges $397.47 again. Strong acceptance above resistance would tell a very different story from another rejection followed by a move beneath the short-term averages. The breakout has caught attention. The next confirmation will determine whether it deserves continuation. Stay patient, respect the levels, and never let a strong green candle replace a proper trading plan. $TSLAXUSDT #WSOT2026 #AnthropicS1Filing #IMPACTbyTrade #MyByXTake #ByXIMPACT

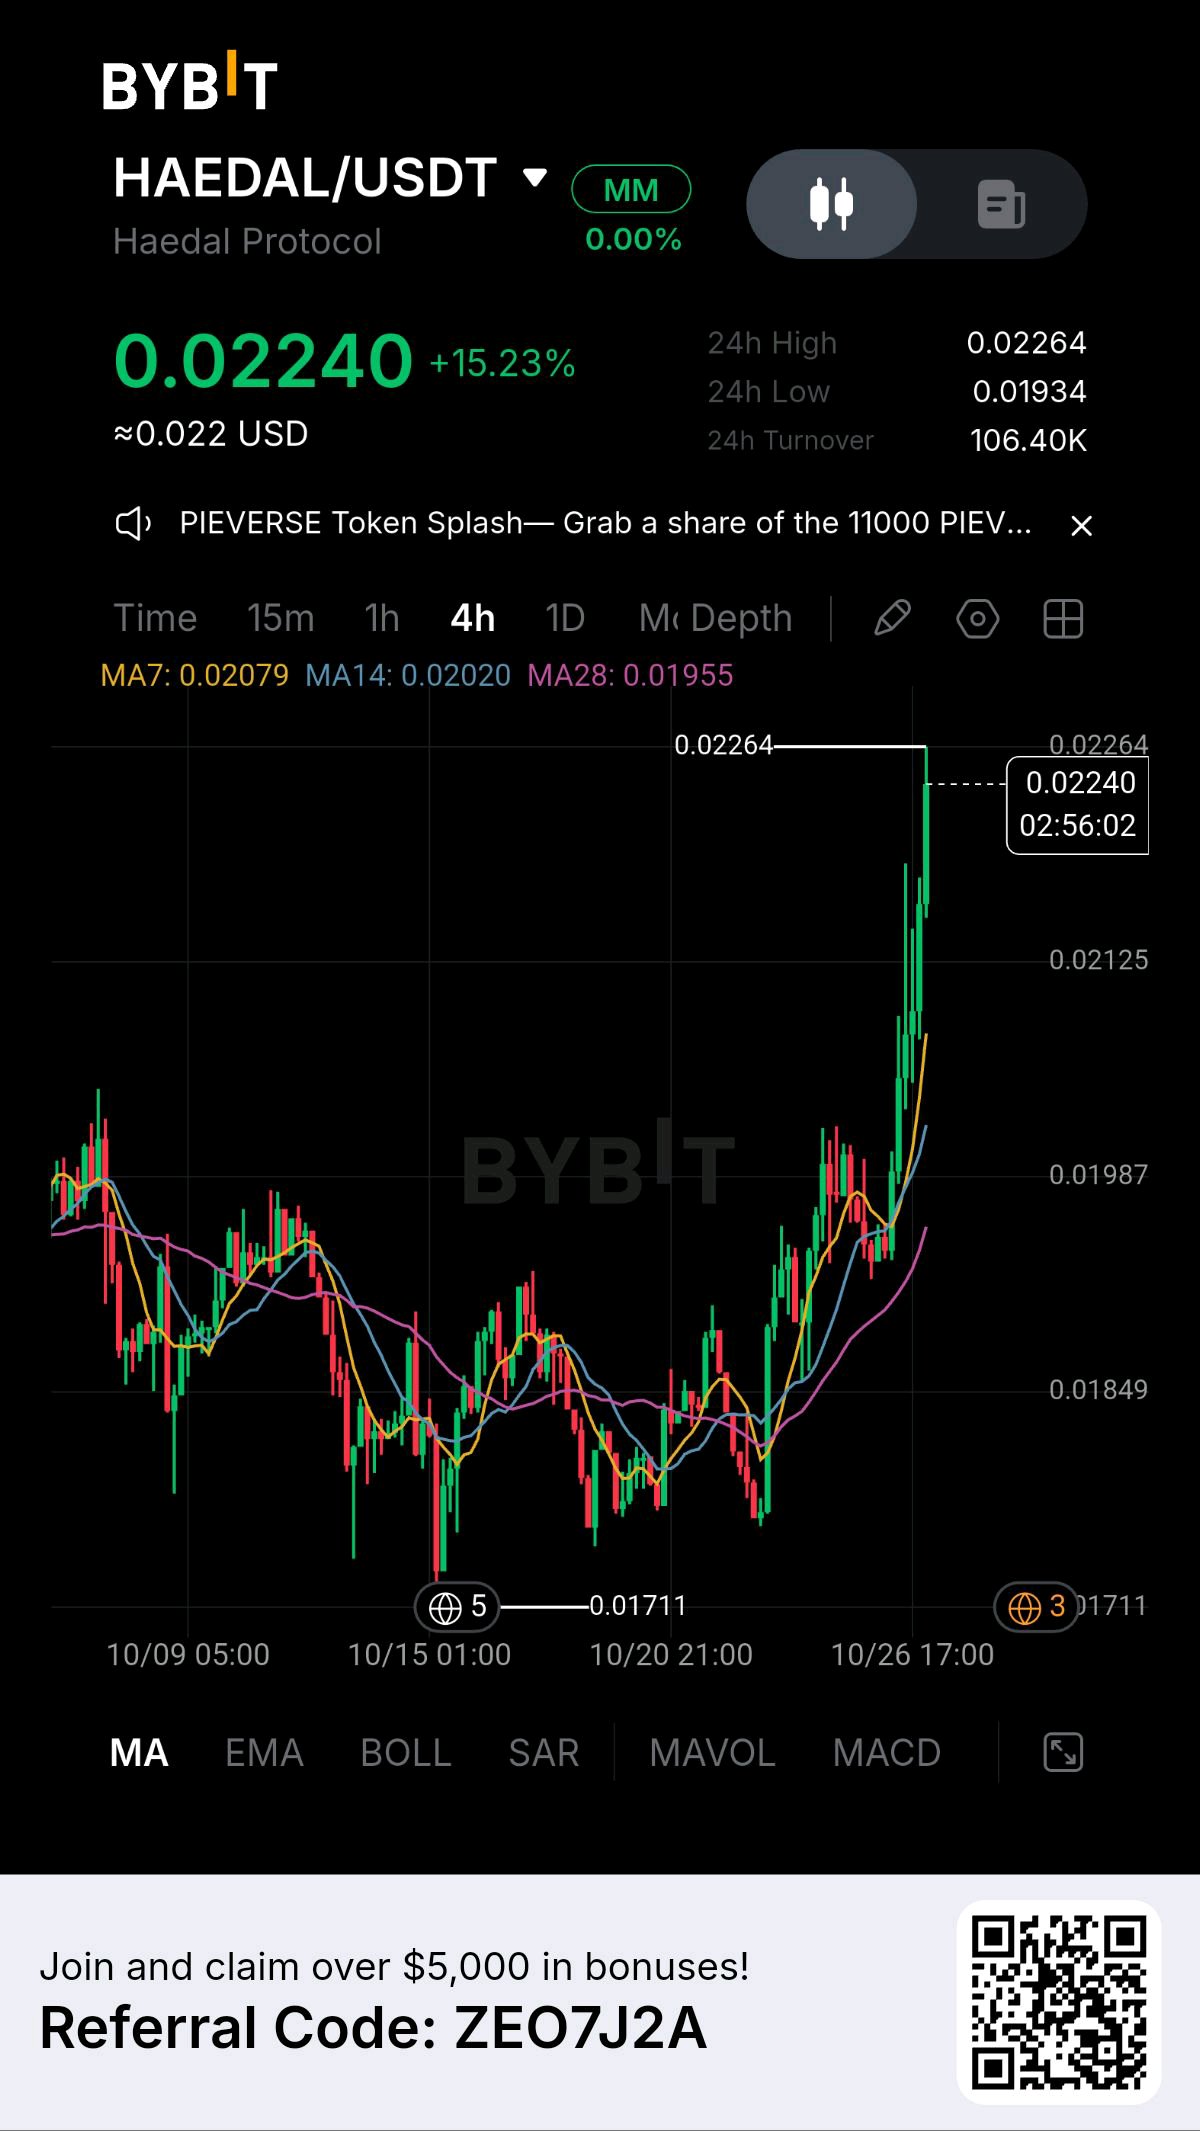
HAEDAL has unleashed a powerful parabolic expansion, surging to 0.02240 (+15.23%) on the 4H timeframe as strong buy-side momentum shatters localized range boundaries. Following an extended structural accumulation phase above the 0.01711 floor, intense order flow catalyzed a steep upside rally toward a fresh 24h peak of 0.02264. Price action has completely detached above the expanding 4H moving average stack—MA7 (0.02079), MA14 (0.02020), and MA28 (0.01955)—confirming a major trend acceleration. Backed by 106.40K in 24h turnover, HAEDAL is priming for a brief consolidation or continuation expansion into higher overhead liquidity targets. TRADE PARAMETERS Pair: HAEDAL/USDT (4H Timeframe) Bias: Bullish Momentum Breakout / Trend Continuation Buy Zone: 0.02100 to 0.02220 Stop Loss: 0.01940 (4H close below 4H MA28 support baseline at 0.01955) PROFIT TARGETS Target 1: 0.02260 (Sweep of the 0.02264 24h peak high for immediate risk locking) Target 2: 0.02450 (Mid-term structural expansion target) Target 3: 0.02700 (Full macro breakout expansion) TECHNICAL CONFLUENCES * Strong Parabolic Expansion Off Floor Price executed a vertical recovery from the multi-week low of 0.01711, signaling strong aggressive buyer dominance and complete market structure control. * Perfect Bullish Moving Average Alignment The 4H MA7 (0.02079), MA14 (0.02020), and MA28 (0.01955) are cleanly stacked in a steep bullish slope, establishing strong dynamic trailing support. * Sustained Buyer Demand & Volume Turnover Supported by a massive +15.23% daily gain and 106.40K in 24h turnover, buyer participation remains heavily active with zero sell-side absorption so far. RISK & EXECUTION PLAN Look for execution opportunities within the defined buy zone on minor lower-timeframe pullbacks. As soon as Target 1 is cleared, harvest initial partial profits immediately and shift the Stop Loss straight to entry price to secure a completely risk-free hold into macro targets. $HAEDALUSDT #WSOT2026 #AnthropicS1Filing #IMPACTbyTrade #MyByXTake #ByXIMPACT
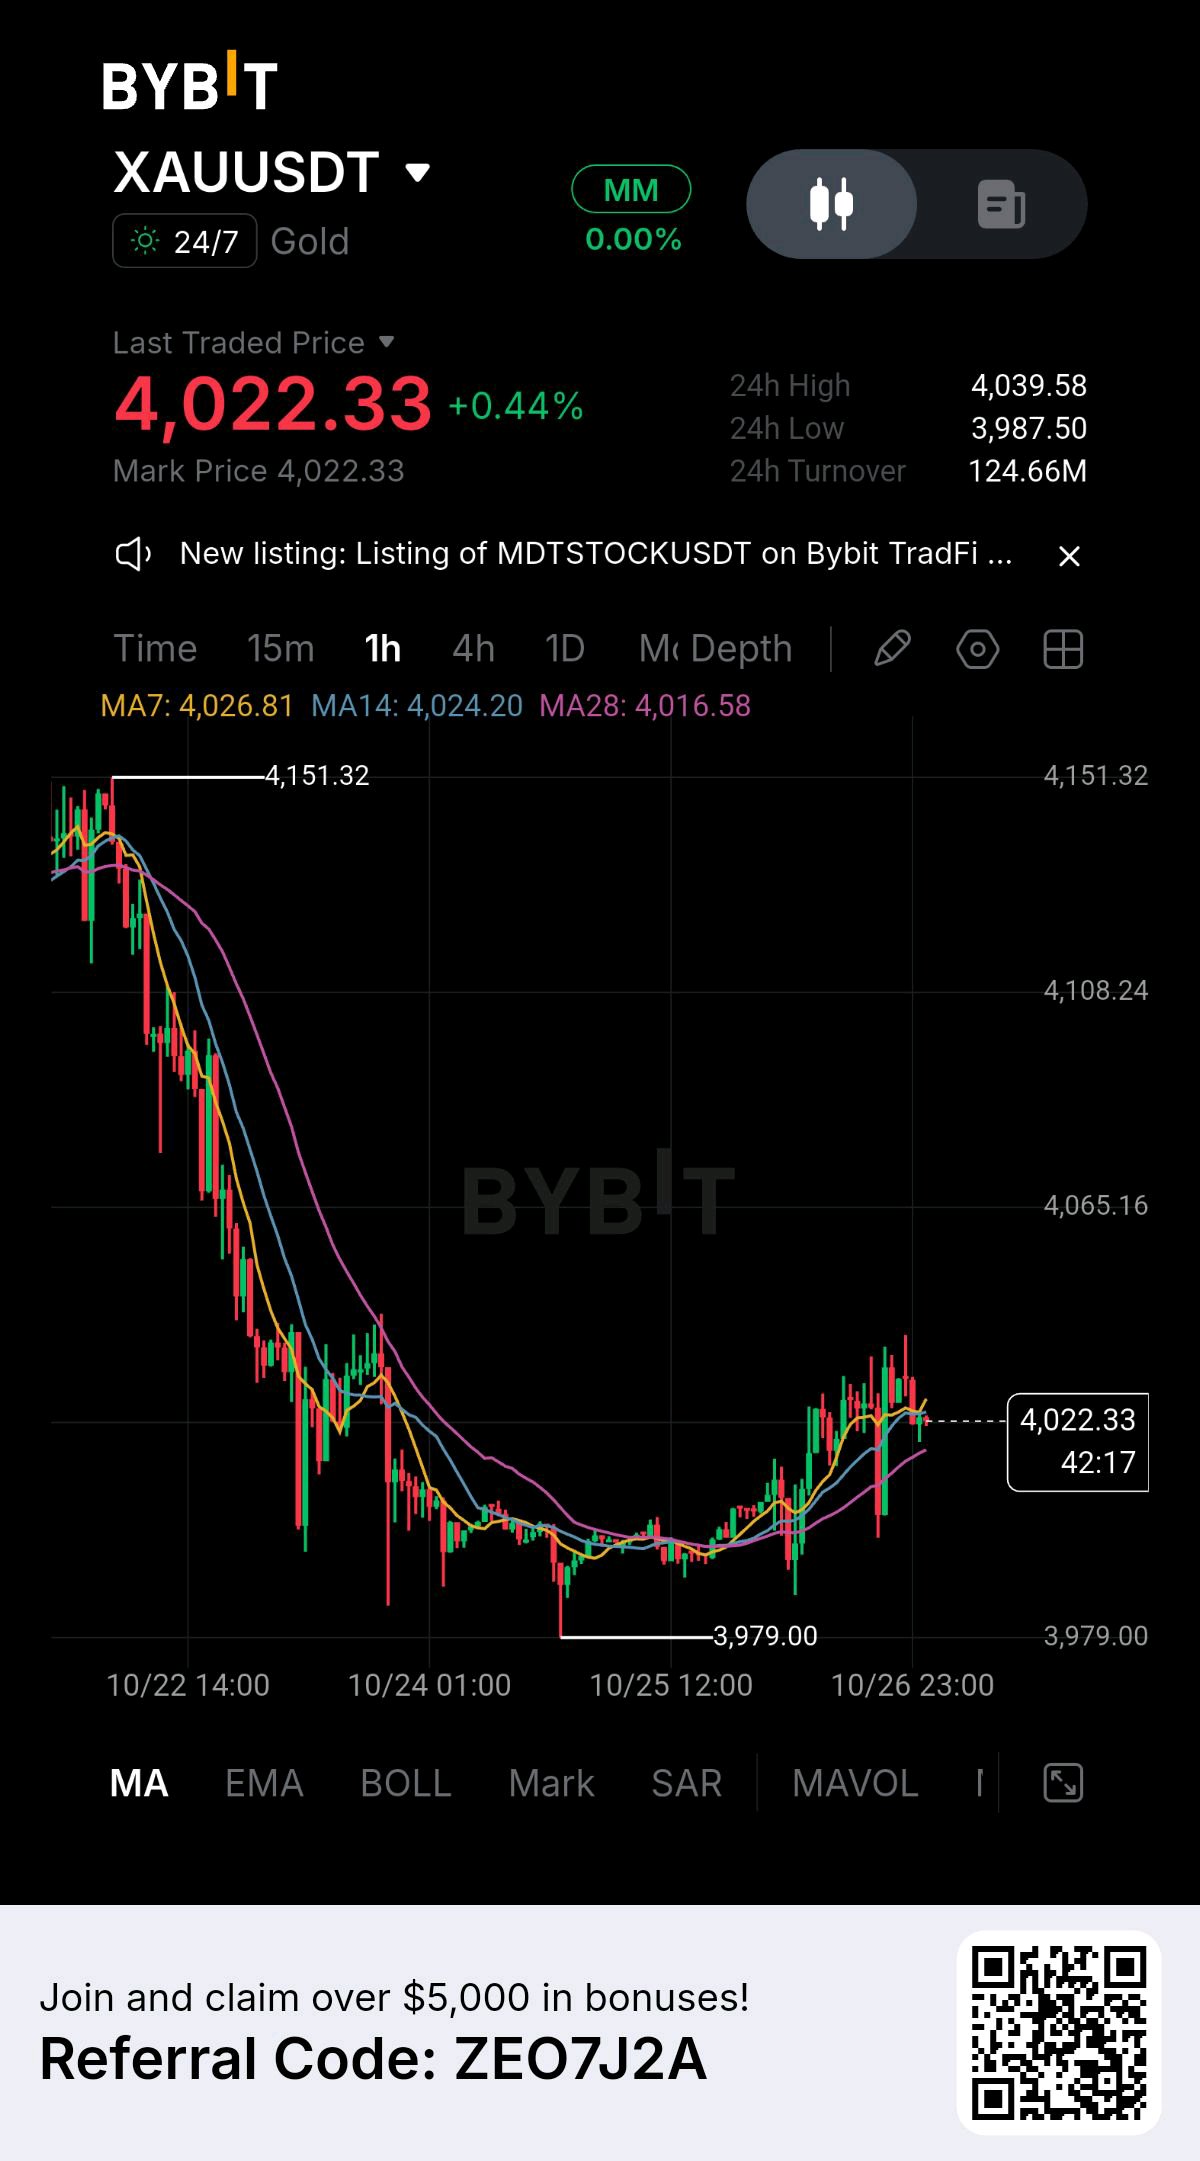
Gold is approaching a critical turning point, and the next move could determine whether the recent recovery develops into a stronger bullish rally or turns into another selling opportunity. XAUUSDT is trading near $4,022.33 after recovering from the $3,979 region. Although the market has gained approximately 0.44%, the more important development is the change in price behavior after the prolonged decline from $4,151.32. For several sessions, sellers maintained control and pushed gold toward lower levels. Now, buyers are attempting to build a base and regain lost ground. The recovery is encouraging, but the market still needs confirmation before a stronger bullish continuation can be expected. 📊 What Is the Market Telling Us? The 1-hour chart shows gold recovering from its recent low and moving back above the MA28 at $4,016.58. However, the price is still trading slightly below MA7 at $4,026.81 and MA14 at $4,024.20. This creates an interesting battle between short-term buyers and sellers. Buyers need to reclaim the $4,025–$4,040 region, while sellers will likely attempt to prevent a breakout. The reaction around this zone matters more than the current percentage change. A strong close above resistance could attract additional buying pressure, while repeated rejection may signal that the recovery is losing strength. 🔥 Bullish Roadmap If gold reclaims $4,040 with a convincing breakout and holds above it on a retest, the next potential levels are: 🎯 $4,055 — First upside objective 🎯 $4,065 — Major resistance zone 🎯 $4,085 — Possible continuation target 🎯 $4,108 — Higher resistance if momentum accelerates These targets are conditional. Buyers must first demonstrate that the market can sustain its move above the immediate resistance zone. 📉 When Could Sellers Return? Failure to hold $4,016 could put the recovery under pressure. If selling accelerates and gold loses the psychological $4,000 level, attention may shift toward $3,987 and the recent low at $3,979. A break below $3,979 would be a significant warning that the current recovery has failed and the broader bearish structure may continue. 📈 Potential LONG Setup 🚀 Entry Zone: $4,018–$4,025, only after bullish confirmation 🎯 TP1: $4,040 🎯 TP2: $4,055 🎯 TP3: $4,065 🔴 SL: $4,005 📉 Potential SHORT Setup 🚀 Entry Zone: $4,010–$4,015 after a confirmed support breakdown and failed retest 🎯 TP1: $4,000 🎯 TP2: $3,987 🎯 TP3: $3,979 🔴 SL: $4,032 These are alternative scenarios, not simultaneous trade recommendations. Wait for the relevant confirmation, and skip the setup if price action does not support it. ⚡ The Strategy From Here The biggest mistake in a market like this is entering simply because the candles are moving quickly. Gold has already experienced a substantial decline followed by a recovery, so both sudden rallies and sharp pullbacks remain possible. Instead of predicting the next candle, focus on three things: how price reacts around $4,040, whether buyers defend $4,016, and whether the market confirms a breakout or breakdown. The broader trend has not yet clearly reversed, but the recent bounce deserves attention. A confirmed breakout could strengthen the bullish case, while a loss of support would bring the bearish scenario back into focus. Keep your entries disciplined, your position size controlled, and your risk defined before entering. In volatile markets, protecting capital is just as important as finding the right direction. $BTCUSDT $SOLUSDT #WSOT2026 #AnthropicS1Filing #IMPACTbyTrade #MyByXTake #ByXIMPACT
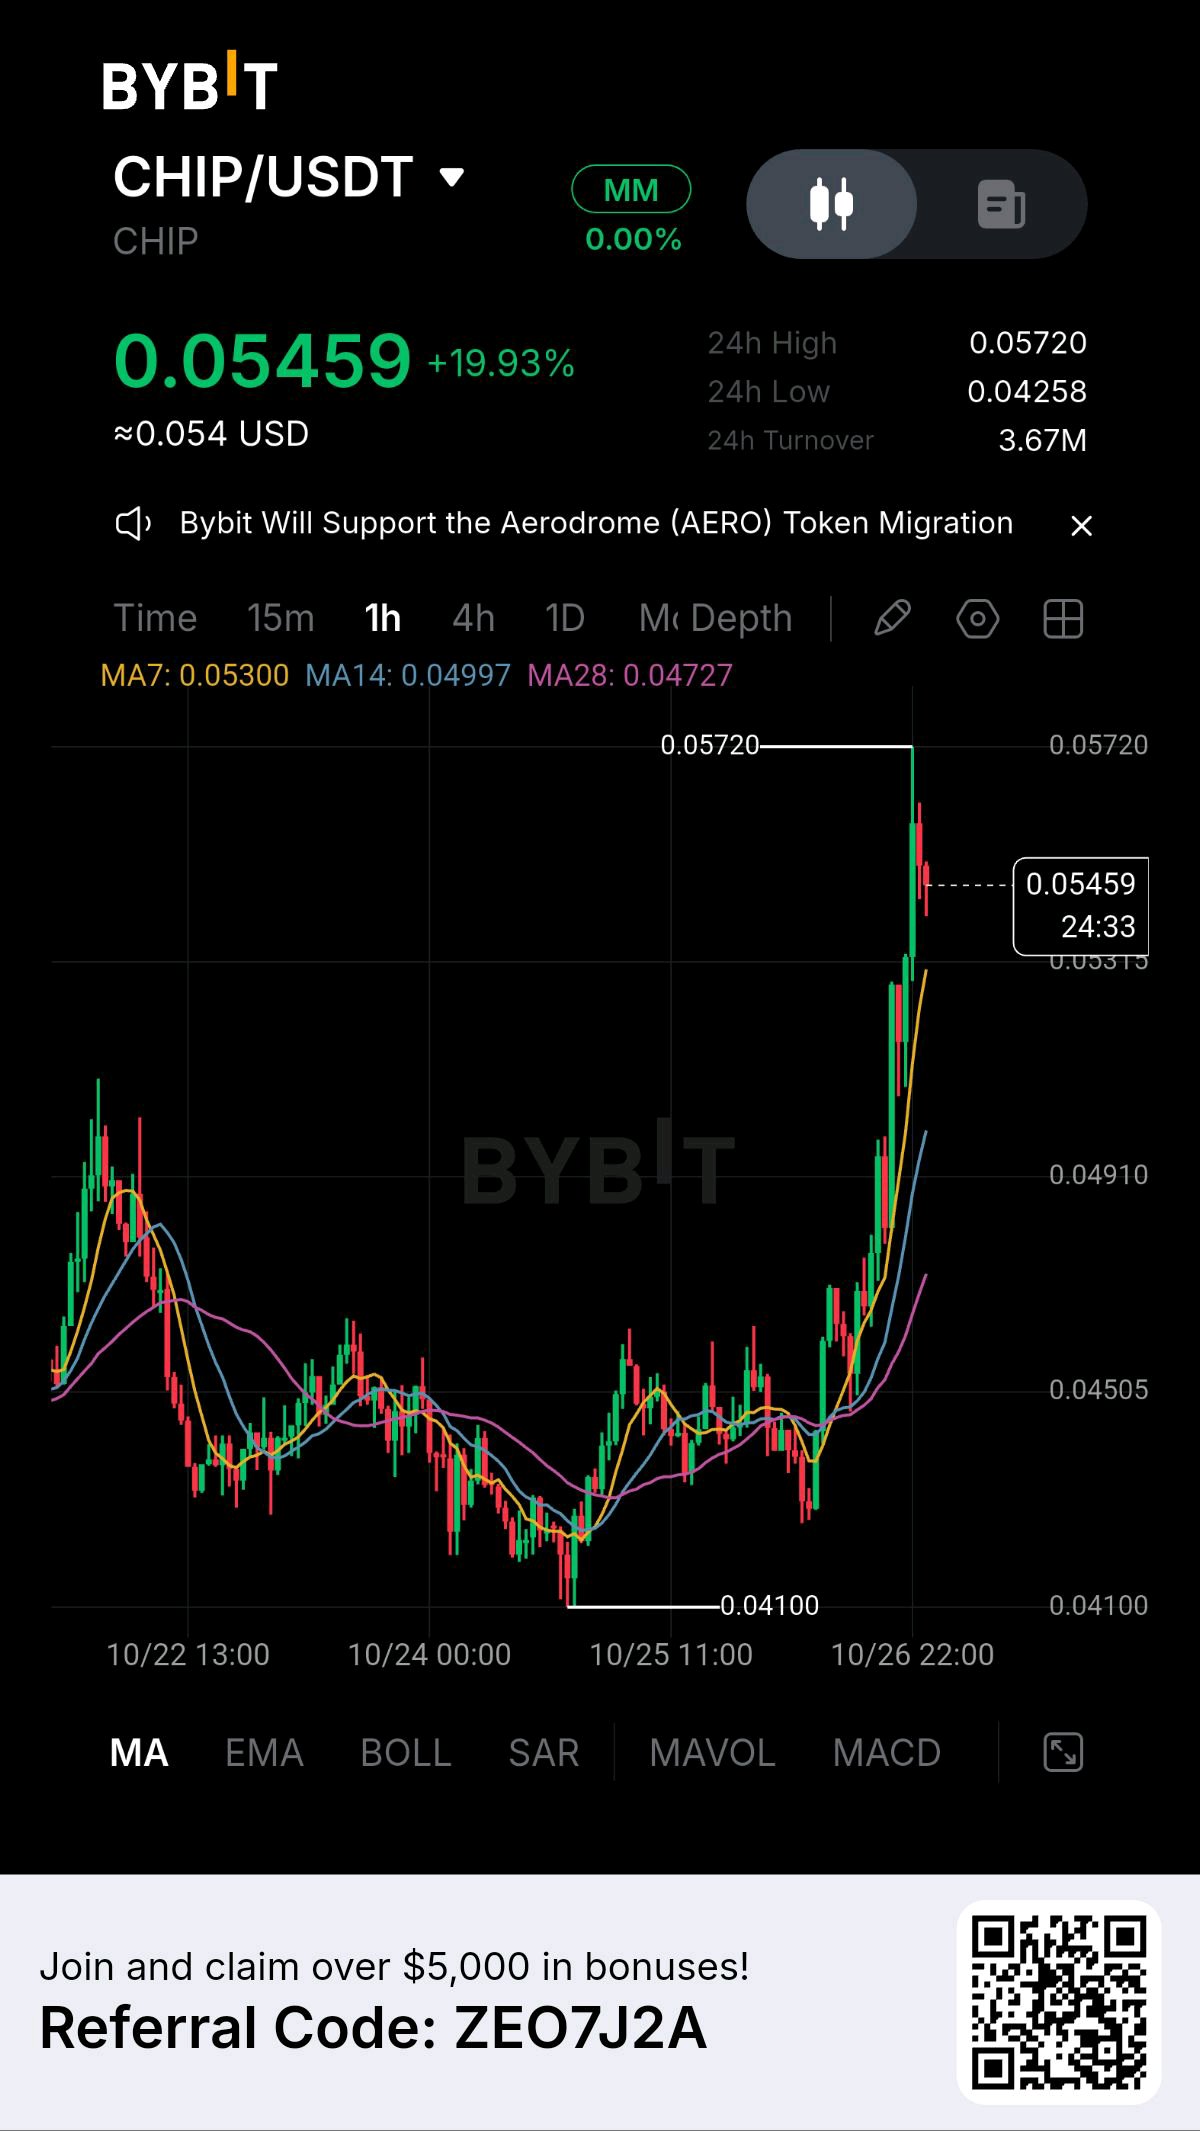
$CHIPUSDT is attracting strong market attention after a powerful breakout on the 1-hour chart. The price is currently trading around $0.05459, up nearly 19.93%, following a sharp rally from the $0.04100–$0.04500 accumulation region. This move suggests that buyers have stepped in aggressively, pushing the token into a new short-term bullish phase. What makes this move interesting is the strength of the breakout. CHIP spent several sessions moving sideways before bullish momentum accelerated and price surged toward $0.05720. However, after reaching this high, the market experienced a pullback, indicating that some traders may be taking profits while buyers attempt to establish a new support zone. 📊 Market Structure & Momentum The current price remains above all three moving averages: 🟡 MA7: $0.05300 🔵 MA14: $0.04997 🟣 MA28: $0.04727 This alignment reflects strong short-term momentum, with the fastest moving average positioned above the slower averages. As long as the price holds above the immediate support region, the bullish structure may remain intact. At the same time, the sharp vertical rally increases the risk of volatility. A healthy consolidation or retest could provide a more sustainable foundation for another upward move. 🎯 Key Levels to Watch The first important resistance is $0.05720, the recent high shown on the chart. A convincing breakout above this level could open the way toward $0.05900 and potentially $0.06100 if buying pressure continues. On the downside, $0.05300 is the first level to monitor, followed by $0.05000. The $0.04727 region is another important reference near MA28, while the previous base around $0.04500 may become relevant if the correction deepens. 📈 Potential Trading Setup — LONG 🚀 Entry Zone: $0.05280–$0.05400 🎯 TP1: $0.05600 🎯 TP2: $0.05720 🎯 TP3: $0.05900 🔴 SL: $0.05080 The preferred approach is to wait for the price to stabilize around the entry zone and look for bullish confirmation before considering a position. A clean breakout above $0.05720 with a successful retest would offer a separate momentum-based scenario, although entering after an extended pump can carry additional risk. ⚠️ What Could Change the Setup? If CHIP loses $0.05300 and fails to recover it, short-term momentum could weaken. A deeper move below $0.05000 would increase the possibility of a larger retracement toward the lower moving averages. Conversely, if buyers defend support and volume remains strong, the token could attempt another test of its recent high. 💡 Final Outlook CHIP/USDT has delivered an impressive move, but the next phase will depend on whether buyers can turn the breakout into sustainable support. The overall short-term structure remains bullish, yet chasing the price after a nearly 20% rise is not always the best strategy. Patience is key. Watch the support zones, wait for confirmation, and manage risk carefully. The goal is not simply to catch a fast move, but to identify a setup where the potential reward justifies the risk. Trade with discipline, protect your capital, and let the price action confirm the next opportunity. #WSOT2026 #AnthropicS1Filing #IMPACTbyTrade #MyByXTake #ByXIMPACT
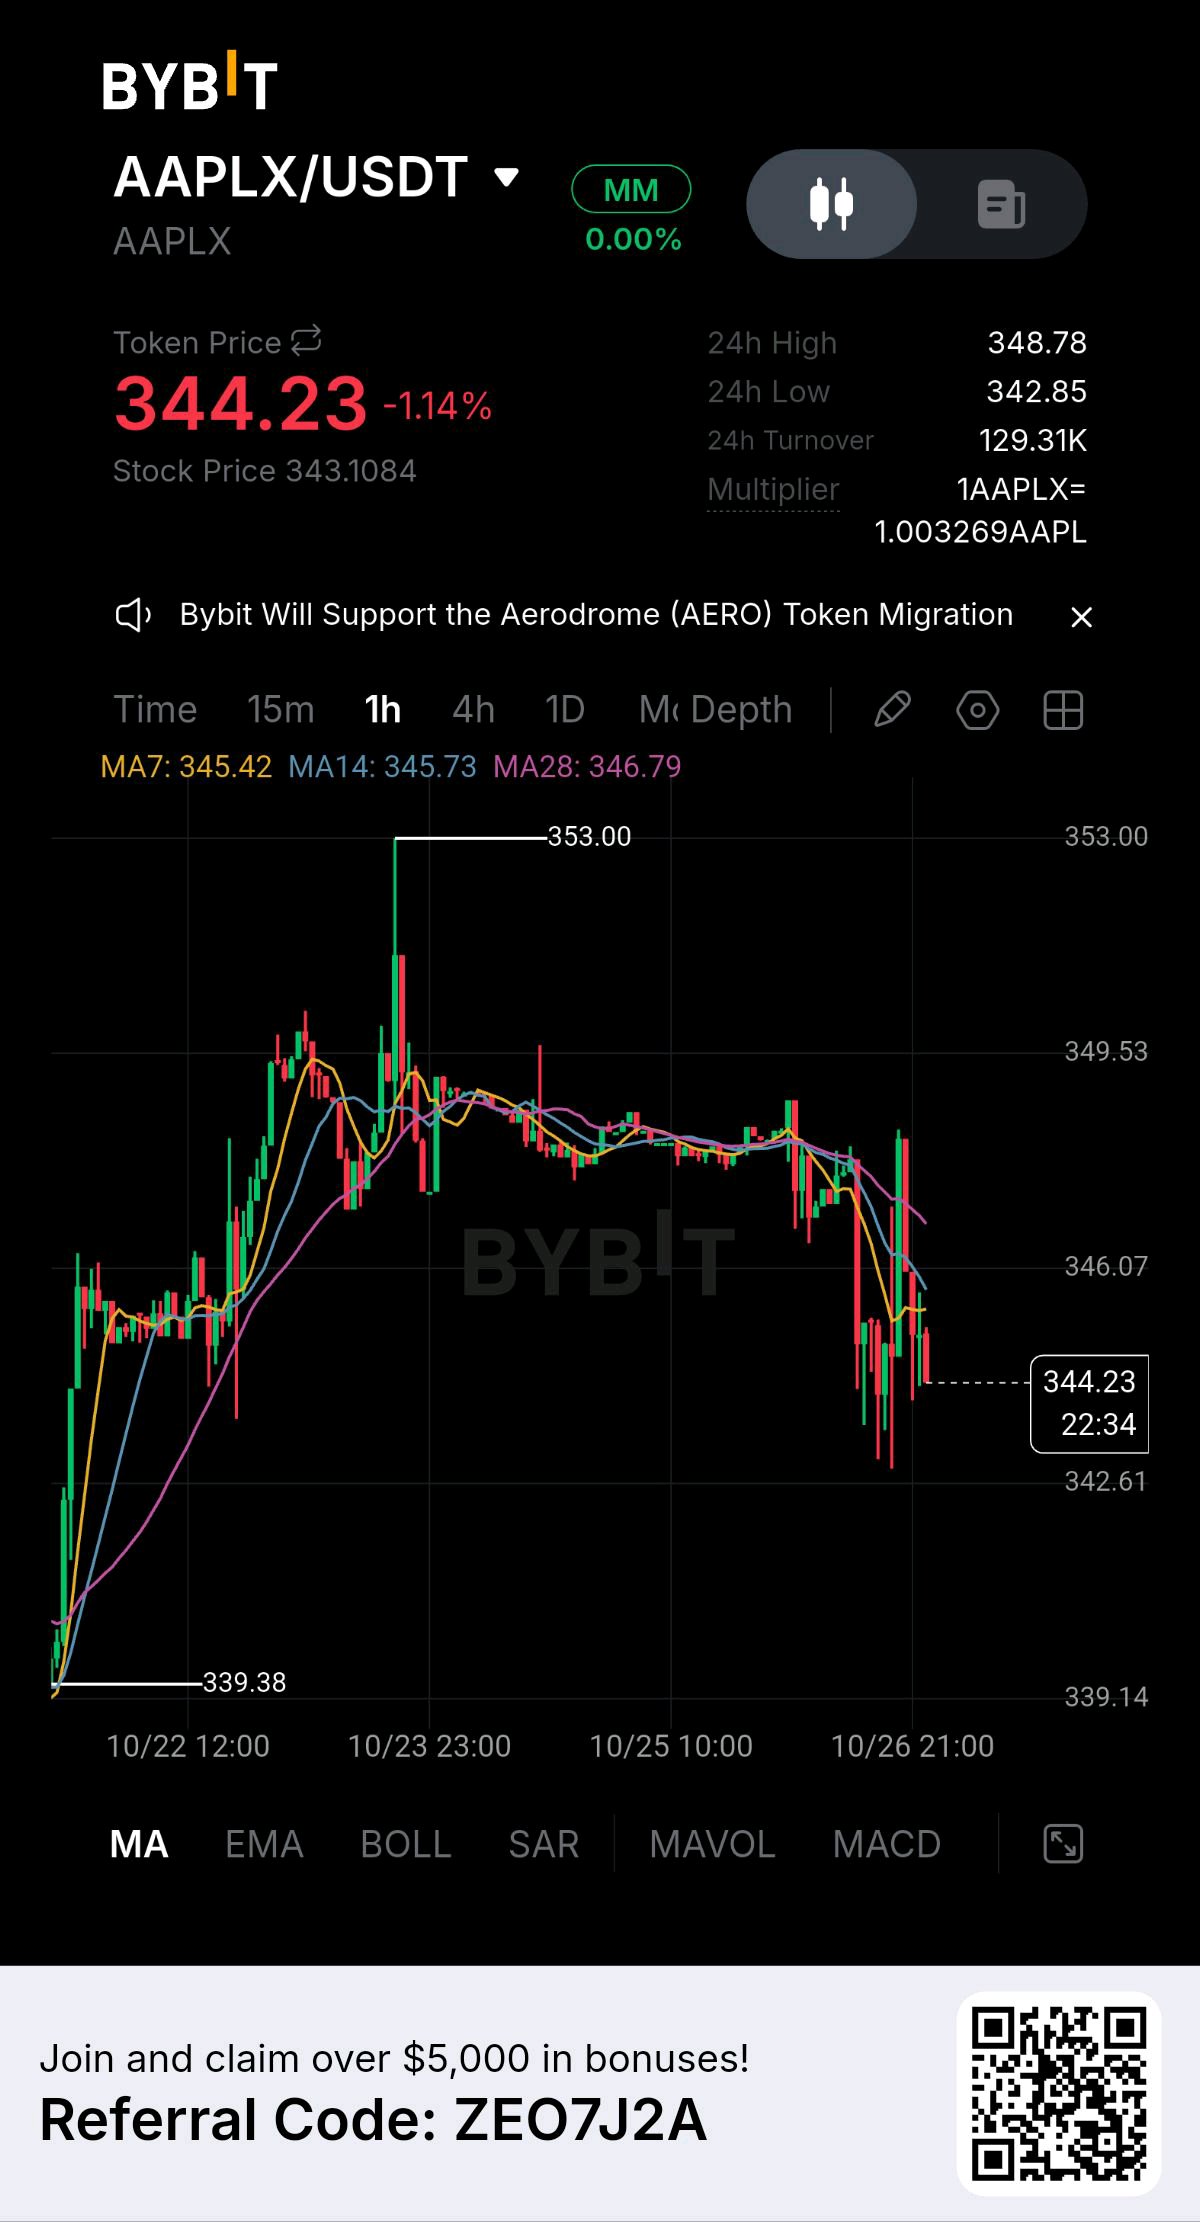
AAPLX is undergoing a controlled corrective retracement, pulling back to 344.23 (-1.14%) on the 1h timeframe as profit-taking emerges following the recent push toward the 353.00 macro swing peak. After dipping to test an intraday low of 342.85, buyers are attempting to establish a local base just below the 1h moving average cluster—MA7 (345.42), MA14 (345.73), and MA28 (346.79). Supported by 129.31K in 24h turnover and a stock reference price of 343.10, this orderly pullback positions the asset for a potential mean-reversion bounce once immediate overhead supply is absorbed. TRADE PARAMETERS Pair: AAPLX/USDT (1h Timeframe) Bias: Bearish Retracement / Potential Support Rebound Buy Zone: 341.00 to 344.50 Stop Loss: 338.50 (1h close below local structural demand floor at 339.38) PROFIT TARGETS Target 1: 346.80 (Reclamation of 1h MA28 baseline for initial risk neutralization) Target 2: 349.50 (Mid-range structural resistance test) Target 3: 353.00 (Full liquidity sweep of the 353.00 macro peak high) TECHNICAL CONFLUENCES * Tight Moving Average Compression The 1h MA7 (345.42), MA14 (345.73), and MA28 (346.79) are tightly aligned directly overhead, acting as a dynamic resistance ribbon that price must reclaim to resume the uptrend. * Controlled Pullback From Peak Resistance The retreat from the 353.00 high exhibits orderly corrective characteristics rather than impulsive selling, preserving the broader multi-day structural base originating near 339.38. * Steady Intraday Liquidity Backed by 129.31K in 24h turnover, market participation remains active as buyers scout for optimal value entries near the lower range boundary. RISK & EXECUTION PLAN Scale into long positions cautiously within the designated buy zone on lower-timeframe stabilization. Once Target 1 is achieved and the moving average stack is reclaimed, secure partial profits immediately and shift the Stop Loss to the entry price for a completely risk-free continuation hold. $AAPLXUSDT #WSOT2026 #AnthropicS1Filing #IMPACTbyTrade #MyByXTake #ByXIMPACT

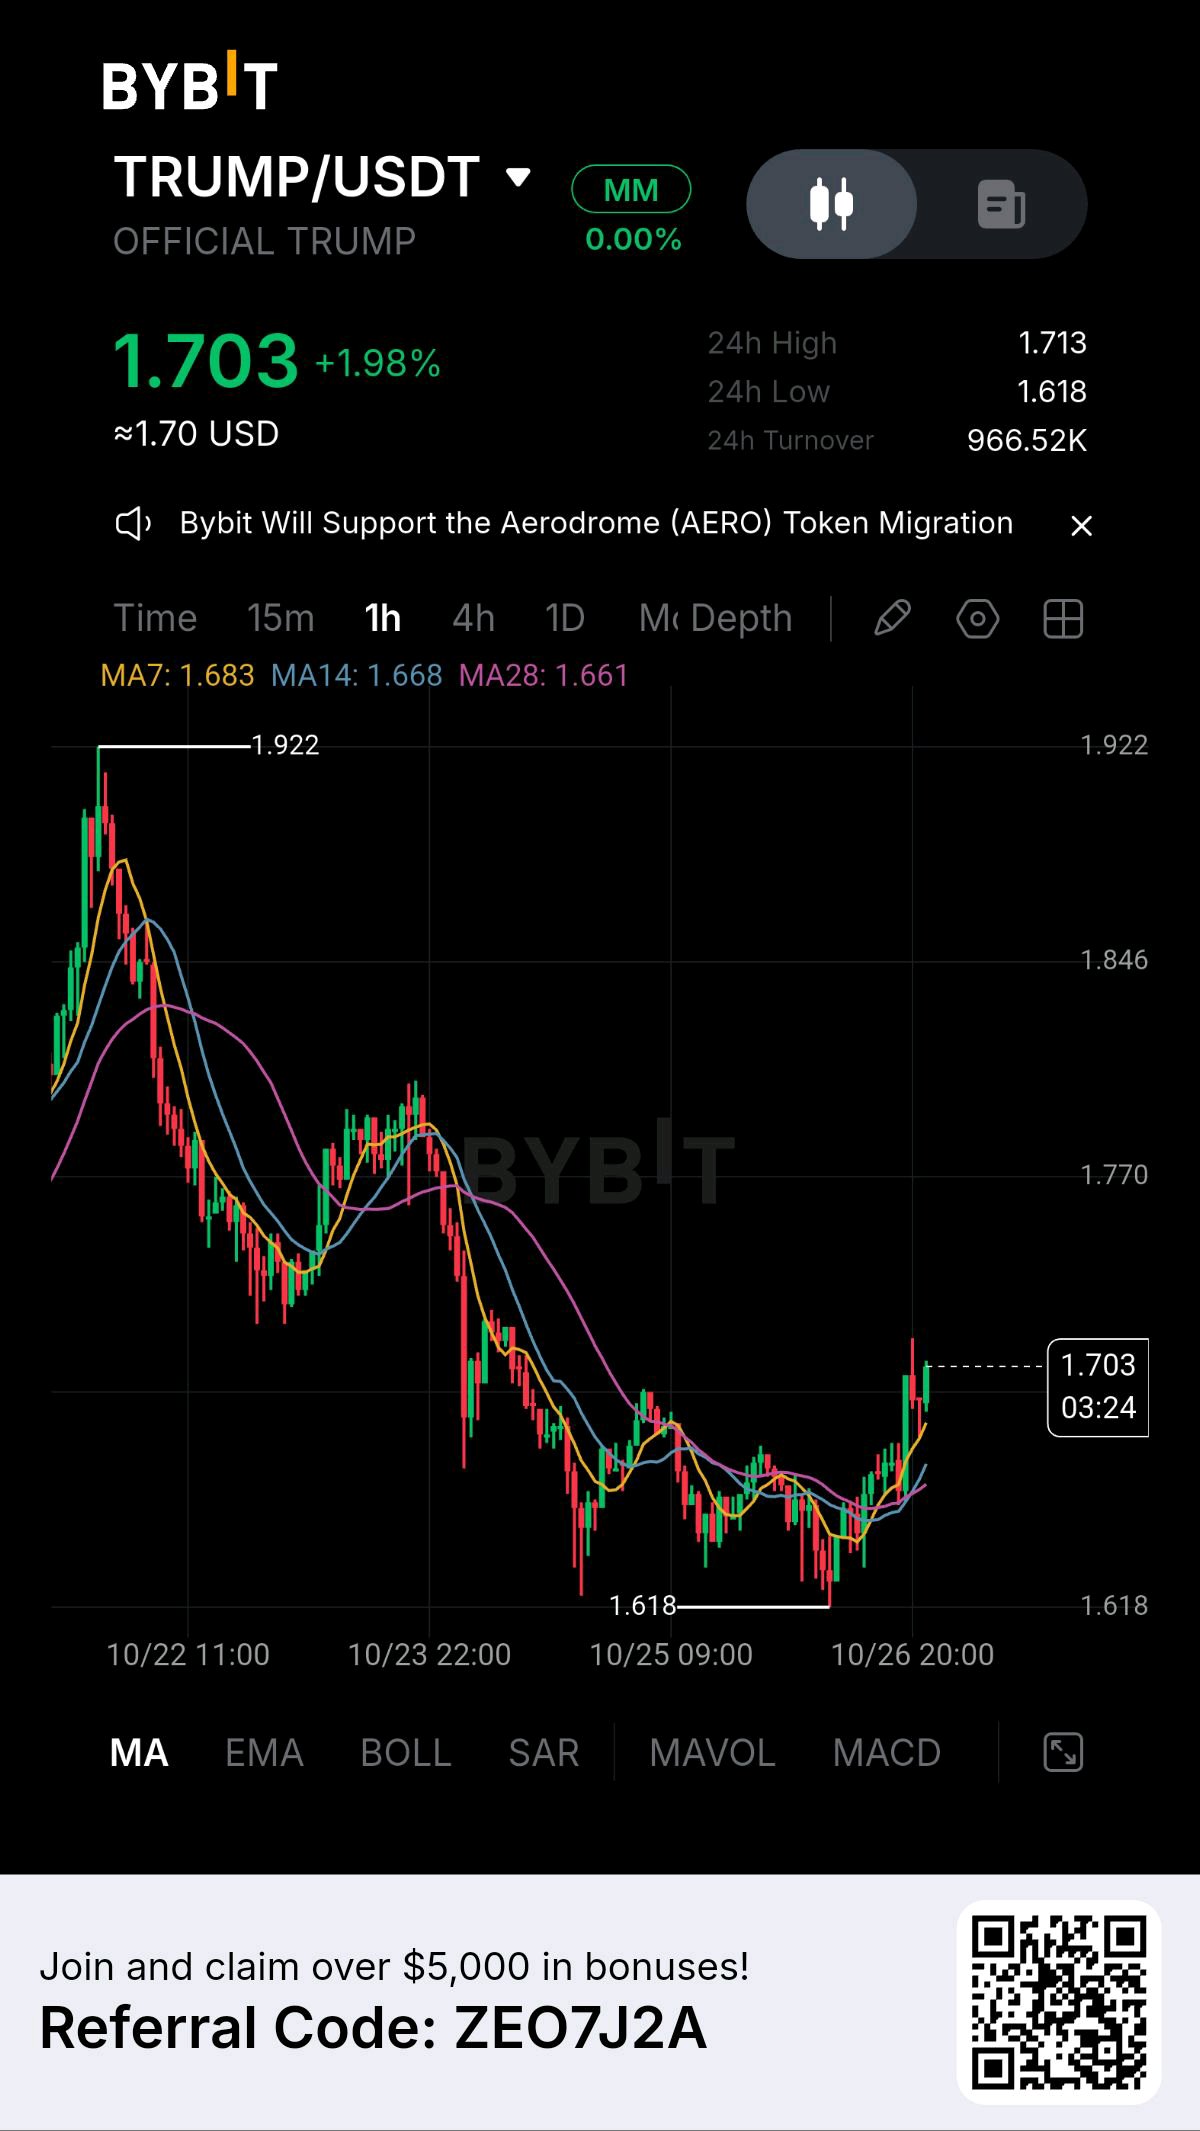
TRUMP is showing renewed bullish momentum on the 1-hour chart after recovering from the $1.618 support zone. The price is currently trading around $1.703, up approximately 1.98%, indicating that buyers are stepping back into the market after an extended downward move. The latest price action suggests a potential short-term recovery, but the key question remains: can buyers maintain this momentum and break through the nearby resistance levels? 🔍 Technical Analysis The chart shows a strong decline from the previous high near $1.922, followed by a period of consolidation around the $1.62–$1.67 region. Recently, the price has started moving upward with stronger momentum, signaling a possible shift in short-term market sentiment. The moving averages are also providing encouraging signs: 🟡 MA7: $1.683 🔵 MA14: $1.668 🟣 MA28: $1.661 The current price is trading above all three moving averages, while the short-term average is positioned above the medium- and longer-period averages. This alignment supports the possibility of continued short-term bullish momentum. However, a moving-average crossover alone does not confirm a complete trend reversal. Buyers still need to overcome resistance and defend the recent breakout area. 🎯 Key Resistance Levels • $1.713 — Immediate resistance and the current 24-hour high • $1.730–$1.750 — Potential breakout zone if buying pressure continues • $1.770 — Important resistance area based on previous price action • $1.800 — Psychological target if bullish momentum strengthens A decisive 1-hour candle close above $1.713, followed by a successful retest, could increase the probability of a move toward the next resistance zones. 🛡️ Important Support Levels • $1.683 — First short-term support near MA7 • $1.668–$1.661 — Moving-average support cluster • $1.640 — Potential pullback support • $1.618 — Major recent swing-low support If the price falls below the moving-average cluster, the bullish momentum may weaken. A breakdown below $1.618 would invalidate the current recovery structure and expose the market to further downside risk. 📈 Potential Trading Setup — LONG 🚀 Entry Zone: $1.690–$1.705 🎯 TP1: $1.720 🎯 TP2: $1.745 🎯 TP3: $1.770 🔴 SL: $1.665 Trade confirmation: Look for a sustained hold above the entry zone and positive price action around $1.713 before considering continuation. Avoid chasing a sudden green candle if the price has already moved far above the planned entry. ⚠️ Risk Management This is a conditional setup based on the supplied chart, not a guaranteed prediction. The market remains vulnerable to sharp reversals, especially after a rapid upward move within a broader declining structure. Wait for confirmation, calculate your position size according to your risk tolerance, and avoid excessive leverage. If the stop-loss is too wide for your strategy, reduce the position size rather than increasing your risk. 💡 Final Outlook TRUMP/USDT is showing signs of a short-term bullish recovery after defending the $1.618 low. Trading above $1.683 and the moving-average cluster gives buyers a constructive starting point, but $1.713 remains the first major hurdle. A confirmed breakout could open the door toward $1.745 and $1.770. On the other hand, rejection at resistance or a loss of nearby support could lead to another pullback. For now, the key is simple: watch the breakout, respect the support levels, and let price confirmation guide the trade. 🔥 Stay patient. Trade with a plan. Protect your capital. $TRUMPUSDT $BTCUSDT #WSOT2026 #AnthropicS1Filing #IMPACTbyTrade #MyByXTake #ByXIMPACT
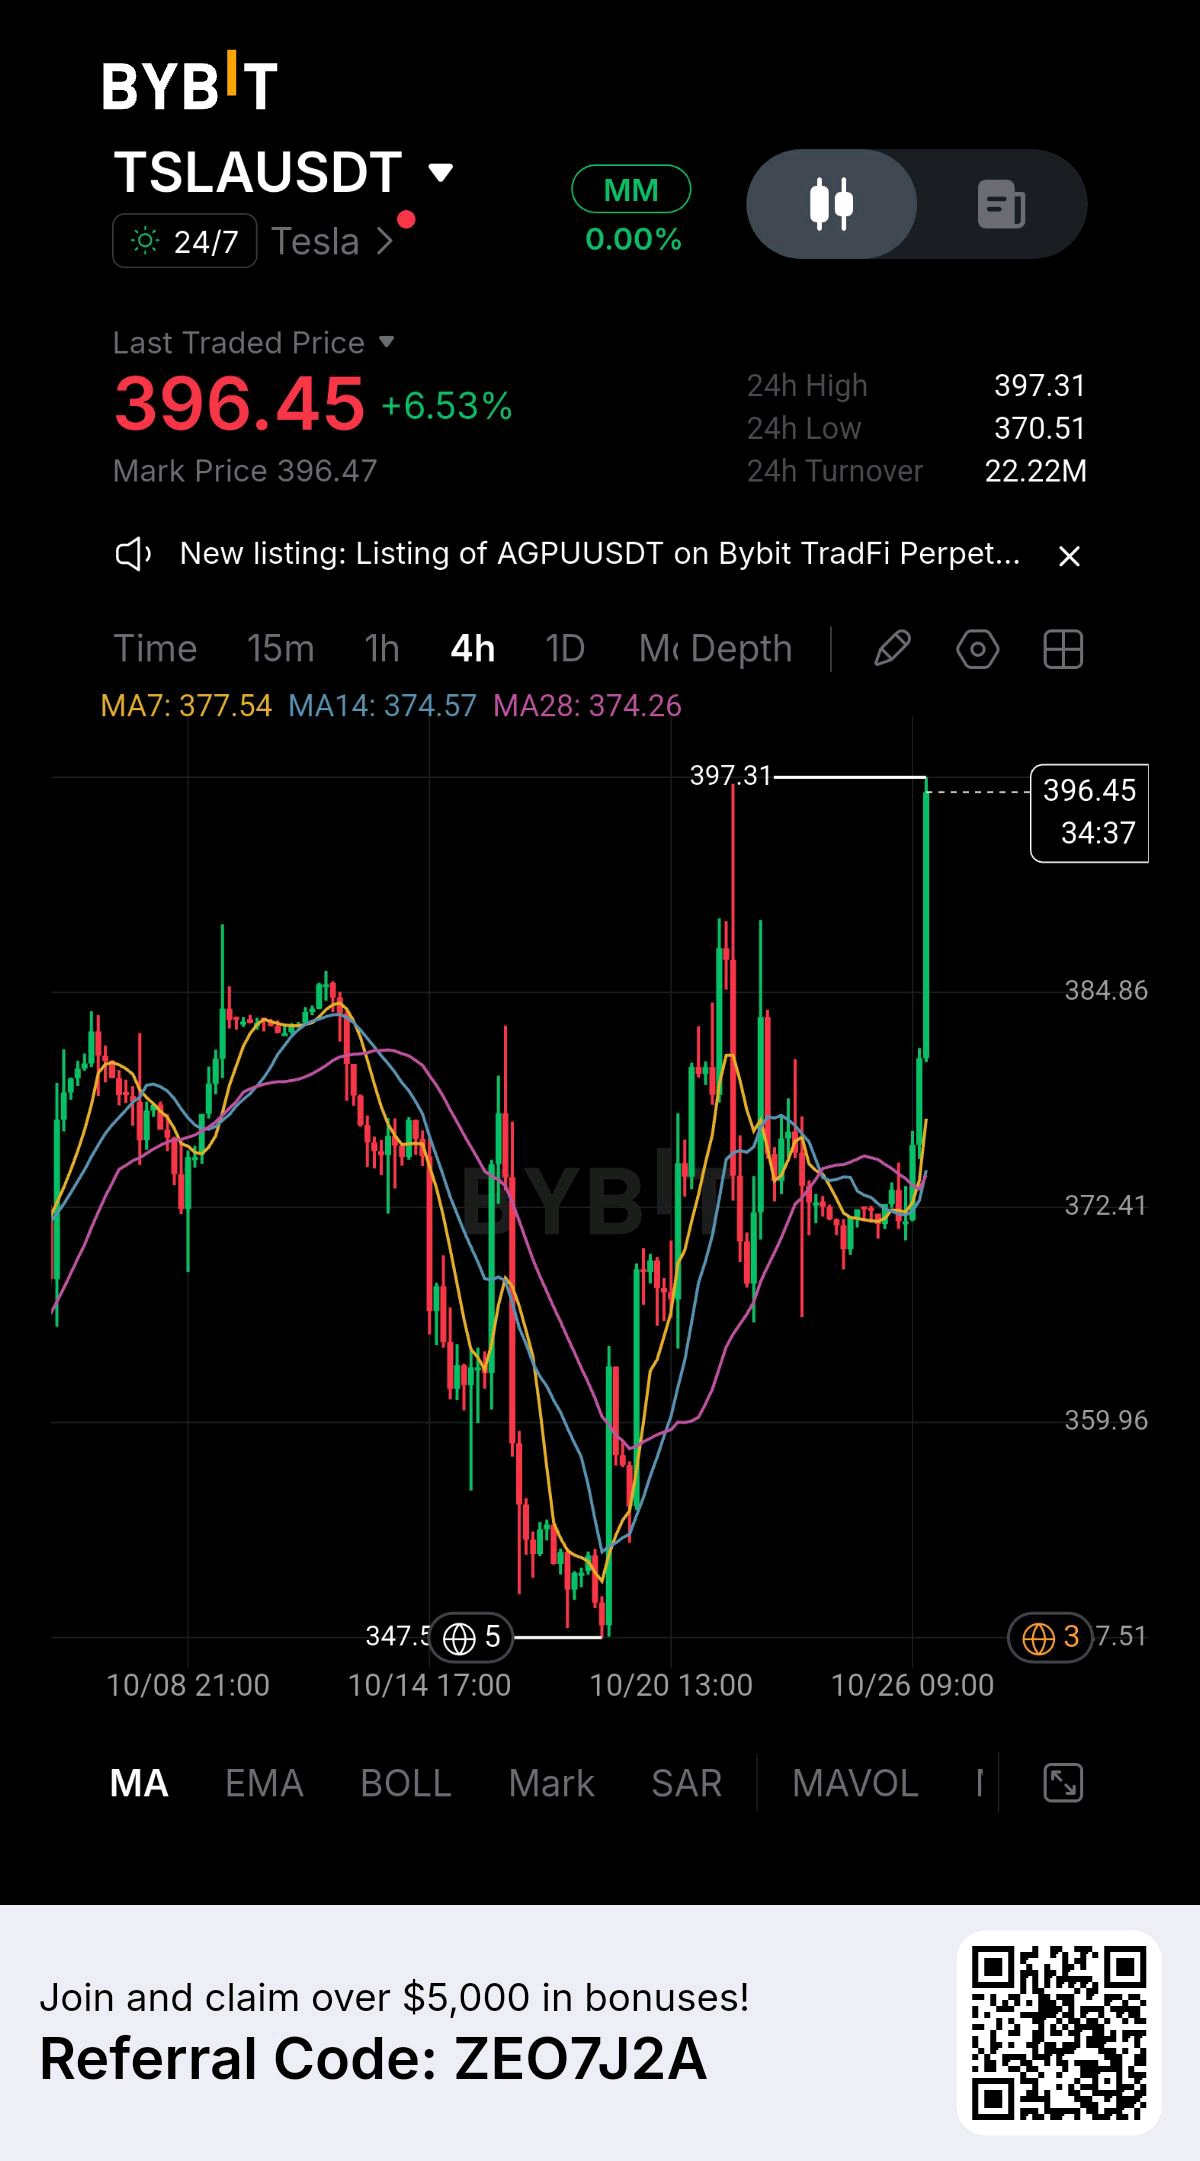
TSLAUSDT has launched a massive vertical expansion, surging to 396.45 (+6.53%) on the 4H timeframe as aggressive buyers drive price directly into the upper resistance threshold. Following a shallow re-accumulation base around the 370.51 24h low, institutional order flow catalyzed a sharp breakout, pushing price to challenge the 397.31 local high. The price action has completely uncoiled above the 4H moving average ribbon—MA28 (374.26), MA14 (374.57), and MA7 (377.54)—signaling strong directional momentum. Backed by an impressive $22.22M in 24h turnover, TSLA is setting up for a continuation push into psychological macro resistance once local supply is absorbed. TRADE PARAMETERS Pair: TSLAUSDT (4H Timeframe) Bias: Bullish Dynamic Breakout / Trend Continuation Buy Zone: 388.00 to 396.00 Stop Loss: 373.50 (4H close below 4H MA14/MA28 dynamic support cluster at 374.26–374.57) PROFIT TARGETS Target 1: 397.30 (Immediate liquidity sweep of the 397.31 24h peak high for risk neutralization) Target 2: 410.00 (Structural expansion target into psychological overhead resistance) Target 3: 425.00 (Macro trend continuation target) TECHNICAL CONFLUENCES * Strong Moving Average Crossover & Expansion The 4H MA7 (377.54) has aggressively crossed above the MA14 (374.57) and MA28 (374.26) dynamic baselines, establishing a robust bullish stack supporting higher prices. * High Liquidity & Volume Backing The move is supported by heavy market participation with $22.22M in 24h turnover, confirming authentic institutional interest behind the breakout. * Higher-Low Structural Base Intact Buyers successfully defended the higher-low structure off the 347.55 base, keeping the overall macro uptrend architecture fully intact. RISK & EXECUTION PLAN Scale into long positions within the defined buy zone during minor intraday consolidations. As soon as Target 1 is cleared, harvest initial partial profits immediately and shift the Stop Loss straight to the entry price to execute a completely risk-free hold into macro targets. $TSLAXUSDT #WSOT2026 #AnthropicS1Filing #IMPACTbyTrade #MyByXTake #ByXIMPACT
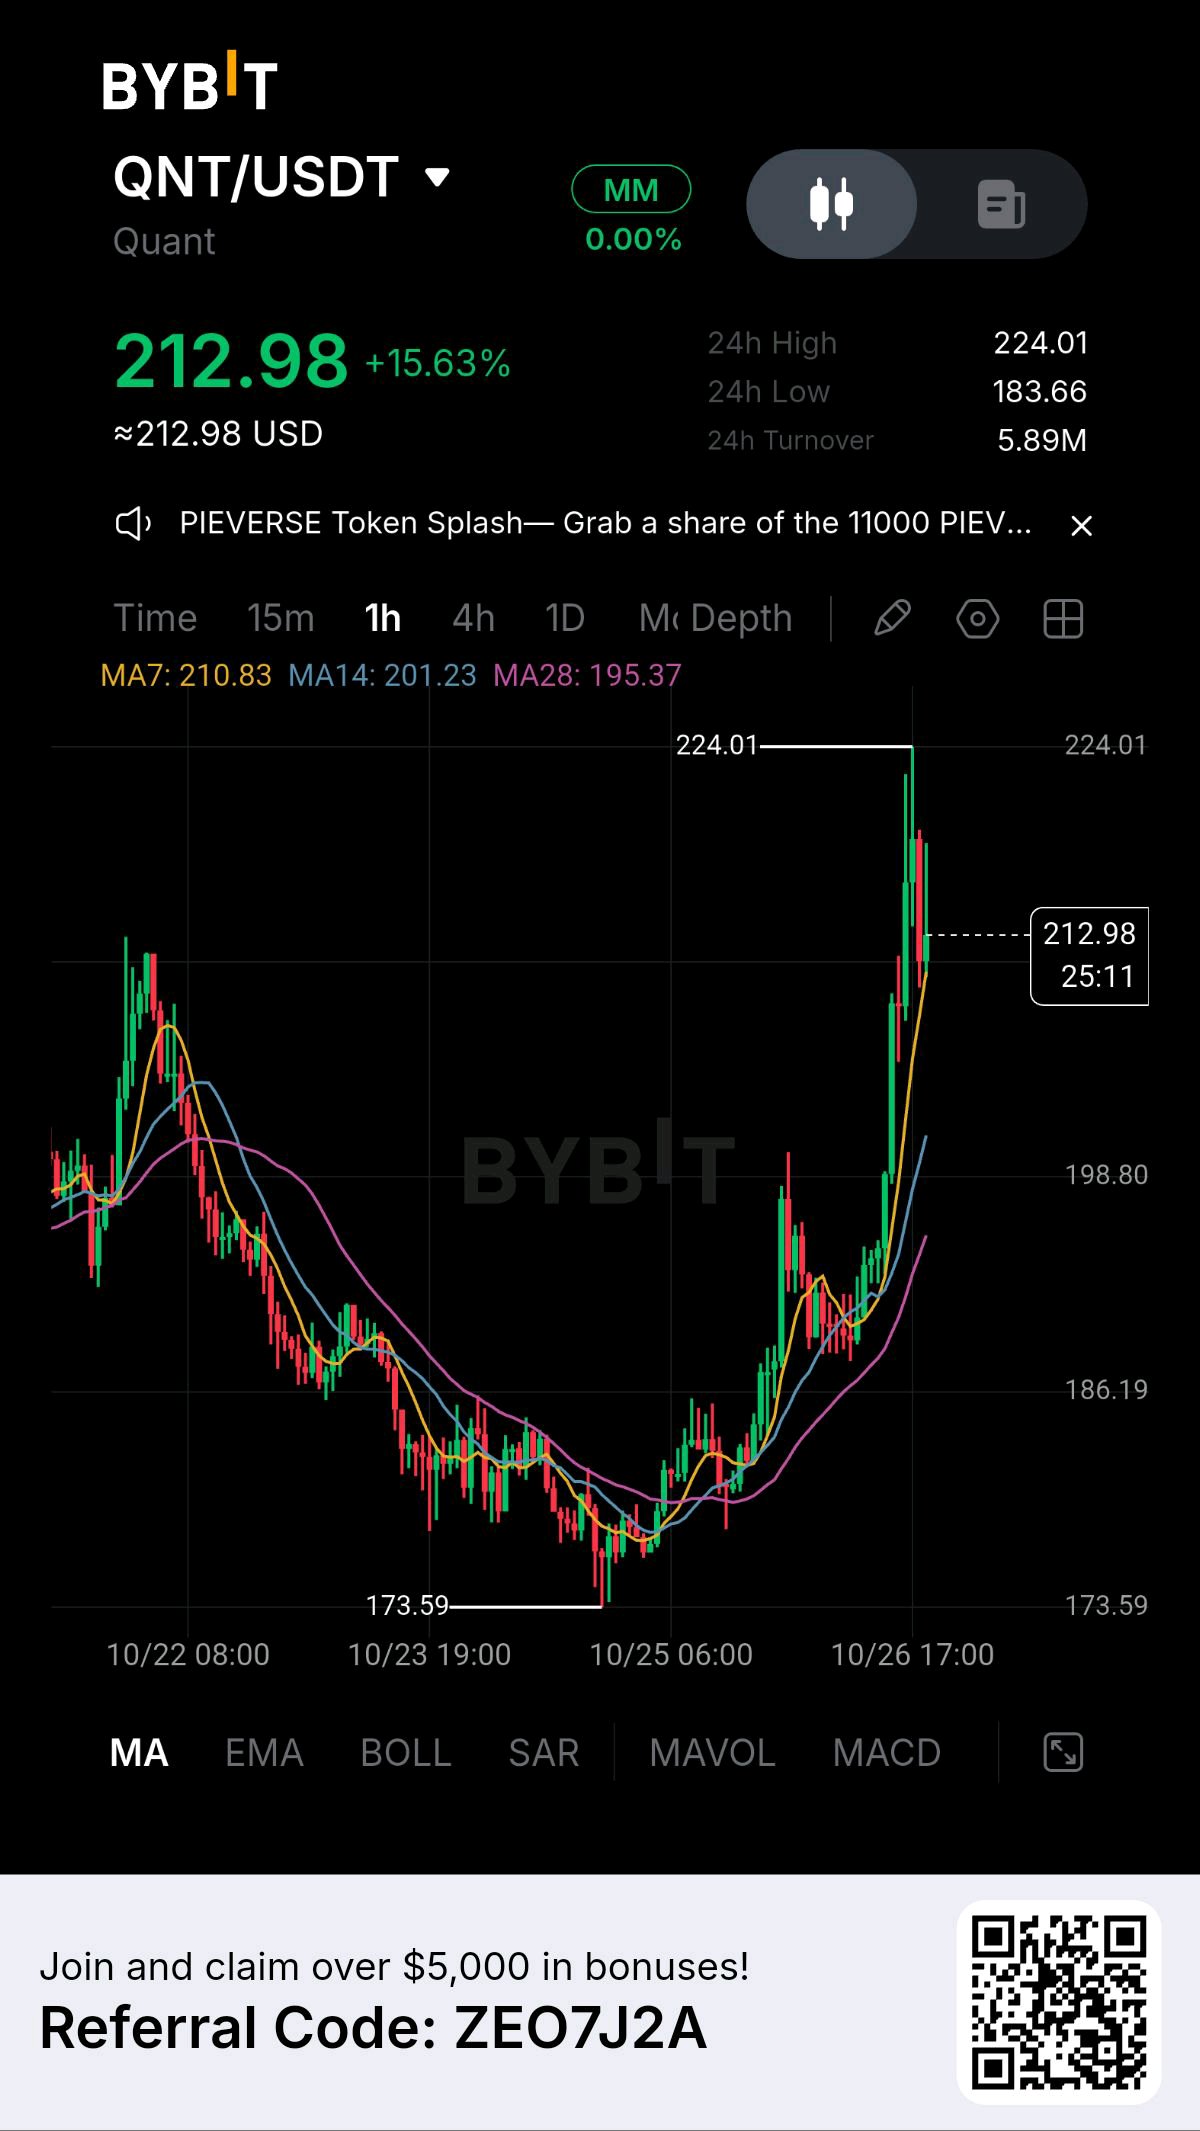
QNT has delivered a massive impulsive surge, rallying to 212.98 (+15.63%) on the 1h chart as strong institutional momentum breaks out above previous local ranges. Following a powerful rebound off the 173.59 structural floor, buying pressure accelerated rapidly to test a 24h high of 224.01. Price is currently consolidating its gains while comfortably holding above the 1h moving average stack—MA28 (195.37), MA14 (201.23), and MA7 (210.83). Fueled by $5.89M in 24h turnover, this explosive continuation setup indicates that buyers are preparing to retest the upper supply zone and resume the primary bullish trend. TRADE PARAMETERS Pair: QNT/USDT (1h Timeframe) Bias: Bullish Momentum Continuation / Breakout Re-entry Buy Zone: 205.00 to 212.50 Stop Loss: 194.50 (1h close below MA28 baseline support at 195.37) PROFIT TARGETS Target 1: 216.50 (Initial local resistance clearance for immediate risk-free adjustment) Target 2: 224.00 (Sweep of the 224.01 24h peak high) Target 3: 235.00 (Full structural liquidity expansion into higher uncharted targets) TECHNICAL CONFLUENCES * Explosive Breakout Off Lows Price vaulted aggressively from the 173.59 base, showcasing heavy aggressive buying and a complete shift in short-term market control. * Clean Moving Average Alignment The 1h MA7, MA14, and MA28 are stacked in a bullish configuration, confirming robust trend strength backing the current price level. * High-Volume Momentum Expansion Supported by $5.89M in 24h turnover and a +15.63% daily surge, buyer participation remains deep and structurally sound. RISK & EXECUTION PLAN Scale into long positions within the defined buy zone on minor hourly dips. Upon hitting Target 1, harvest initial partial profits immediately and shift the Stop Loss straight to the entry price to secure a completely risk-free position. $QNTUSDT #WSOT2026 #AnthropicS1Filing #IMPACTbyTrade #MyByXTake #ByXIMPACT
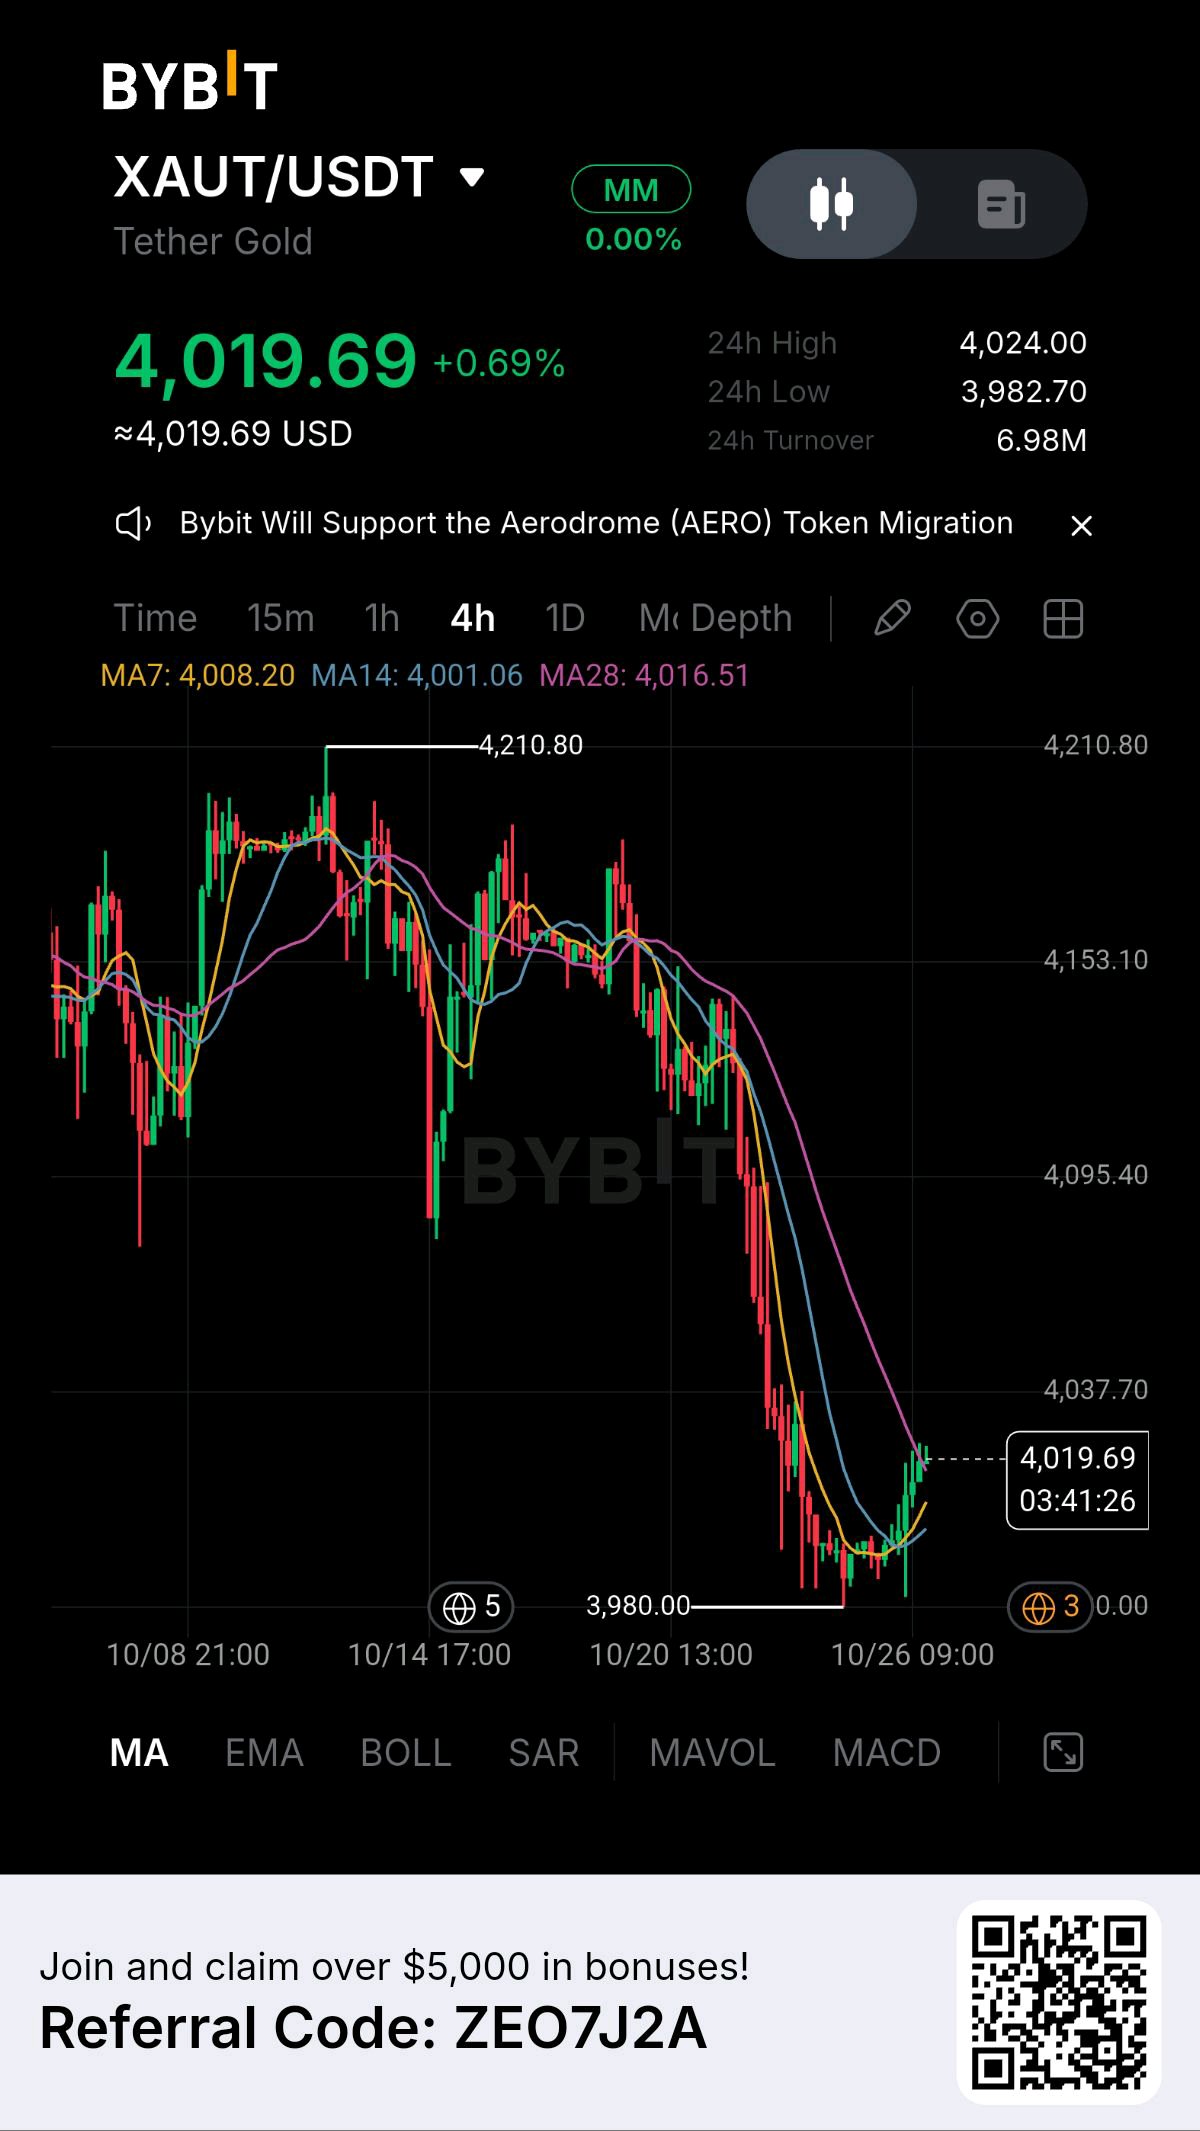
$XAUTUSDT has staged a sharp recovery off the recent structural floor, charging back to 4,019.69 (+0.69%) on the 4H chart as persistent buyers aggressively defend the lower boundary. Following a steep correction from the 4,210.80 swing high down to test the 3,980.00 region, sell-side pressure quickly evaporated. Price is now printing a strong impulsive rebound candle, successfully reclaiming the 4H MA14 (4,001.06) and MA7 (4,008.20) dynamic lines while pressing against the MA28 baseline (4,016.51). Backed by $6.98M in 24h turnover and a 24h high of 4,024.00, this solid reaction off the lows positions Tether Gold for a continuation rally back toward higher liquidity zones. TRADE PARAMETERS Pair: XAUT/USDT (4H Timeframe) Bias: Bullish Structural Recovery / Trend Re-entry Buy Zone: 3,995.00 to 4,018.00 Stop Loss: 3,965.00 (4H close below local demand floor support) PROFIT TARGETS Target 1: 4,035.00 (Initial resistance clearance for immediate risk-free adjustment) Target 2: 4,095.40 (Mid-range structural supply test) Target 3: 4,210.80 (Full liquidity sweep of the 4,210.80 macro peak high) TECHNICAL CONFLUENCES * Impressive Rebound Off Lower Range Support Buyers stepped in firmly near the 3,980.00 base, preserving the broader asset integrity and triggering an immediate technical recovery. * Dynamic Moving Average Reclamation Price has cleanly punched back above the 4H MA7 and MA14 indicators, signaling a swift shift in short-term momentum back to the bulls. * Intact Higher-Timeframe Market Structure The structural reaction off the recent lows confirms that institutional accumulation is active, keeping the path open toward macro overhead resistance. RISK & EXECUTION PLAN Scale into long positions within the entry buy zone on minor intraday pullbacks. Once Target 1 is achieved, lock in partial profits immediately and shift the Stop Loss straight to the entry price to secure a completely risk-free position. #WSOT2026 #IMPACTbyTrade #MyByXTake #MidtermsMarketWatch #ByXIMPACT
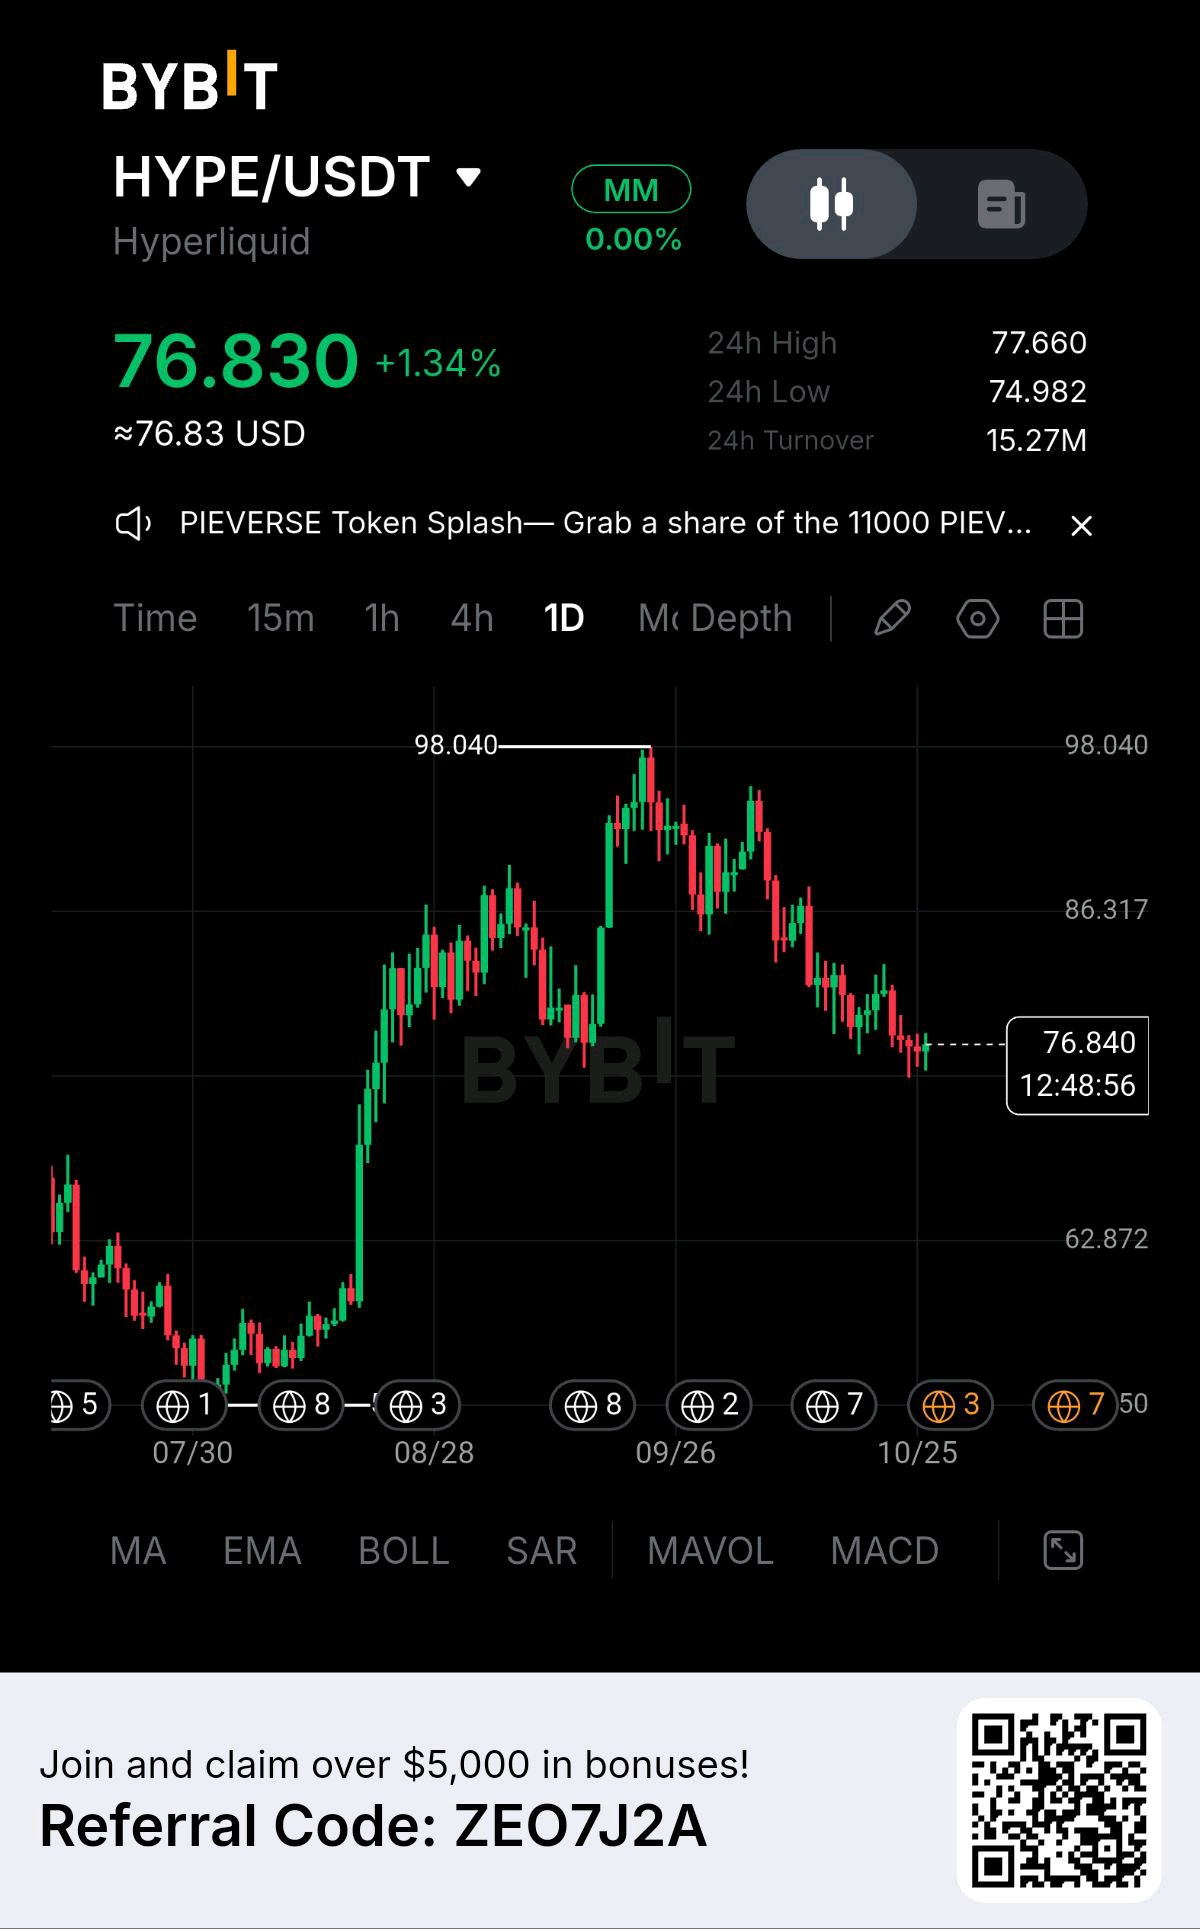
$HYPEUSDT is at a point where the market needs to prove that selling pressure is finally easing. After reaching a major peak near 98.040, price has gradually moved lower, forming a sequence of weaker rebounds and declining swing highs on the daily chart. The current price around 76.830 places the market much closer to a potential support area than to the previous peak, but that alone does not make the asset a buying opportunity. For now, the structure favors caution and keeps a bearish continuation scenario in focus. Rather than opening a short position after an extended decline, I would prefer to see whether a recovery toward 78.00–80.00 attracts fresh selling. This zone could provide a more favorable risk-defined opportunity if price rejects it and lower-timeframe candles confirm that sellers remain in control. Without that confirmation, the setup stays on watch rather than becoming an immediate entry. 🚀 Entry Zone: 78.00–80.00 🎯 Take Profit 1: 74.00 🎯 Take Profit 2: 70.00 🎯 Take Profit 3: 66.00 🔴 Stop Loss: 82.00 The first objective is positioned near the recent trading area below current price, while the next targets represent possible extensions if bearish momentum strengthens. A decisive move beneath nearby support could help validate continuation, but the market may also consolidate or reverse before reaching any target. These levels are planning references, not guaranteed outcomes. There is an important condition to this idea: price must show rejection within the proposed entry zone. If HYPE/USDT continues falling without a pullback, chasing the move would reduce entry quality and could expose the trade to a sudden rebound. On the other hand, a sustained recovery above 80.00 and especially a move toward 82.00 would weaken or invalidate this short scenario. My focus is on waiting for confirmation, defining risk before entry, and avoiding trades that do not offer a clear setup. The daily structure currently leans bearish, but execution should depend on the price reaction—not bias alone. #WSOT2026 #IMPACTbyTrade #MyByXTake #MidtermsMarketWatch #ByXIMPACT
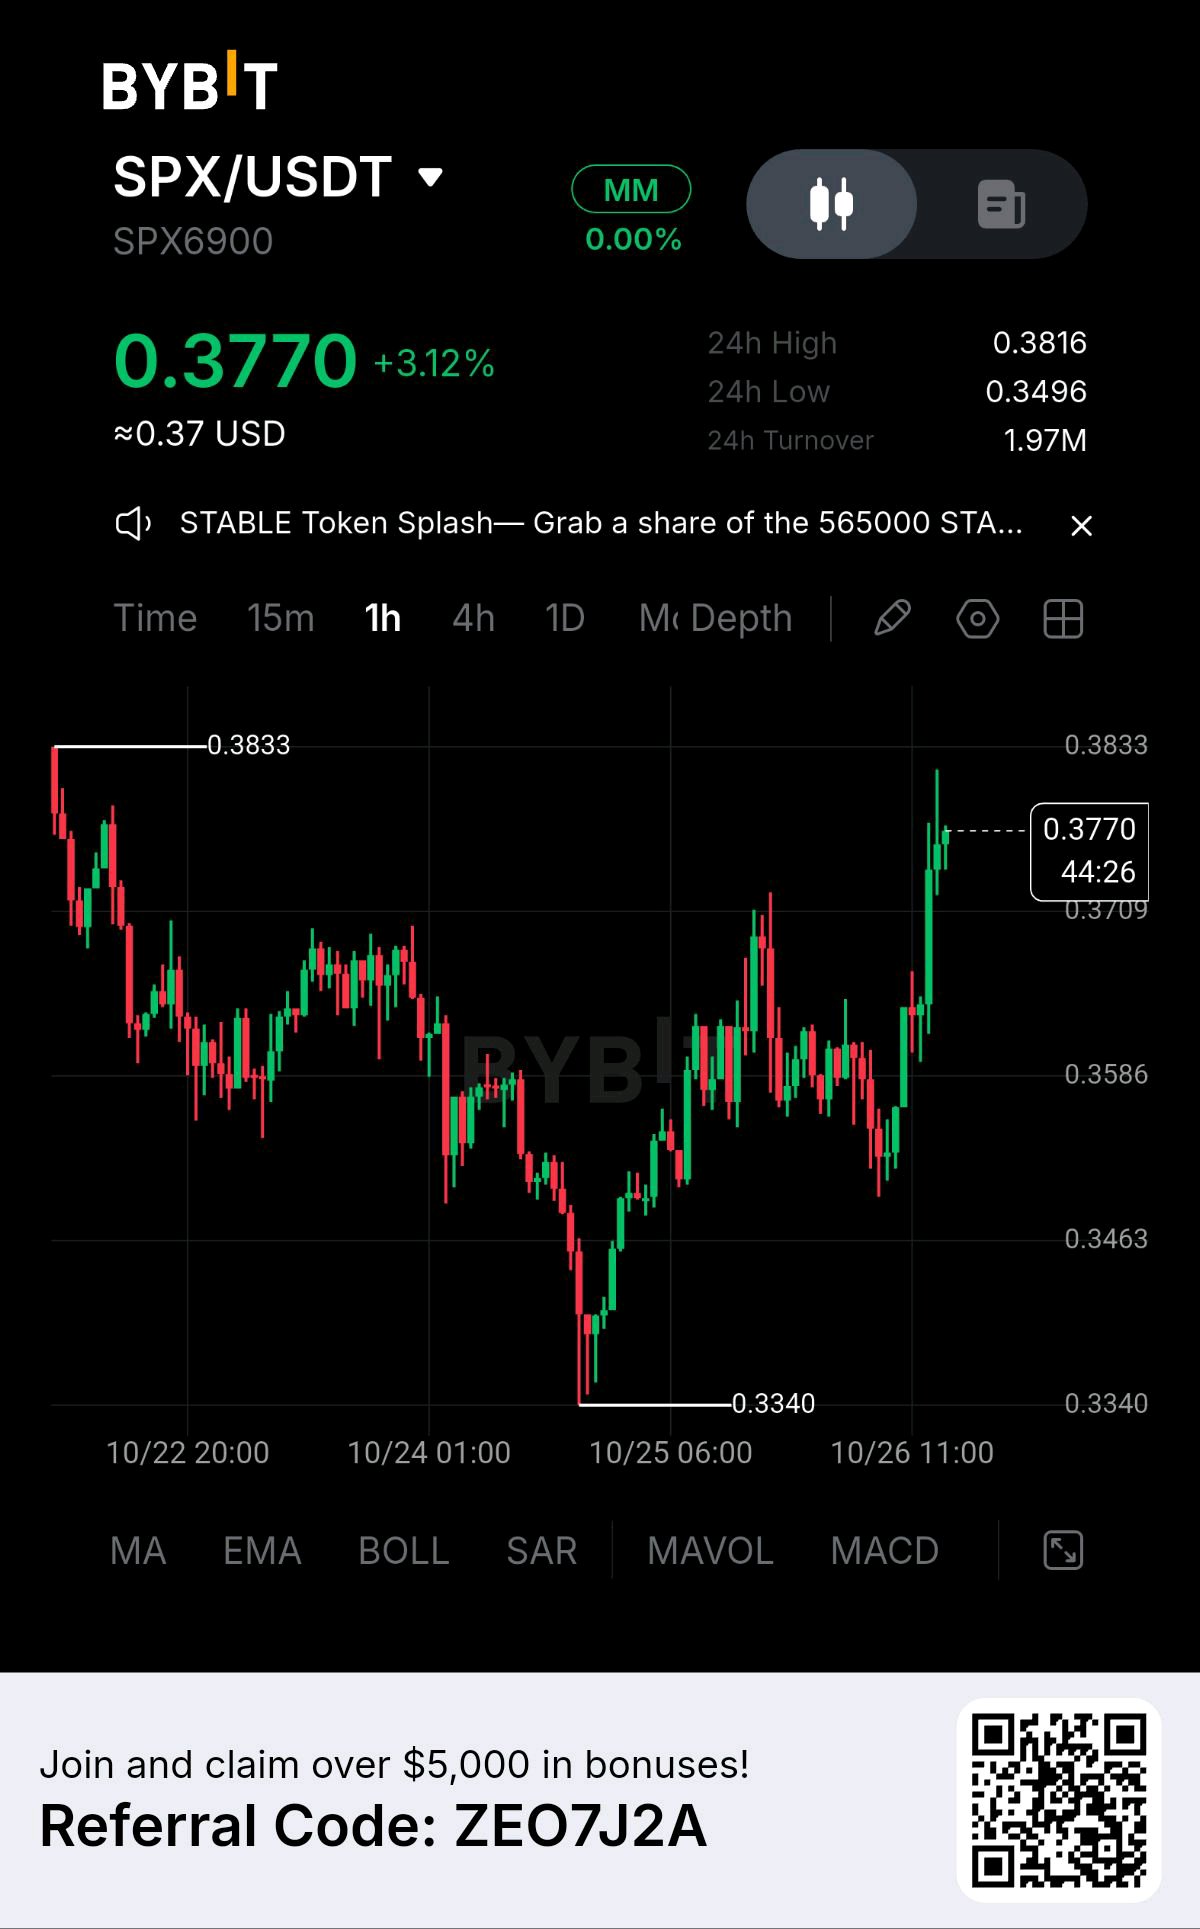
$SPXUSDT is approaching a critical decision zone after a sharp bullish expansion on the 1-hour chart. Price has climbed from the recent low near 0.3340 and recovered above the 0.3586 region, showing that buyers have regained short-term control. The latest upward impulse has pushed the market toward 0.3770, bringing the previous resistance zone around 0.3815–0.3833 back into focus. However, a strong candle sequence alone is not enough to confirm a sustainable breakout. The next move will depend on whether buyers can defend the breakout area and establish support instead of allowing price to fall back into the previous range. My preferred approach is to wait for a controlled pullback rather than enter after the initial surge. A potential long-entry zone sits between 0.3700 and 0.3720, provided price revisits this area and shows clear bullish confirmation. This would offer a more structured entry near potential support while keeping the invalidation level defined in advance. Potential trade levels: Entry zone: 0.3700–0.3720 Stop loss: 0.3640 Take Profit 1: 0.3815 Take Profit 2: 0.3880 Take Profit 3: 0.3950 The first target aligns with the nearby resistance area, where partial profit-taking could help reduce exposure. A confirmed break above 0.3833 could open the way toward 0.3880, with 0.3950 serving as a more ambitious extension if bullish momentum continues. These targets are conditional rather than guaranteed, and resistance may trigger a reversal before they are reached. The bearish scenario must remain part of the plan. If price loses the 0.3700 area and fails to reclaim it, the proposed entry loses its immediate appeal. A deeper move toward 0.3640 would weaken the setup, while a break below that level would invalidate this trade idea. If price reaches resistance without offering a clean retest, I would rather miss the entry than chase an extended move. The key is confirmation, not prediction. I will be watching how SPX/USDT reacts around the breakout zone and whether buyers can turn former resistance into support. Until that reaction becomes clear, this remains a conditional setup rather than an active position. #WSOT2026 #IMPACTbyTrade #MyByXTake #MidtermsMarketWatch #ByXIMPACT
How Bybit AI Helped Me Discover Hidden Features
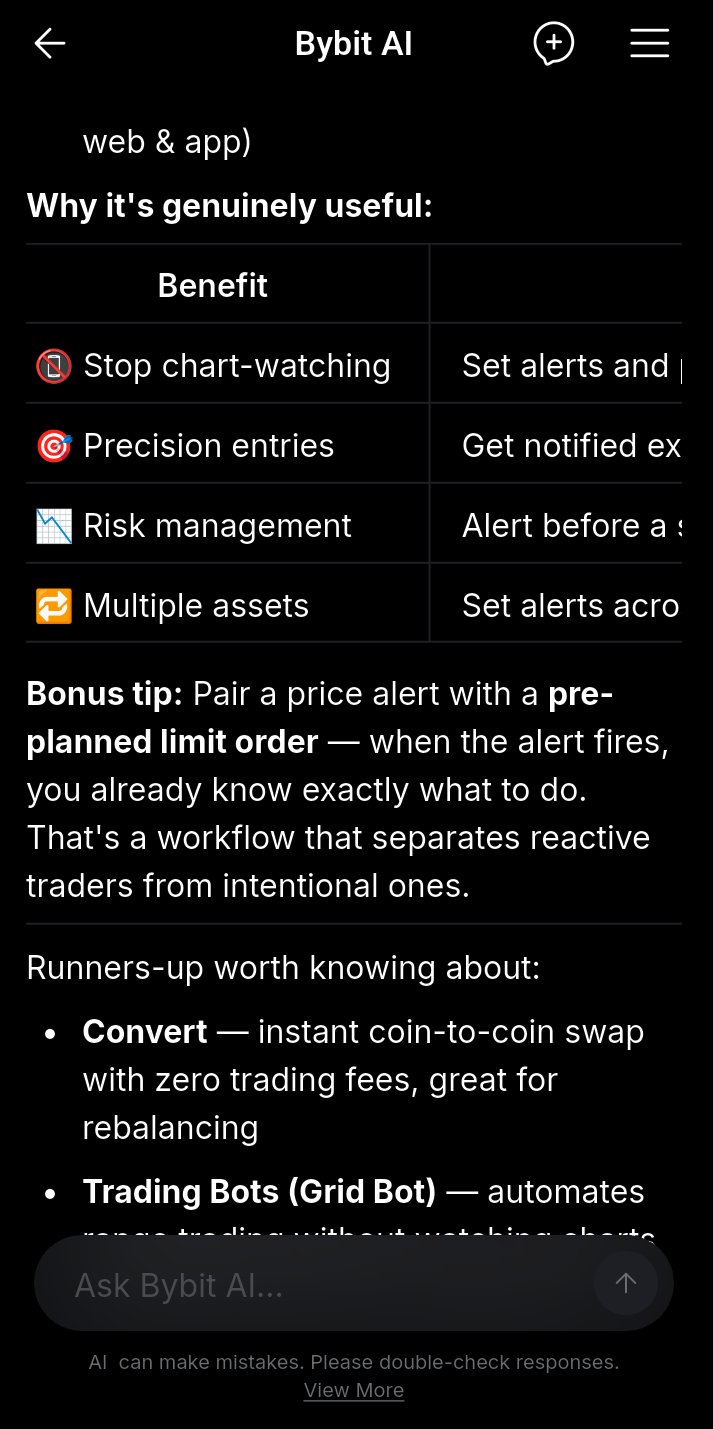
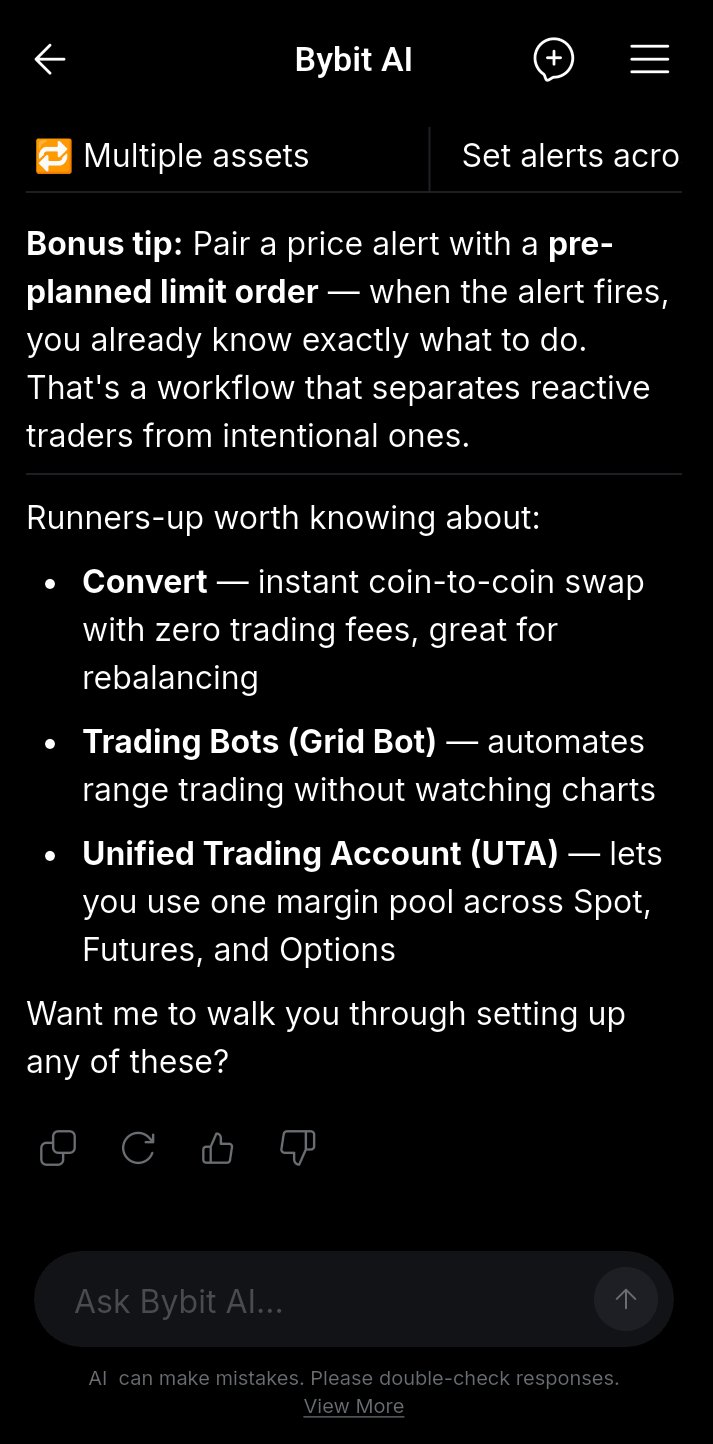
I asked Bybit AI: “What’s one Bybit feature most users miss, and why is it useful?” The answer introduced me to Price Alerts, a feature that I think many users overlook. Instead of constantly watching the charts, you can set a specific price level and get notified when the market reaches it. What I liked most was that the answer didn’t just name the feature—it explained why it’s useful, especially for monitoring multiple assets and planning trades more efficiently. 💡 My feedback: Bybit AI gave me a clear and practical answer, but the Price Alerts feature could be made more visible and easier to access directly from the trading screen. Overall, this was a useful AI interaction and helped me discover a feature I’ll definitely keep in mind. 🚀 $BTCUSDT $XAUTUSDT #BybitAIBestReplies #FOMC #FOMCMinutes #TOKEN2049 #ByXIMPACT

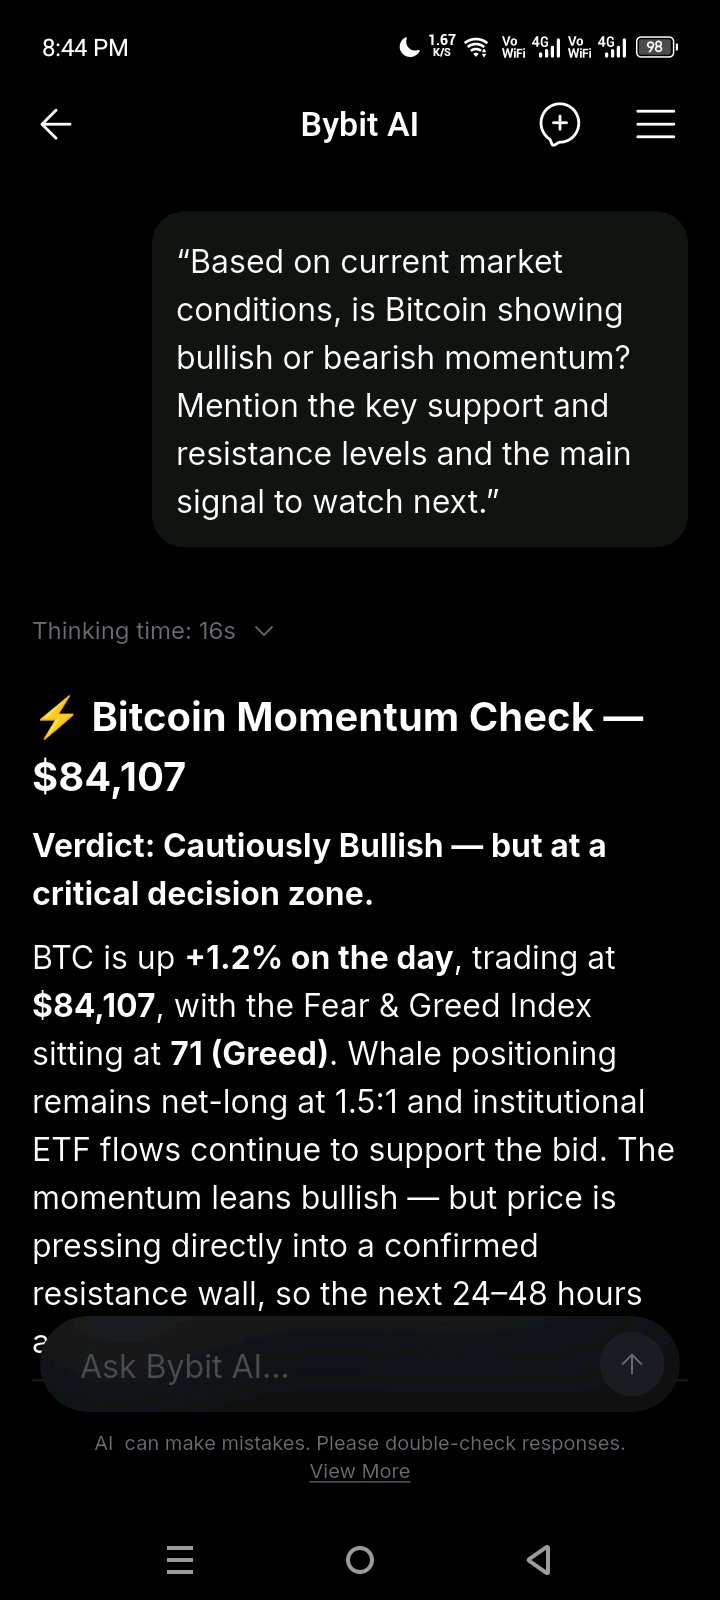
Bybit AI is not just another AI tool. It feels like a step toward the future of how traders can understand the market. Instead of simply looking at price charts and trying to connect everything manually, Bybit AI can bring market information, momentum, key levels, and important signals together in one analysis. The real value is not only in getting an answer, but in being able to ask a question and quickly turn complex market data into something easier to understand. What makes it interesting is how naturally it fits into the trading experience. You can ask about the market, explore different scenarios, and use AI as an additional layer of research before making your own decisions. This is what the future of trading tools looks like to me: less time searching through information, more time understanding what actually matters. Bybit AI is still evolving, but the direction is clear. AI is becoming part of the trading experience, and this is only the beginning. $BTCUSDT $SOLUSDT #BybitAIBestReplies #BybitOdds #TradFiOptions24/7 #MakeYourMove #ByXIMPACT
NEAR Protocol — Market Update
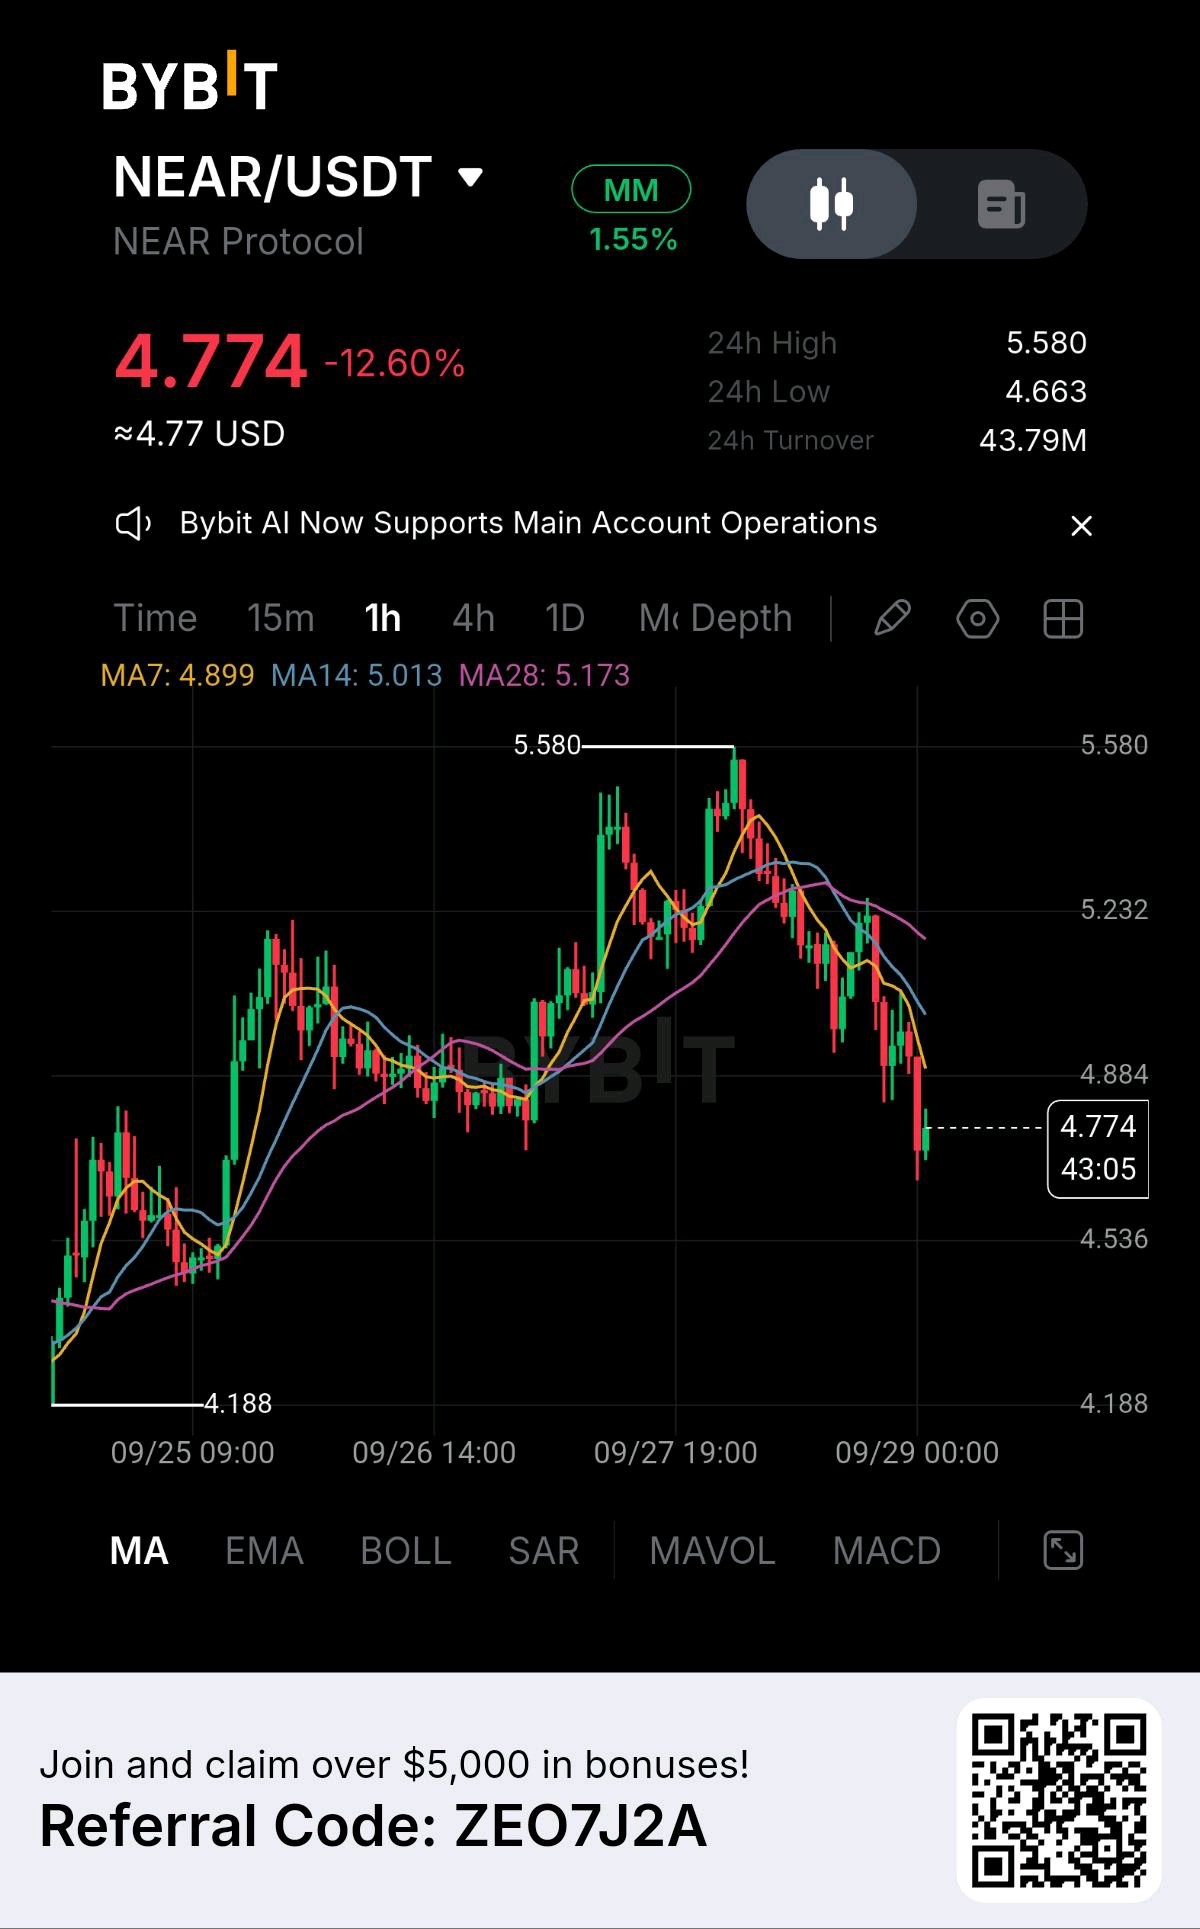
NEAR is trading at $4.775, down 12.1% in the last 24 hoursnamid broader market volatility — but the fundamentals and recent news are telling a different story. 📰 What's happening with NEAR right now: 🔒 NEAR Intents froze $503K in stolen funds linked to the Bitget hack — a real-world demonstration of NEAR's on-chain security capabilities in action. 🏪 Oracle chose NEAR for fast stablecoin payments at point-of-sale — another enterprise adoption win for the ecosystem. 📈 Bitwise made a bold 30x–100x prediction for NEAR, citing AI integration as a potential major catalyst: "AI could send it soaring." 🔥 NEAR is also being highlighted as one of the best altcoins to watch heading into the next cycle. 💡 The takeaway: The dip looks technical. NEAR's infrastructure is gaining real traction — enterprise payments, AI narrative, and on-chain security are all converging. Analysts are watching this one closely. $NEARUSDT #ByXIMPACT
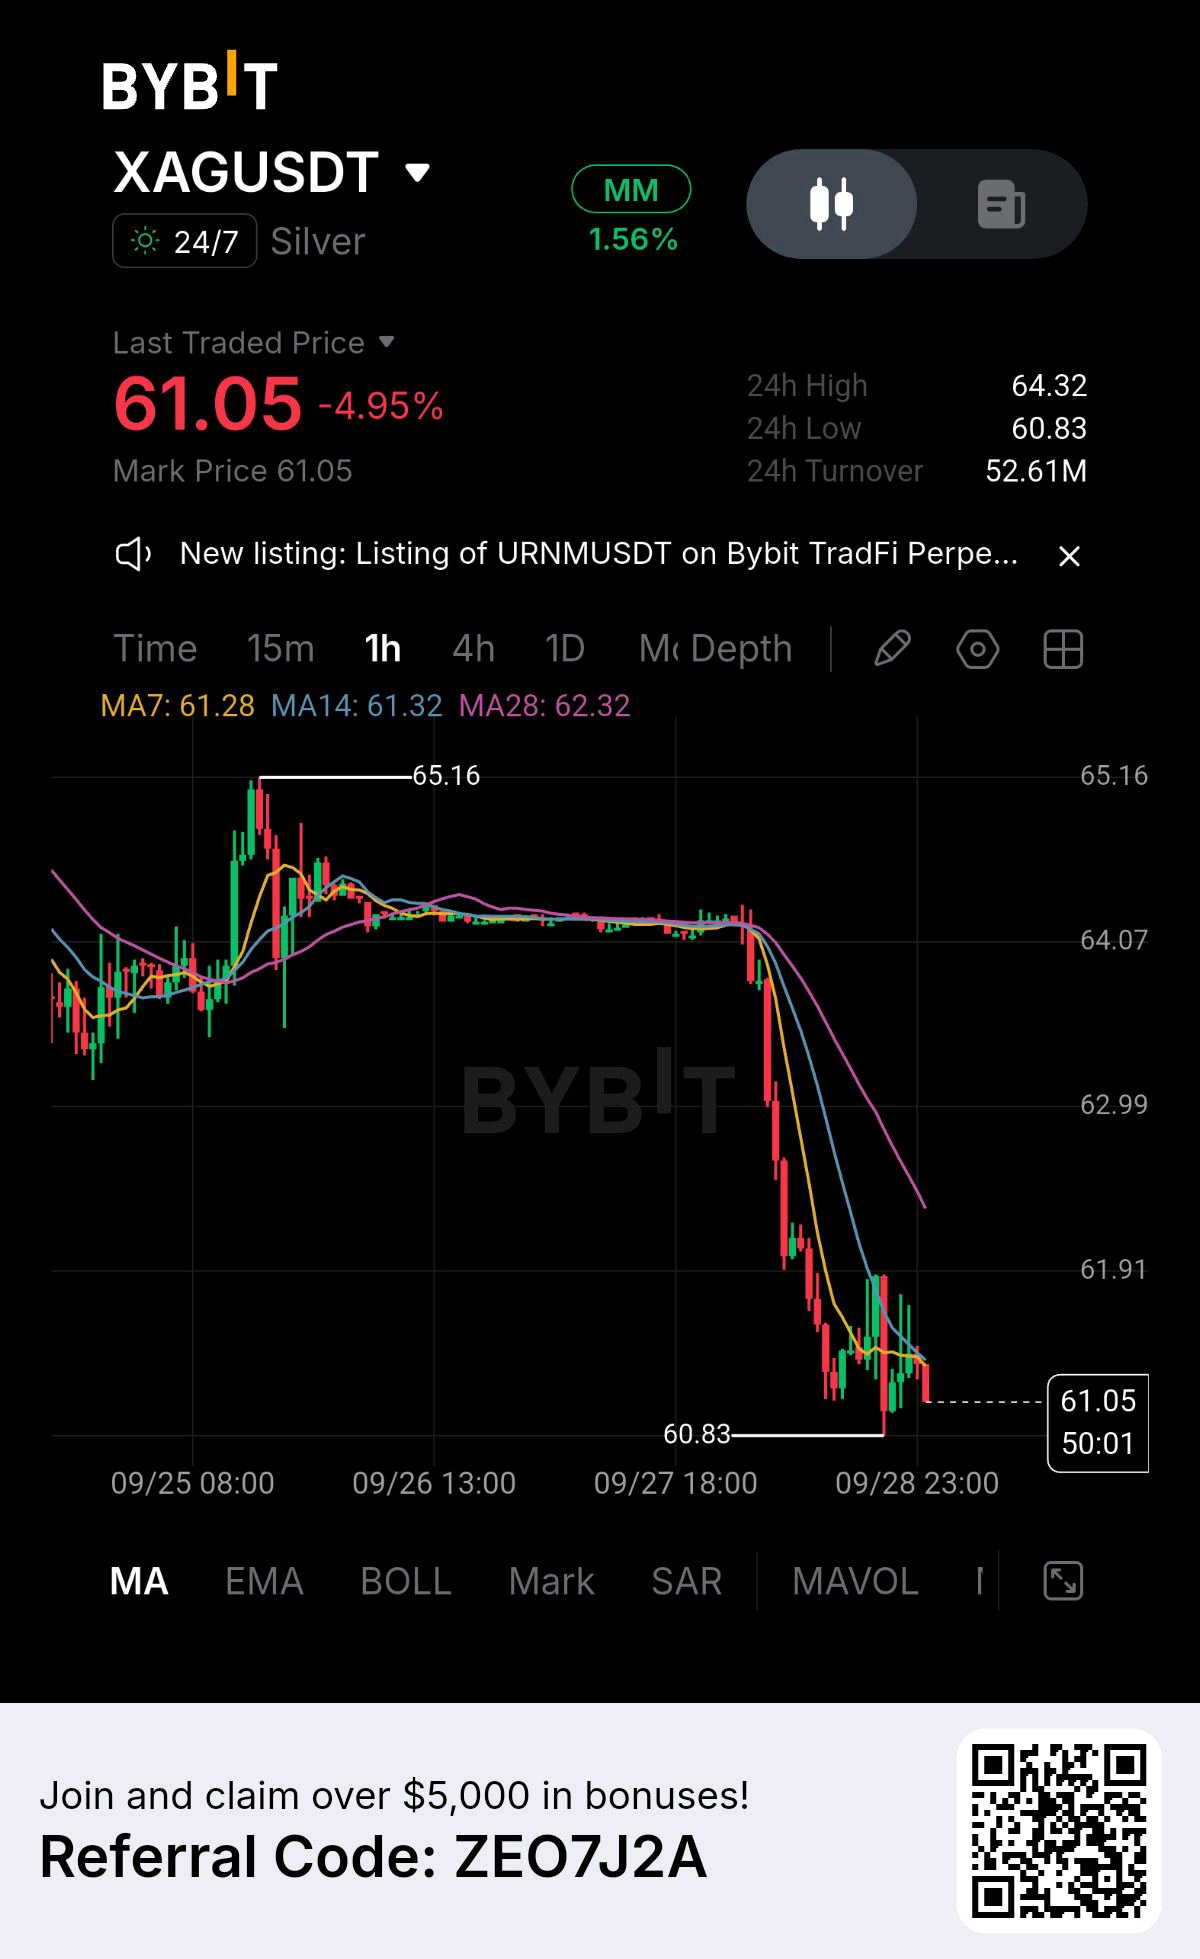
XAGUSDT is trying to stabilize after a sharp breakdown from the $64.00 area, with price now around $61.05 after touching a recent low near $60.83. The 1H chart shows a clear shift in short-term structure, as sellers pushed price below the previous consolidation range and all three moving averages are now positioned above the current price. After such a fast decline, the market is attempting to form a base around $60.83–$61.00, but the recovery remains limited so far. The next important move will depend on whether buyers can defend this low and reclaim the nearby resistance levels or whether another selling wave develops. The previous range around $64.00 acted as a major balance area, but the breakdown changed the short-term structure significantly. Key Levels Support: $60.83–$61.00 Major Support: $60.50 Resistance: $61.90–$62.00 Major Resistance: $62.30–$63.00 Higher Resistance: $64.00–$64.10 The $60.83 level is currently the most important downside reference visible on the chart. Holding above this area could allow XAGUSDT to build a short-term recovery structure. Bullish Scenario If buyers defend $60.83–$61.00 and price starts forming higher lows, the first recovery target would be around $61.90–$62.00. A clean reclaim of $62.00 could open the way toward the $62.30–$63.00 resistance zone, where the moving-average structure is currently positioned. If price eventually recovers above $63.00, the previous $64.00–$64.10 range would become the next major area to watch. Bearish Scenario The current bounce remains vulnerable while price stays below the moving averages. If XAGUSDT loses $60.83 with strong selling pressure, the downside structure could extend toward the $60.50 area. A sustained break below the recent low would indicate that buyers have failed to defend the current base and could keep the short-term trend under pressure. Moving Average Structure MA7: $61.28 MA14: $61.32 MA28: $62.32 All three averages are currently above the market, with MA28 significantly higher around $62.32. This makes $61.28–$61.32 the first short-term recovery zone, while $62.32 is a more important resistance reference. The current structure is: $60.83–$61.00 → Key support $60.50 → Lower support $61.28–$61.32 → Immediate recovery zone $61.90–$62.00 → Resistance $62.30–$63.00 → Major resistance $64.00–$64.10 → Previous range XAGUSDT is now sitting close to the recent low after a major downside move. The $60.83–$61.00 area is therefore the key zone to watch for stabilization. A recovery back above $61.30 would improve the short-term structure, while a breakdown below $60.83 would keep the sellers’ pressure intact. $XAUTUSDT #ByXIMPACT

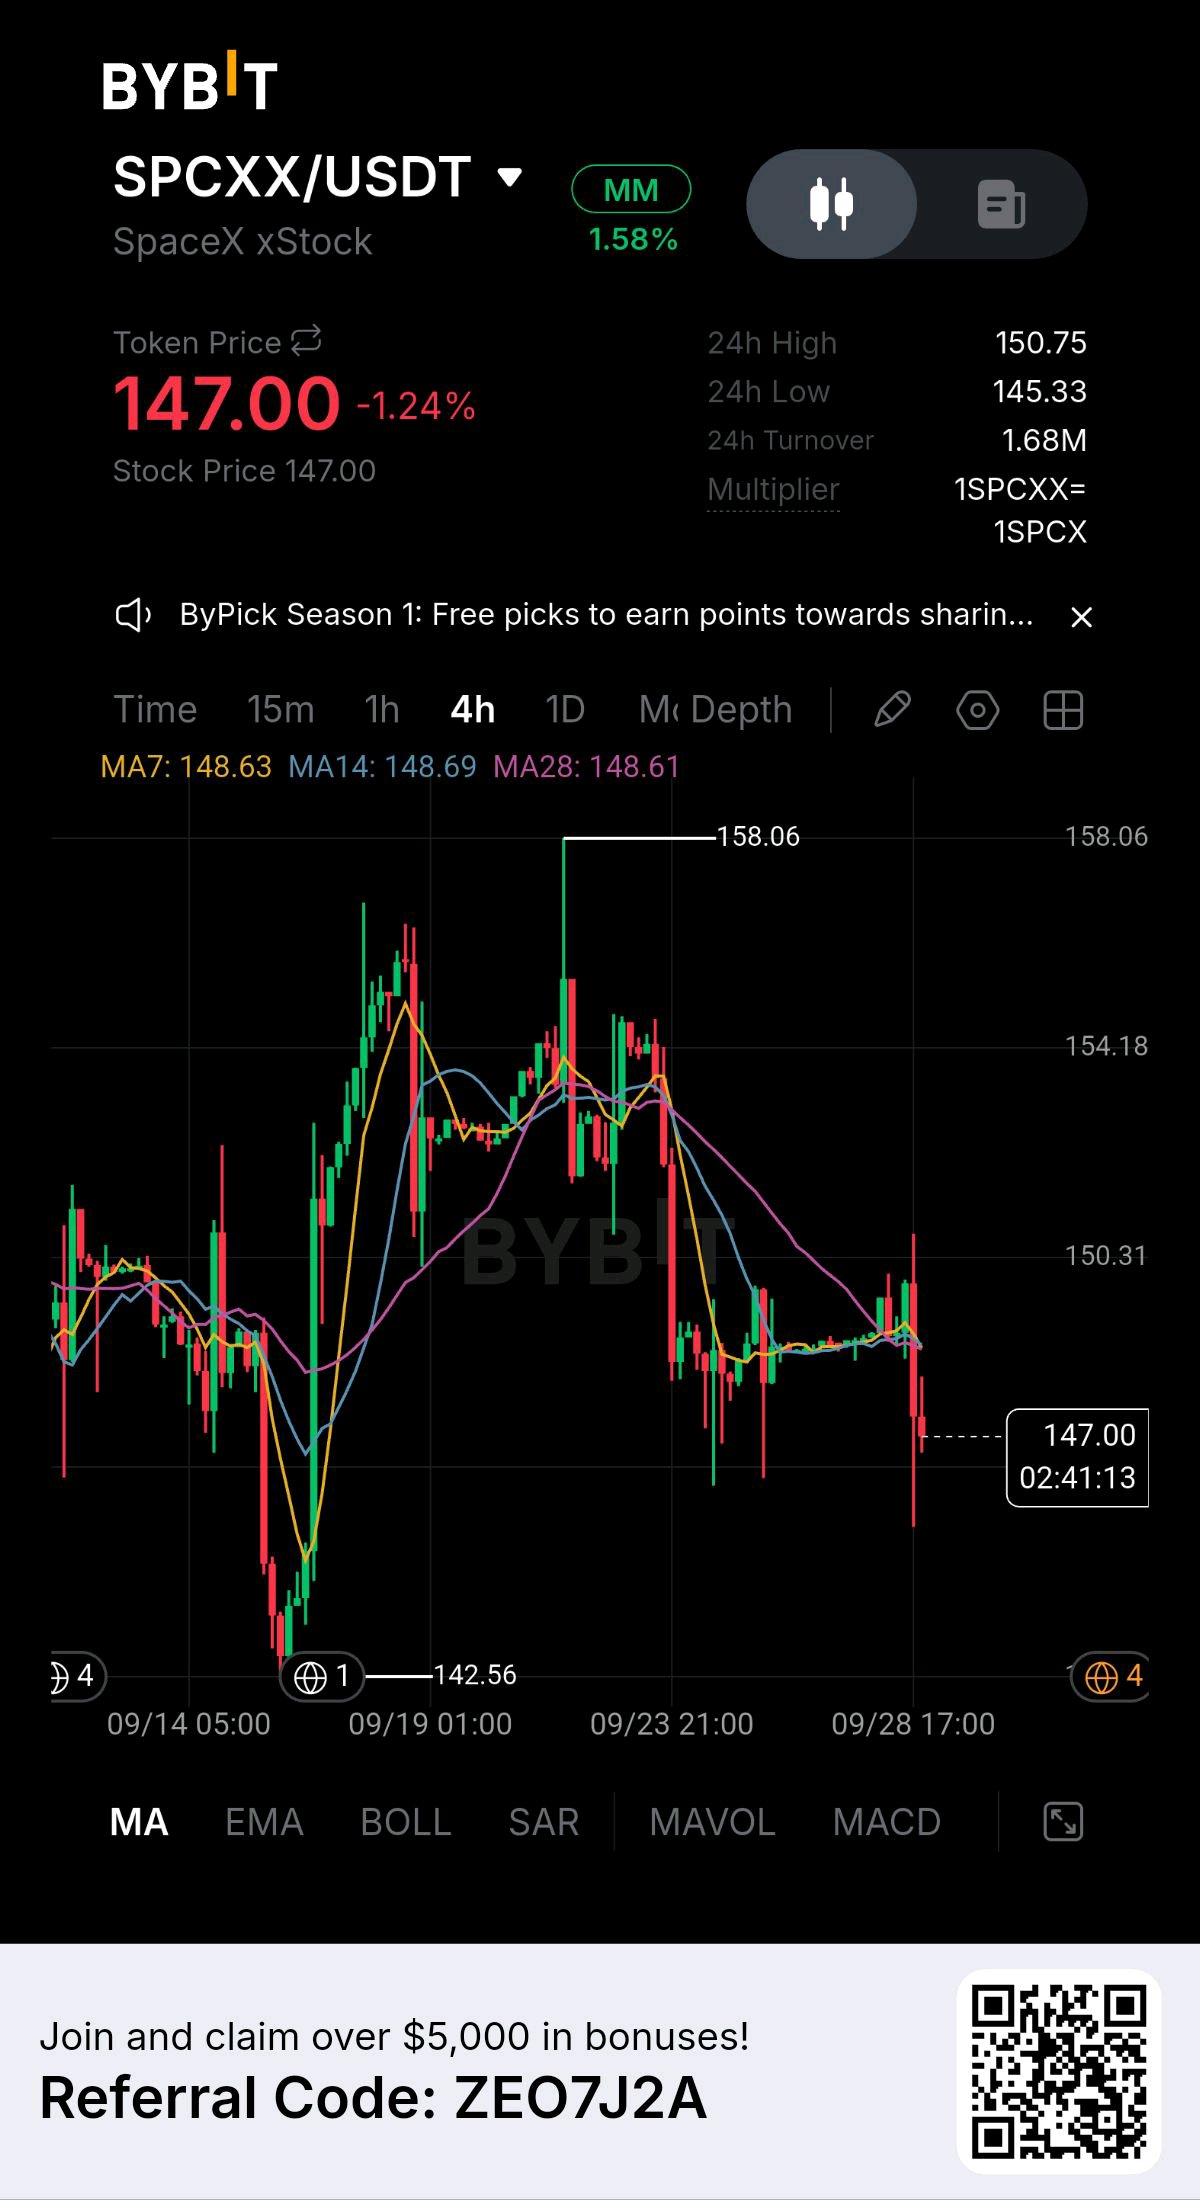
SPCXX is showing a clear loss of short-term momentum on the 4H chart, with price now trading around $147 after failing to maintain the higher levels seen earlier in the structure. The previous recovery toward the $154–$155 area was rejected, and price has gradually moved lower from there. The latest candle has pushed below the nearby moving-average cluster, where MA7, MA14, and MA28 are all sitting around $148.6–$148.7. This makes the $148.5–$150 zone an important area for the next reaction. If buyers can reclaim it, the recent weakness could stabilize; otherwise, the market may continue testing lower support. The broader 4H structure is currently more range-bound than strongly directional, with $142.56 acting as the major visible downside reference and $154–$158 forming the main upper resistance region. Key Levels Immediate Support: $145.30–$146.00 Major Support: $142.56 Resistance: $148.50–$150.30 Major Resistance: $154.00–$155.00 Higher Resistance: $158.06 The $145.30–$146.00 area is important because it is close to the recent 24H low. Holding this zone could give buyers an opportunity to attempt a recovery back toward the moving-average cluster. Bullish Scenario If SPCXX stabilizes above $145.30–$146.00 and reclaims $148.50–$150.30, the first upside test would be around $150.30. A sustained move above $150.30 could bring $154–$155 back into focus. This area has previously produced selling pressure, so a clean breakout would require strong follow-through rather than only a short-term spike. If buyers eventually reclaim $155, the next major reference on the chart is around $158.06. Bearish Scenario Failure to recover $148.50–$150.30 could keep the short-term structure under pressure. If price breaks below $145.30 with increasing selling activity, the next major level to watch would be $142.56, which marks the previous significant low visible on the chart. A sustained break below $142.56 would weaken the current range structure further and indicate that sellers are extending the downside move. Moving Average Structure MA7: $148.63 MA14: $148.69 MA28: $148.61 All three moving averages are clustered tightly around $148.6, making this zone particularly important. Price is currently below the entire cluster, so reclaiming it would provide the first sign of short-term stabilization. For now, the structure is: $145.30–$146.00 → Immediate support $142.56 → Major support $148.50–$150.30 → Key recovery zone $154–$155 → Major resistance $158.06 → Higher resistance SPCXX is now at a decision area after the latest decline. The reaction around $145–$146 should determine whether buyers can defend the lower range and attempt a recovery, while the $148.5–$150.3 region remains the key level that needs to be reclaimed for the short-term structure to improve. $SPCXXUSDT #ByXIMPACT #BybitAIBestReplies #PolyMarketPreIPO #ByPickMakeYourPickCount #BybitOdds

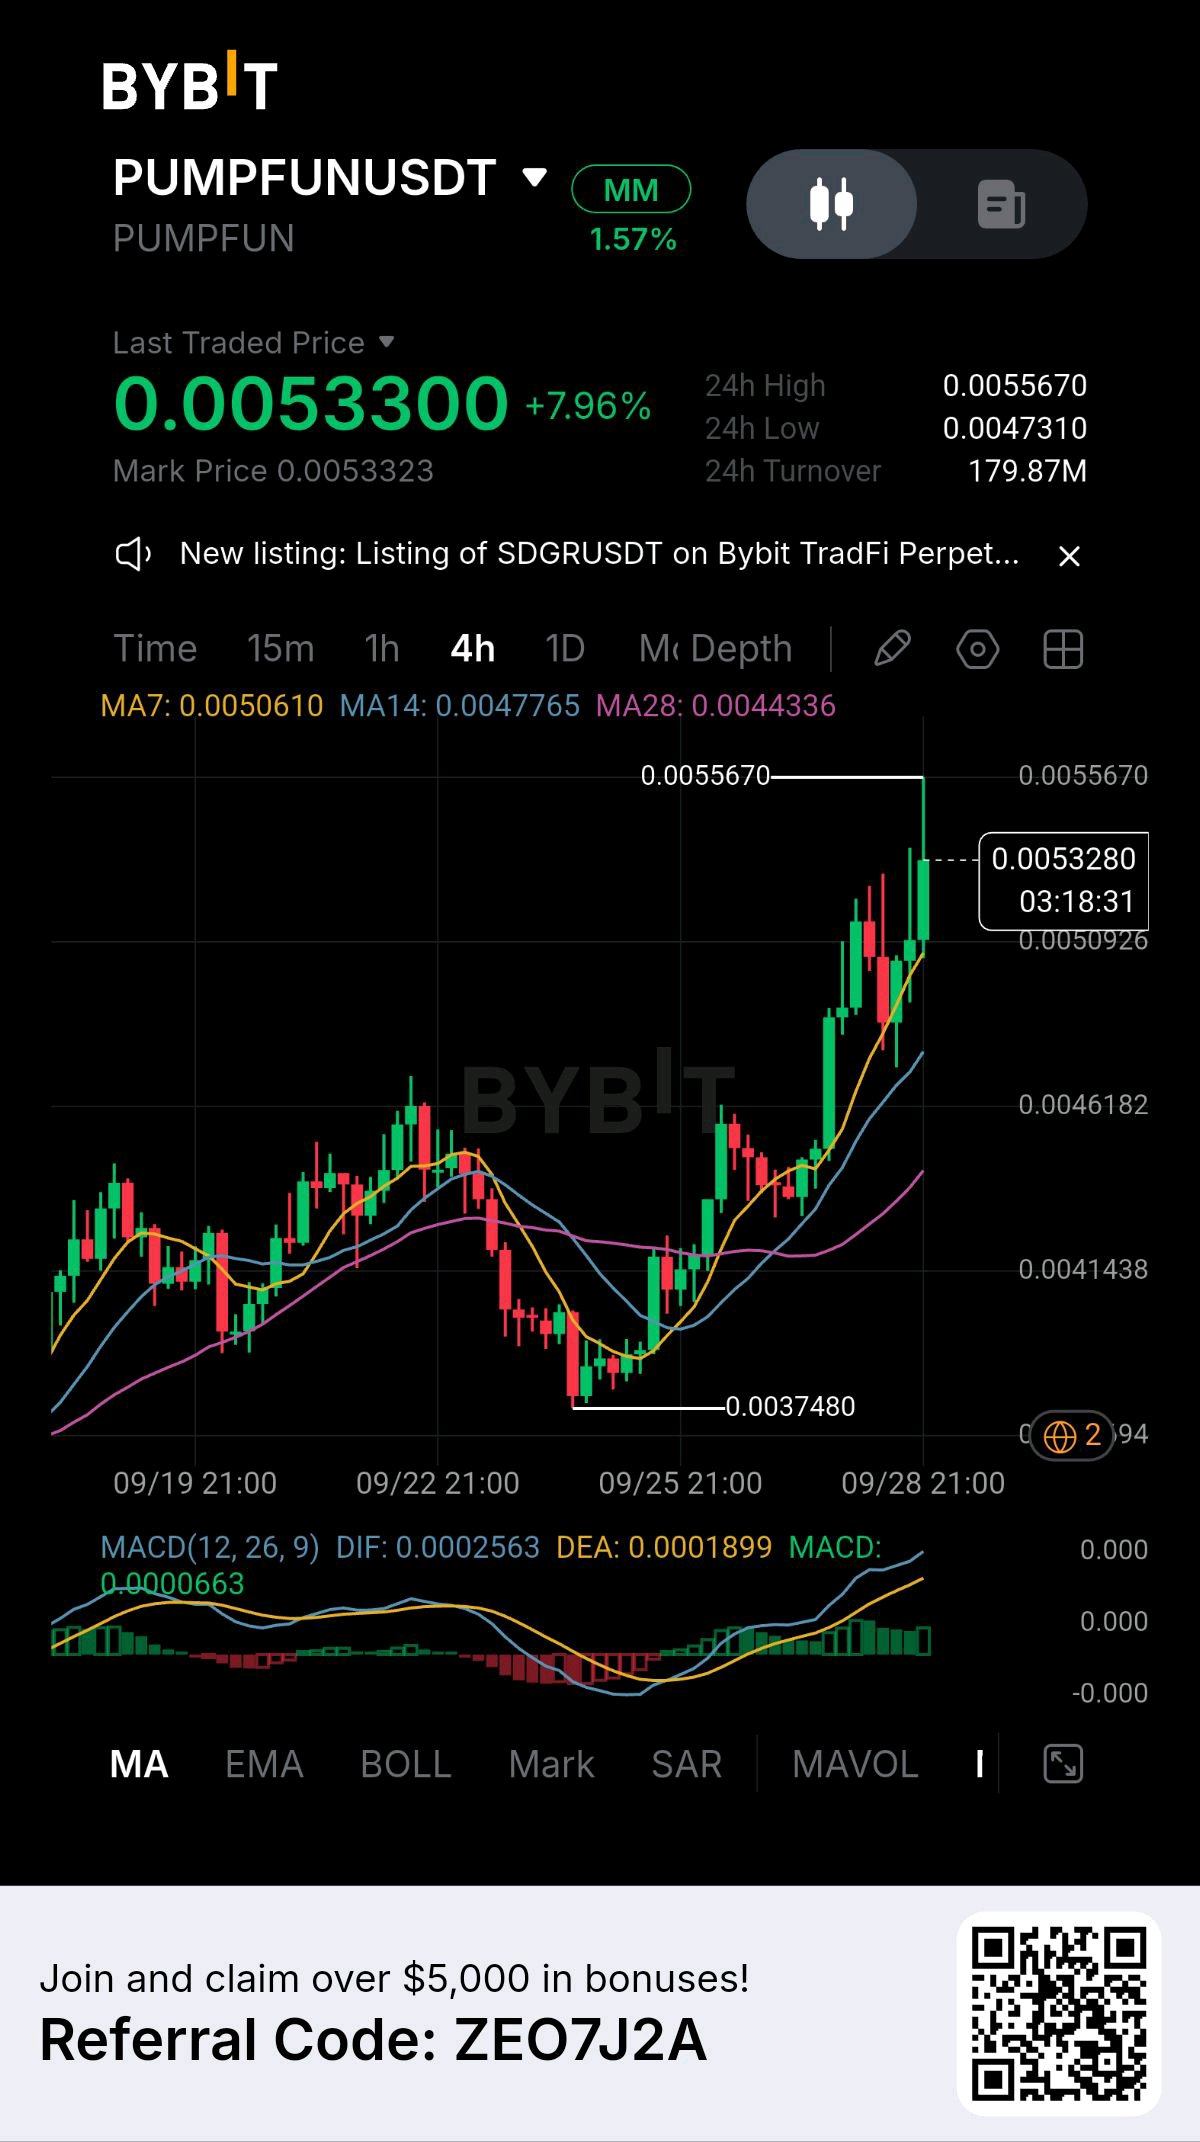
PUMPFUN has pushed through its recent consolidation with strong momentum, moving from the $0.00375 area toward a new local high around $0.00557. Price is now holding near $0.00533 after a sharp upside expansion, while the 4H moving averages remain clearly below the current market. The latest structure shows buyers maintaining higher highs and higher lows after the earlier base formation. However, the rejection from $0.00557 means sellers are already active around the current high. The next move will depend on whether PUMPFUN can hold the breakout area and turn the recent resistance into support. The short-term structure remains constructive, but price is now extended from the lower moving averages, so the reaction around $0.00510–0.00530 is important. Key Levels Support: $0.00505–0.00510 Major Support: $0.00475–0.00480 Lower Support: $0.00460–0.00465 Resistance: $0.00550–0.00557 The $0.00505–0.00510 area is the first zone to watch, sitting close to the MA7 around $0.005061. If buyers defend this area, the current structure can remain strong and another attempt toward $0.00557 becomes possible. Bullish Scenario A clean move back above $0.00550 followed by a breakout of $0.00557 would confirm a new high on the current 4H structure. For stronger confirmation, price should hold above the breakout instead of immediately falling back into the previous range. Continued positive MACD momentum would also support the possibility of further upside. Bearish Scenario If PUMPFUN loses $0.00505 with increasing selling pressure, the next important area comes around $0.00475–0.00480. A deeper correction could then test $0.00460–0.00465, where the broader moving-average structure becomes more relevant. A sustained breakdown below these zones would weaken the recent breakout and could bring price back toward the previous consolidation. Momentum Check MA7: $0.005061 MA14: $0.004777 MA28: $0.004434 MACD remains positive, with the histogram still showing bullish momentum. However, after the recent expansion, consolidation would be normal if buyers need time to build another base. The main levels remain: $0.00505–0.00510 → Immediate support $0.00475–0.00480 → Major support $0.00460–0.00465 → Lower support $0.00550–0.00557 → Key resistance PUMPFUN is now testing the upper end of its recent range. Holding the breakout structure could keep buyers in control, while losing the nearby support would increase the chance of a deeper retracement. The reaction around $0.00510 and $0.00557 should provide the clearest confirmation for the next move. $PUMPUSDT #ByXIMPACT #ByPickMakeYourPickCount #PolyMarketPreIPO #BybitOdds #MakeYourMove

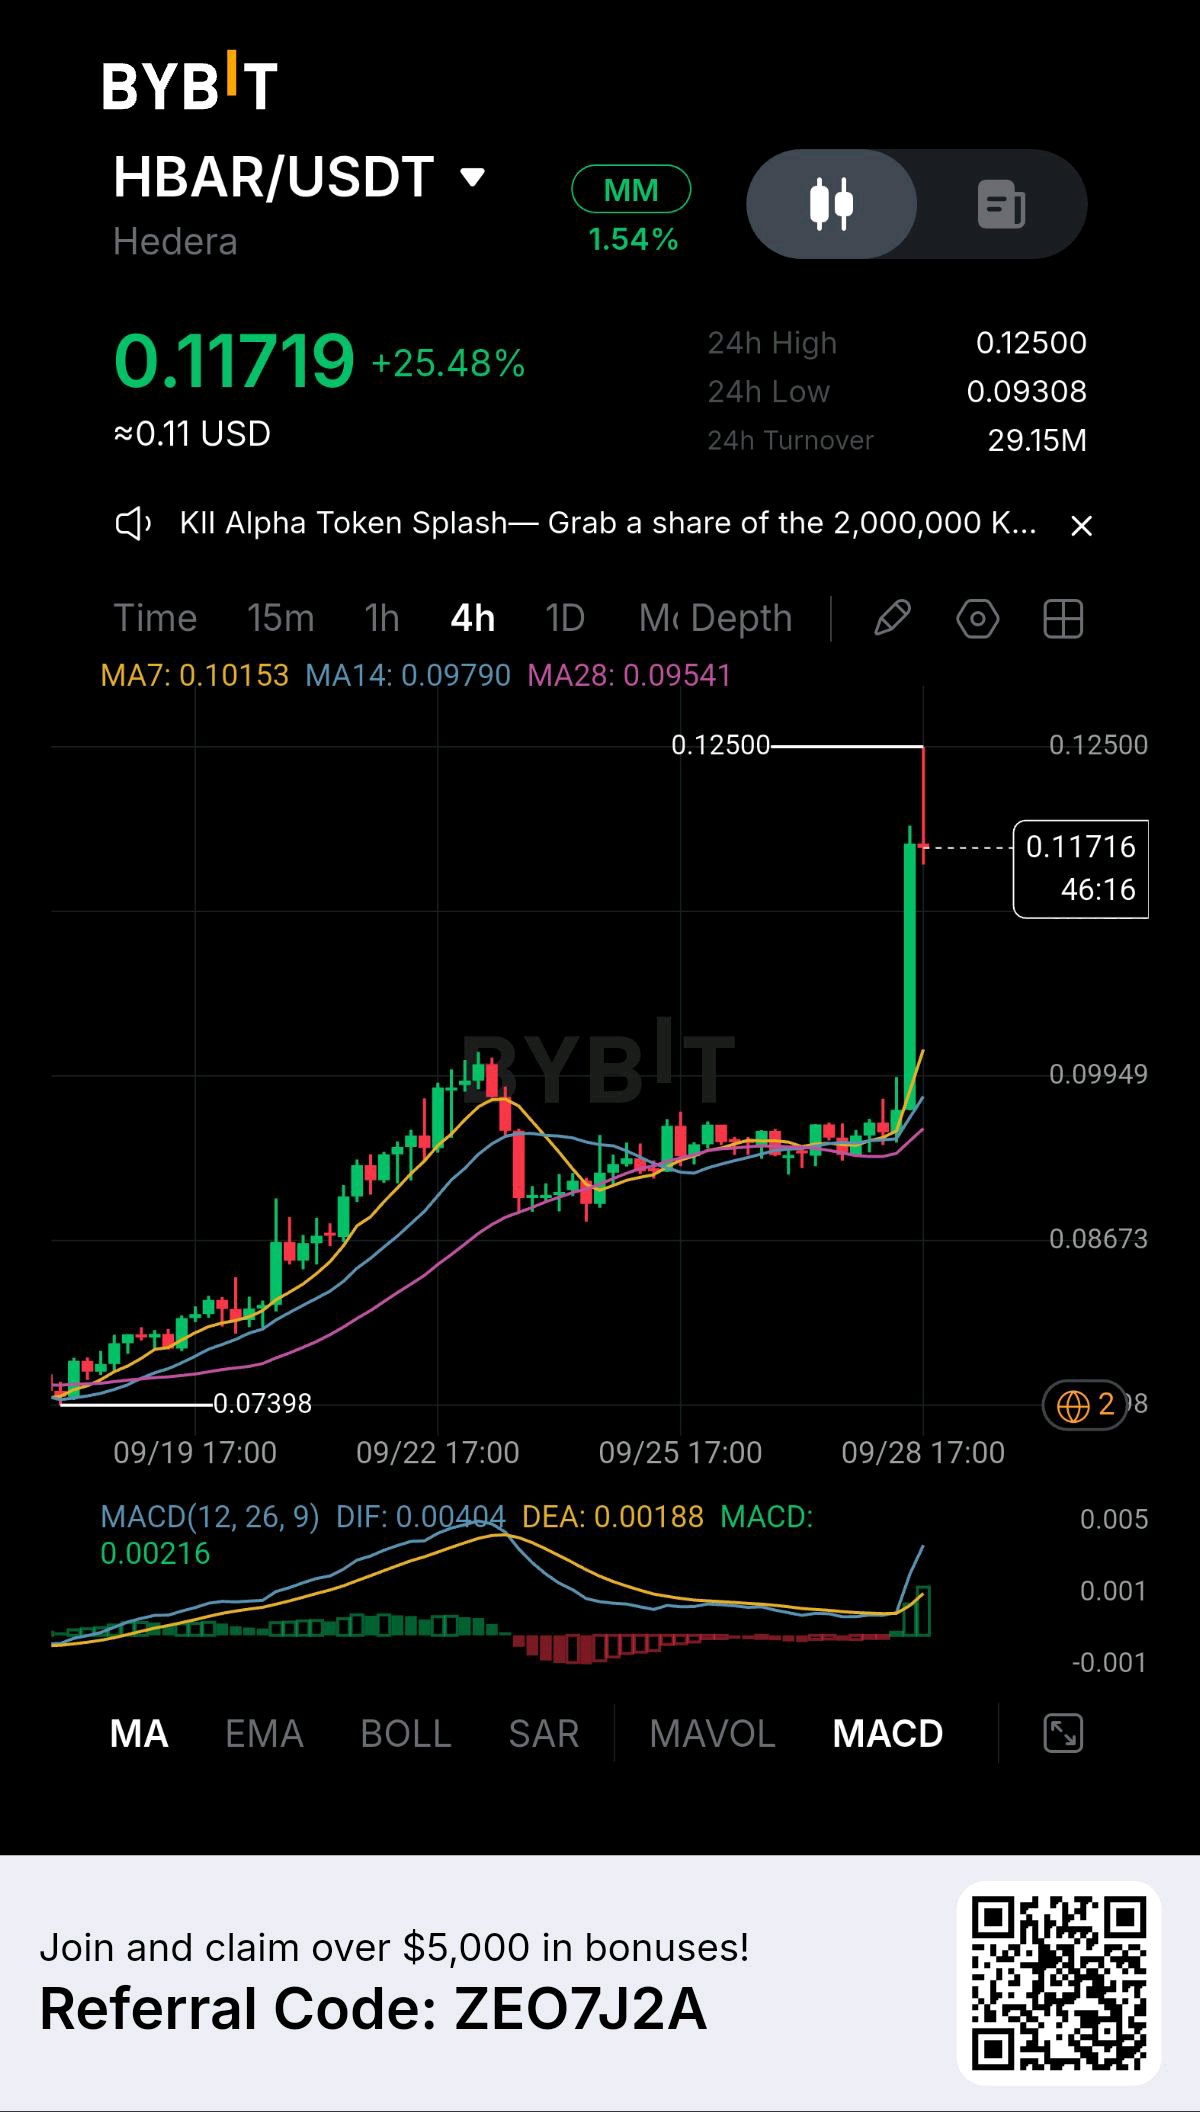
Hedera has made a sharp move out of its previous consolidation range, with HBAR now trading around $0.117 after reaching $0.125 on the latest 4H candle. The breakout came with strong momentum and a major expansion in price, while the moving averages have turned upward beneath the current market. MACD has also shifted strongly positive, supporting the recent momentum. However, after a move of more than 25%, the rejection from $0.125 is an important test. The key question now is whether HBAR can hold the breakout zone and build a higher low before attempting another move higher. The previous structure was relatively tight around $0.09–$0.10, but the latest candle pushed price decisively above that range. Key Levels Support: $0.108–0.112 Major Support: $0.099–0.102 Resistance: $0.120–0.125 Major Breakout: Above $0.125 The $0.108–0.112 area is the first zone to watch after the recent expansion. Holding this region would help maintain the new bullish structure. The $0.099–0.102 area is more important if the pullback becomes deeper, as it sits close to the previous consolidation and the moving-average structure. Bullish Scenario If HBAR holds above $0.108–0.112 and buyers return with strong volume, price could make another attempt toward $0.120–0.125. A clean break above $0.125 would mark a new high on this 4H structure. For the breakout to have stronger confirmation, price should hold above the level instead of immediately falling back into the previous range. The continuation would become more convincing if MACD remains positive while volume expands with the move. Bearish Scenario A rejection from $0.120–0.125 followed by a loss of $0.108 could lead to a deeper retracement. In that case, $0.099–0.102 becomes the next major area to monitor. A sustained move below that zone would weaken the recent breakout structure and could bring the market back into the previous consolidation range. Momentum Check The moving averages are strongly aligned beneath price: MA7: $0.10153 MA14: $0.09790 MA28: $0.09541 MACD has also turned positive after spending time near the lower side of the indicator, showing a clear increase in short-term momentum. Still, momentum alone does not guarantee continuation. After such a fast move, a period of consolidation or a deeper pullback would not be unusual. For now, the main levels are: $0.108–0.112 → Immediate support $0.099–0.102 → Major support $0.120–0.125 → Resistance $0.125 → Breakout level HBAR has already shown strong momentum, but the next move depends on whether buyers can defend the breakout structure. Holding the nearby support and reclaiming $0.125 would strengthen the continuation setup, while losing the support zones would signal that the market needs more time to consolidate. $HBARUSDT #ByXIMPACT #BybitAIBestReplies #PolyMarketPreIPO #ByPickMakeYourPickCount #NewFinancialPlatform

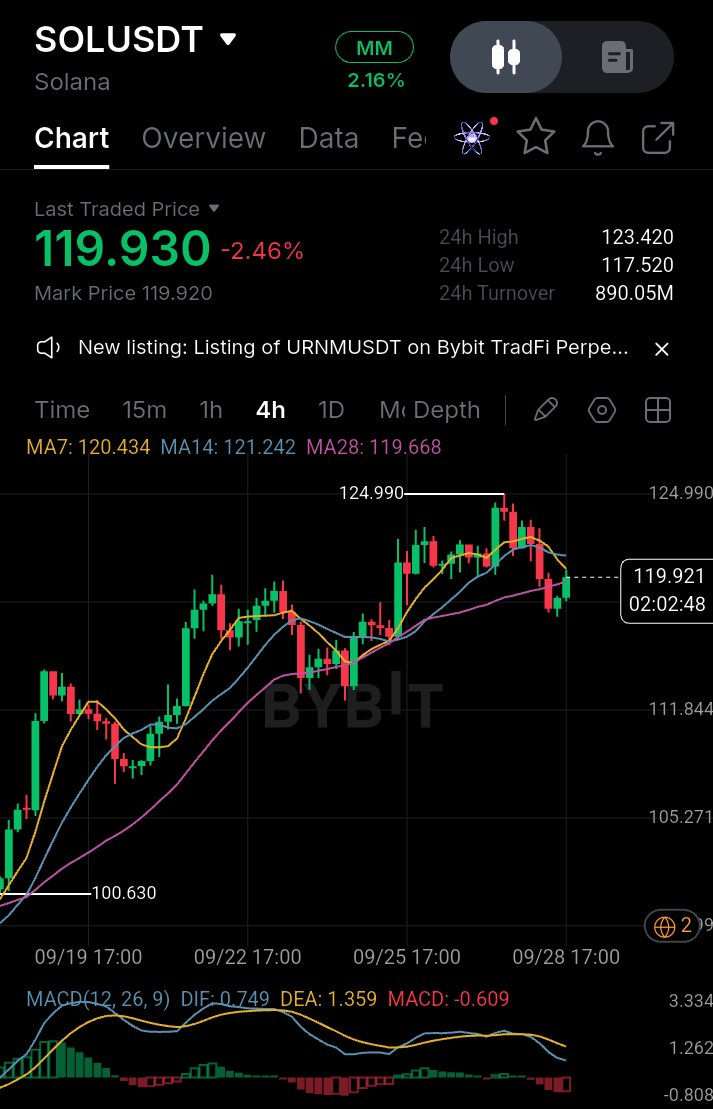
Solana is demonstrating a distinct phase of localized consolidation across the 4-hour timeframe following a strong impulse expansion from the $100.630 baseline toward the local high at $124.990. The current market structure reflects a healthy cooling-off period, with price action compressing near $119.930 as market participants absorb sell pressure following recent upside tests. While short-term intraday momentum indicates slight distribution, the broader directional trajectory continues to defend the higher-low sequence established throughout the prior rally. From a moving average framework, the price has temporarily slipped beneath both the 7-period Simple Moving Average sitting at $120.434 and the 14-period Simple Moving Average at $121.242, creating immediate overhead resistance. However, the crucial 28-period Simple Moving Average anchored at $119.668 is acting as dynamic baseline support directly underneath current price levels. Momentum oscillators corroborate this short-term pause, with the MACD histogram printing at -0.609 in negative territory as the DIF line (0.749) trades below the DEA signal line (1.359), signaling momentum deceleration rather than structural damage. The critical inflection zone rests between the 28-period SMA at $119.668 and the 24-hour low at $117.520, forming a high-confluence demand cluster. A sustained defense of this dynamic baseline combined with a 4-hour candle reclamation back above the MA7 ($120.434) and MA14 ($121.242) would re-ignite bullish expansion toward the $123.420 level and reopen the path for a retest of $124.990. Conversely, if sellers force a decisive close below the MA28 support zone, Solana could experience a deeper structural correction toward the next horizontal demand level at $111.844. $SOLUSDT #ByXIMPACT #BybitAIBestReplies #PolyMarketPreIPO #ByPickMakeYourPickCount #MakeYourMove