Zenix
Crypto Trader
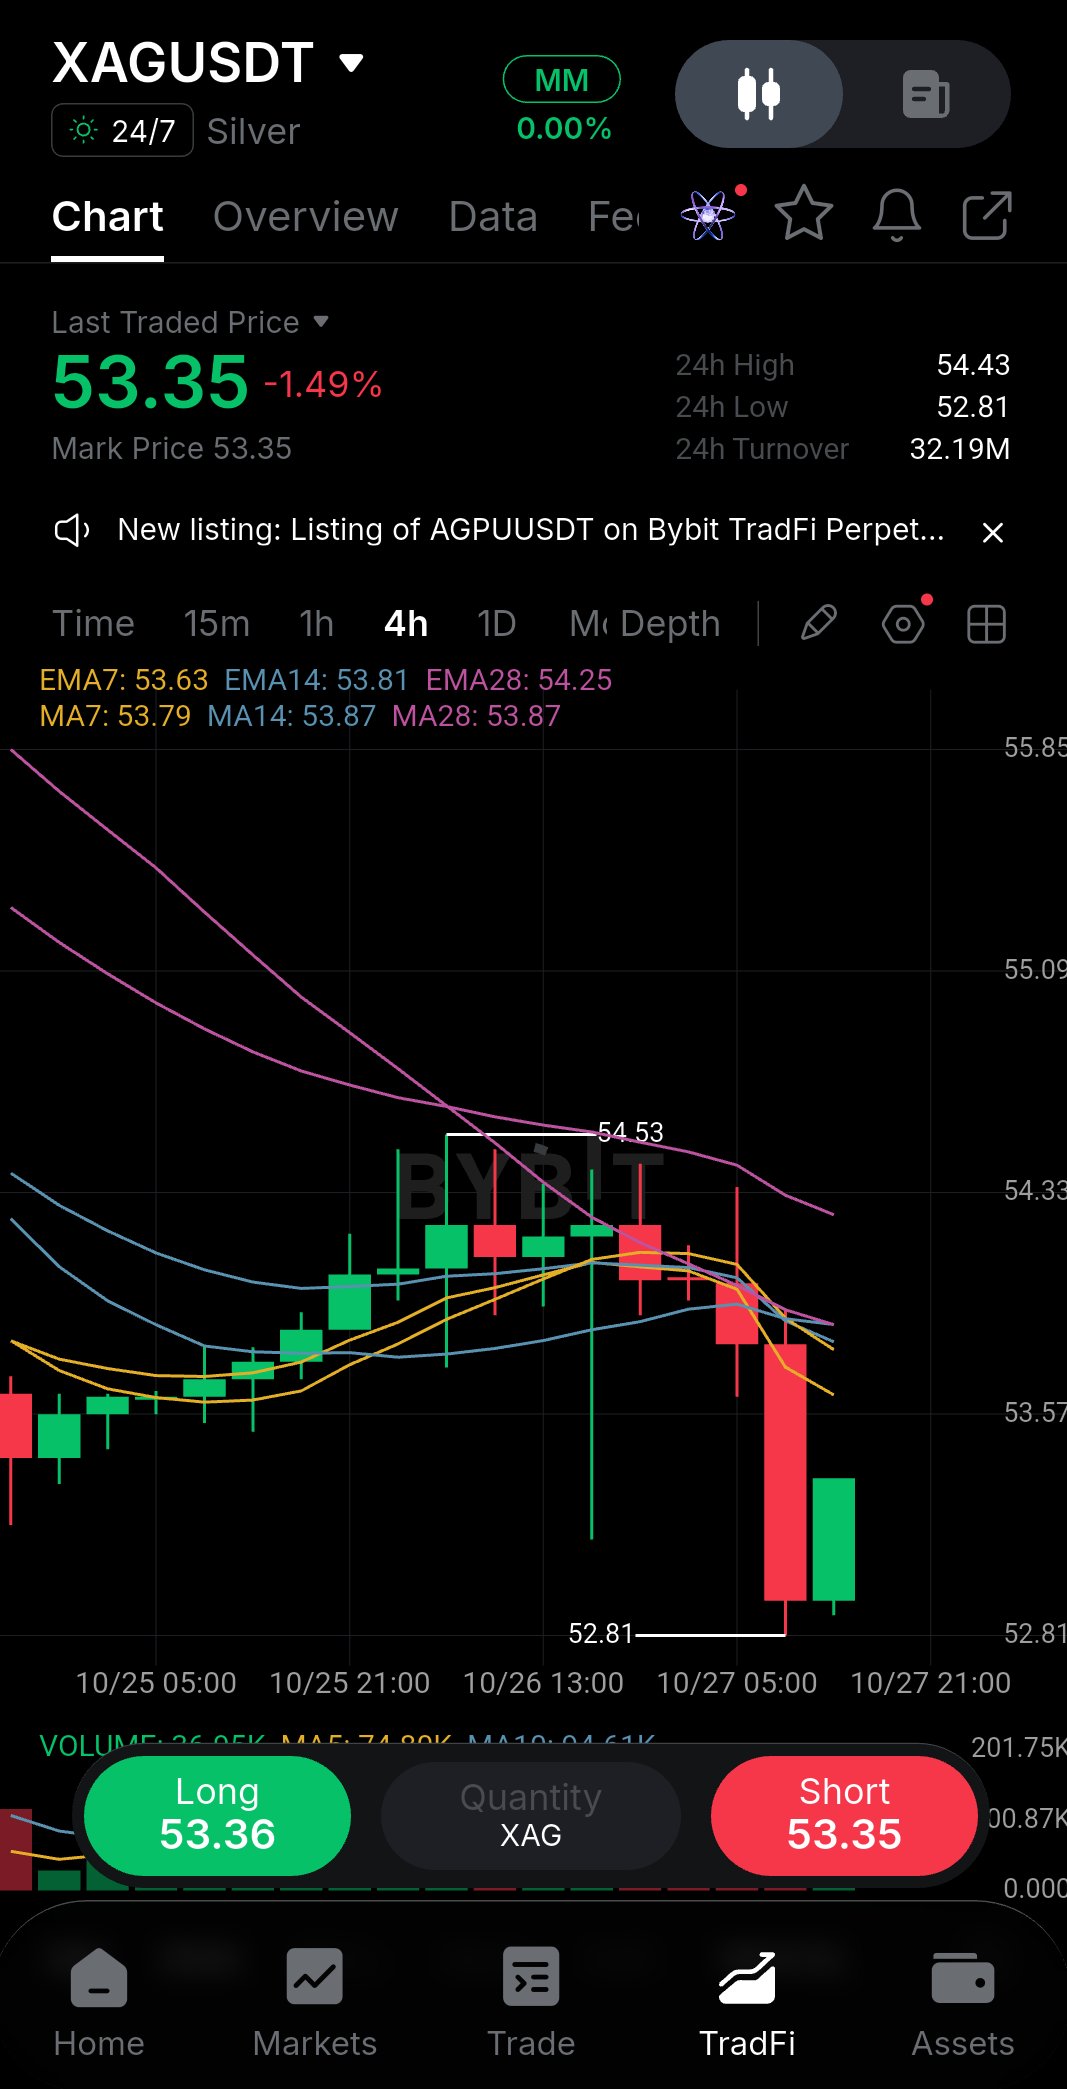
🥈 XAGUSDT | THE SILENT GIANT IS WAKING UP Most traders are watching BTC and ETH while Silver is quietly building a strong setup. Current Price: $53.23 24H Change: -1.88% A pullback into support does not automatically mean weakness. If the structure holds, this dip can become an opportunity. WHALE POSITIONING Whale Long Value: $18.57M Whale Short Value: $2.35M Long/Short Ratio: 7.9:1 Open Interest 30D Change: +14.4% Funding Rate: 0.015% The positioning is clearly tilted toward longs, while funding remains relatively controlled. TECHNICAL STRUCTURE Key Support Zone: $52.81 to $53.06 This area lines up with multiple technical levels including Bollinger support, VWAP, Volume Profile and Fibonacci retracement. As long as price continues to hold this zone, the bullish structure remains valid. TRADE PLAN Asset: XAGUSDT Entry: $52.81 to $53.23 Stop Loss: $52.10 TP1: $54.31 TP2: $57.36 TP3: $59.41 TP4: $64.91 The main idea is simple. Price is pulling back toward a major support zone while whale positioning remains heavily long and open interest continues to expand. If support holds, the next major levels to watch are $57, $59 and eventually $64. If $52.10 breaks decisively, the bullish setup is invalidated and risk should be controlled. Silver can move slowly for a long time, then accelerate very quickly. Manage your position size and never risk more than you can afford to lose. $XAUTUSDT #WSOT2026 #AnthropicS1Filing #IMPACTbyTrade #MyByXTake #ByXIMPACT

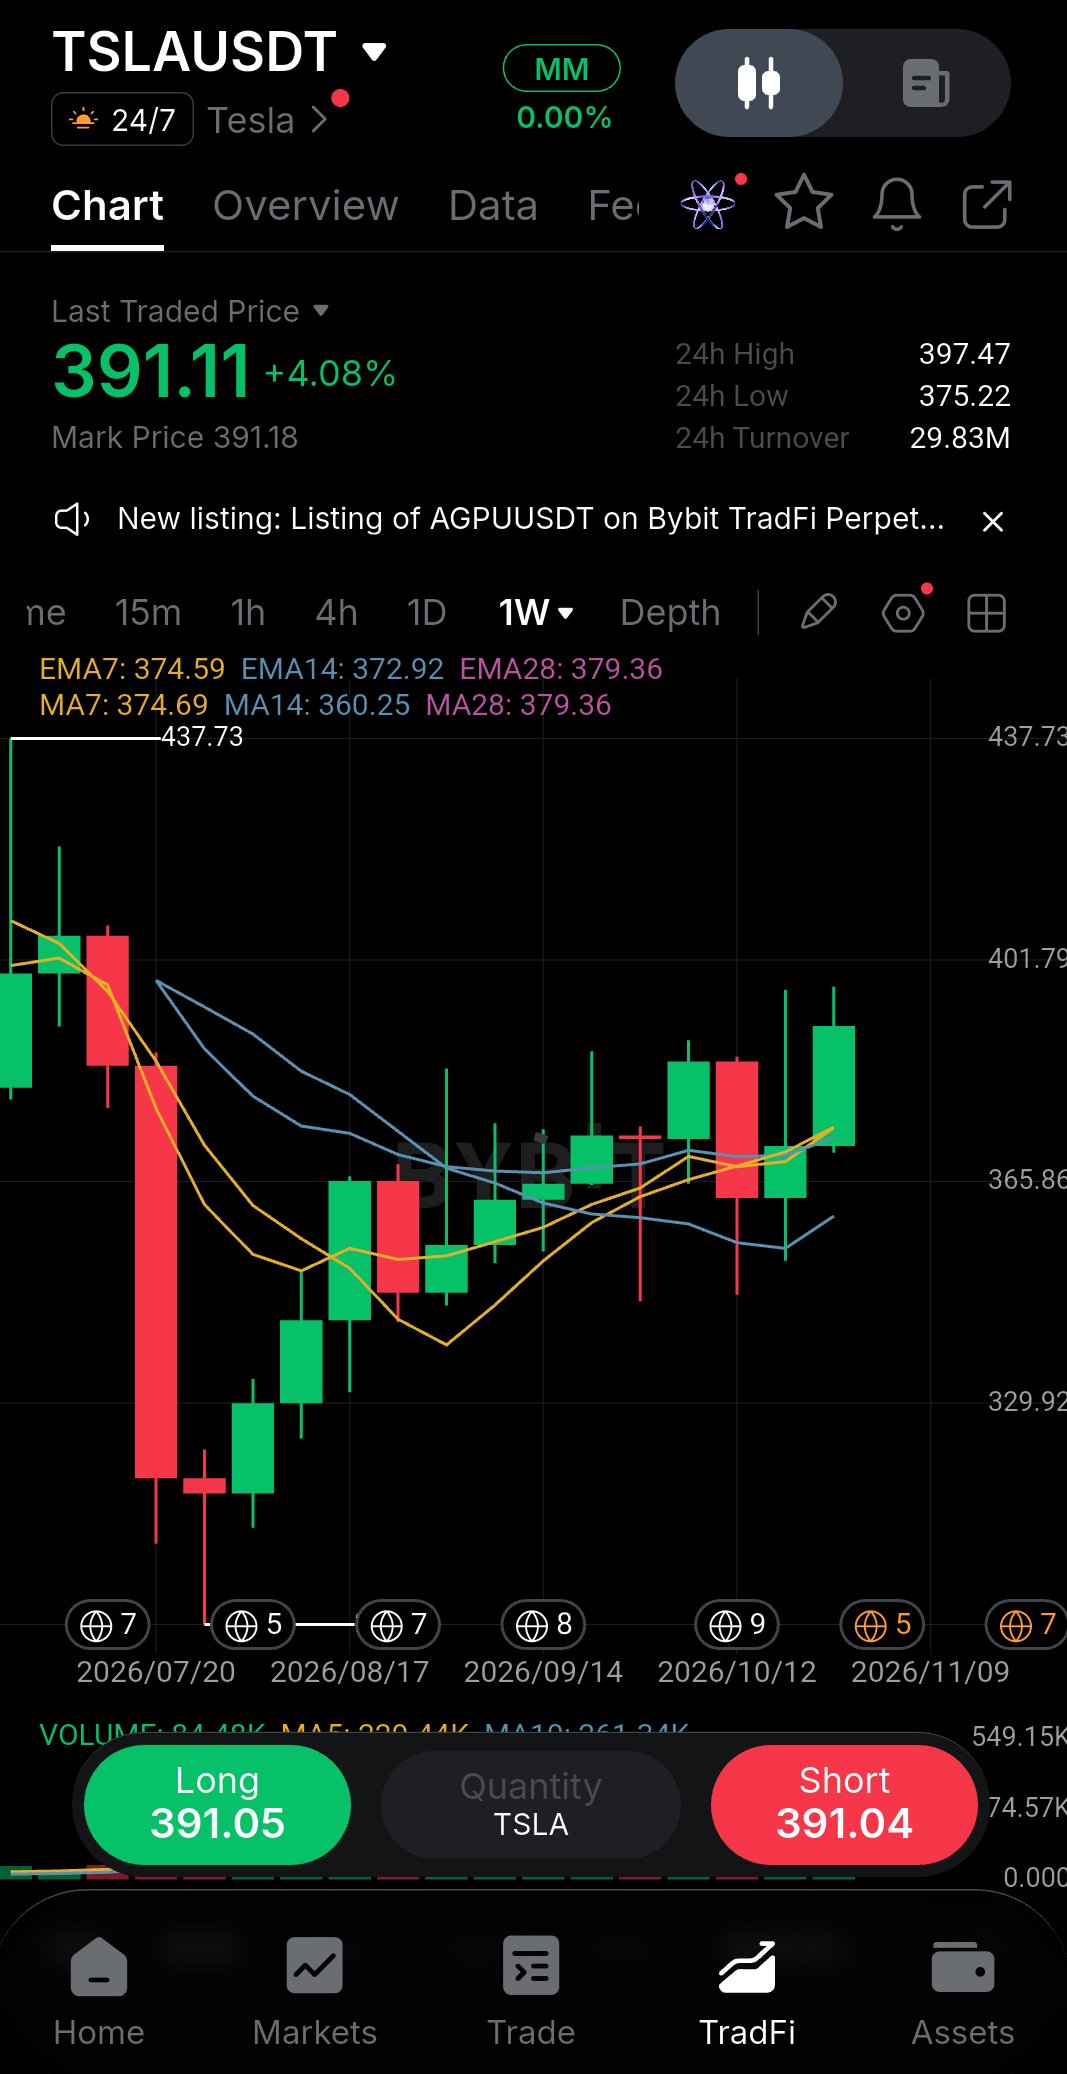
TSLAUSDT just reclaimed the weekly moving averages. But I'm not calling it a reversal yet. Price is at 391.11 after a strong green weekly candle. Look at the bigger picture: a heavy drop from the 437 high down to the ~295 area, then a slow climb of higher lows. That's a recovery, and it has pushed back above the MA/EMA cluster around 373-380. Here's the catch: the weekly candle hasn't closed yet, and 397 (the recent high) is still sitting right above price. One strong candle is not a trend change. I want to see the close, and then a retest. Key levels 391.11 - Current price 397.47 - Recent high / first resistance 437.73 - Major swing high 379.36 - EMA28 / MA28 374-375 - EMA7 / MA7 zone 360 - MA14 support 347 - Recent weekly low Bullish confirmation: weekly close above 380, then a clean break and hold above 397.5. That puts 437 back in focus. Bearish confirmation: rejection at 397 and a weekly close back below 374. A break under 360 would suggest the bounce has failed and expose 347. My plan (not chasing the green candle): 📍 Entry Zone: 374 - 380 (retest of the MA cluster) 🛑 Stop Loss: 359 (below MA14) 🎯 Target 1: 397.5 🎯 Target 2: 437 Risk-to-reward to Target 2 is roughly 1:3. I'm watching the reaction at the retest, not predicting the move. Waiting for confirmation has saved me more money than chasing candles ever did. No setup is guaranteed, so respect your stop. Are you waiting for the pullback to the MAs, or do you think 397 breaks right now? 👇 $TSLAXUSDT #WSOT2026 #AnthropicS1Filing #IMPACTbyTrade #MyByXTake #ByXIMPACT
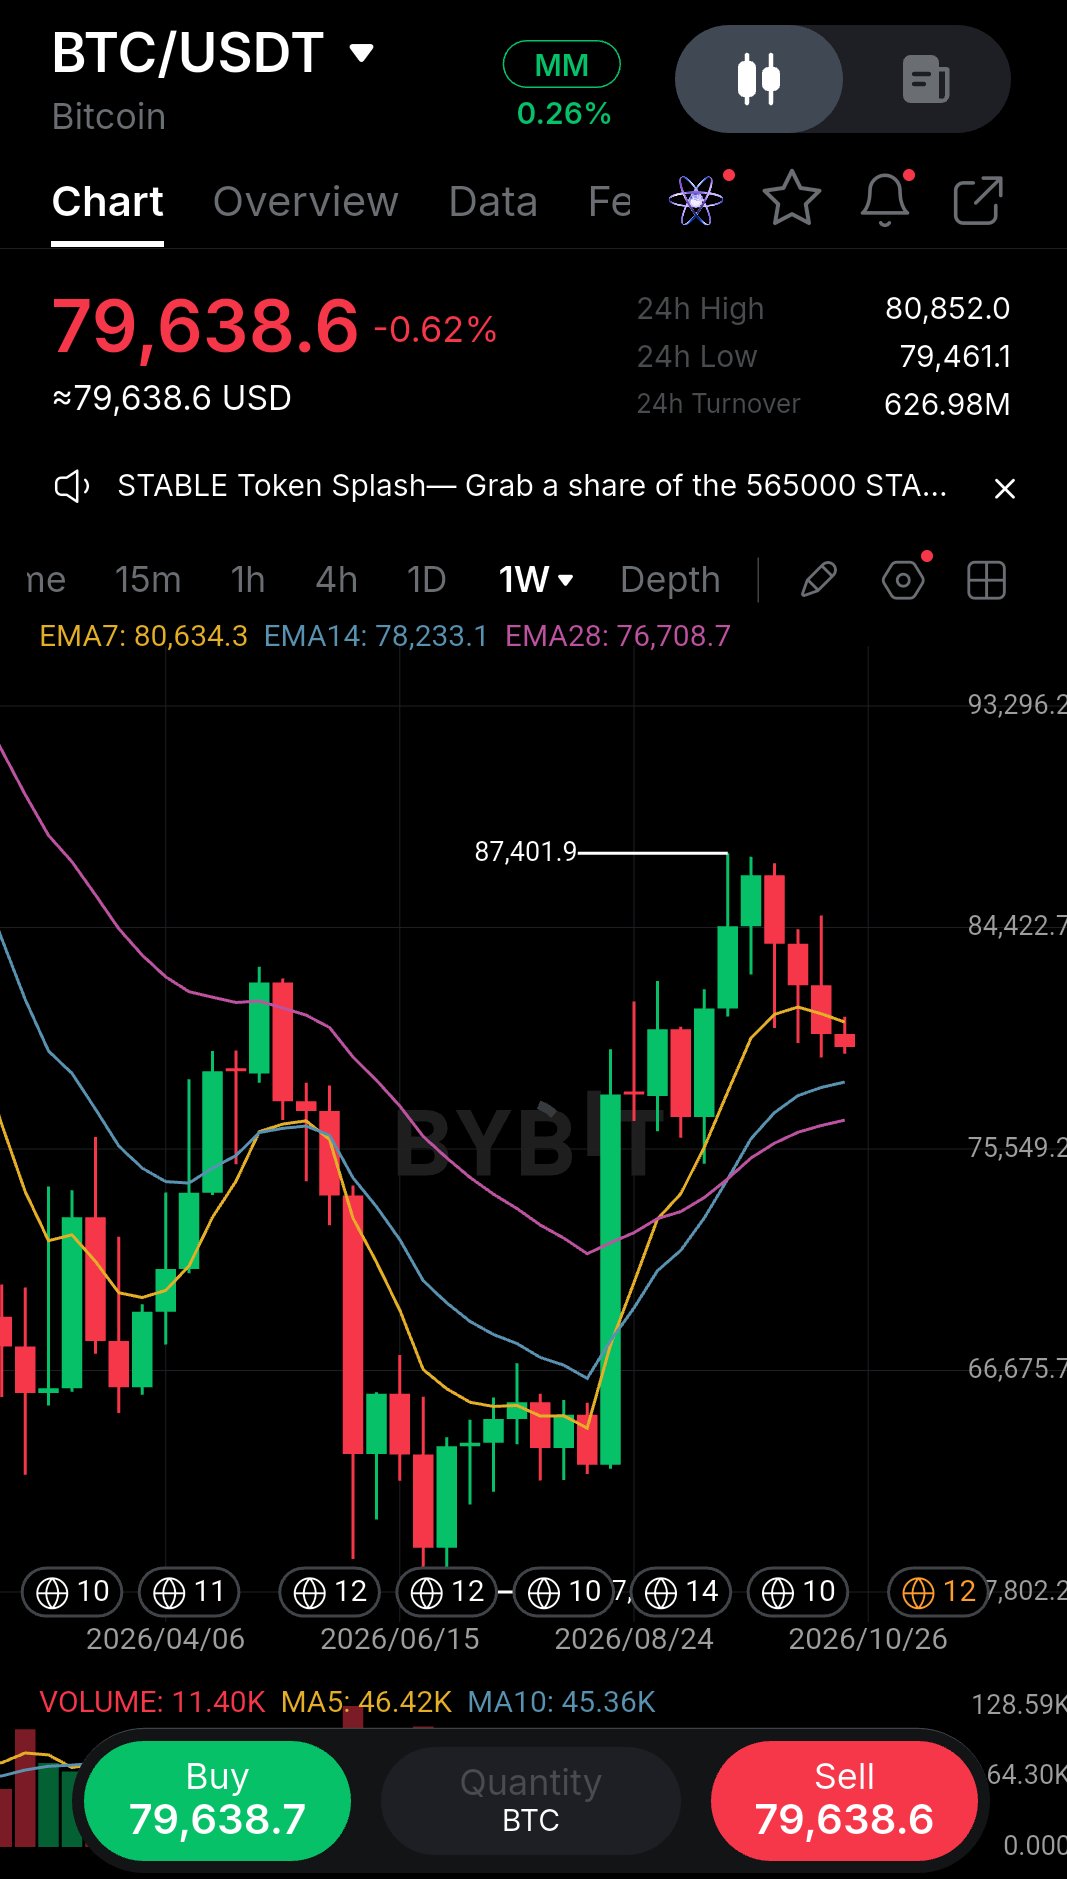
$87K was the top, and now the market is asking a big question. After one of the strongest weekly candles of the year, Bitcoin ran straight to $87,400. Since then, sellers have stepped in, and BTC is now sitting near $79,600 after several red weekly candles in a row. So the real question: is this the start of a reversal, or just a pause before the next leg? HOW WE GOT HERE Back in Aug-Sep, a huge green breakout candle launched price out of a long base around the mid-$60Ks. That move flipped the structure from sideways to bullish, and BTC kept climbing until it hit the $87.4K swing high. Since then, lower highs and red closes show the market cooling off after a big run. WHAT THE EMAs ARE SAYING EMA7 (~80.6K) > EMA14 (~78.2K) > EMA28 (~76.7K). The order is still bullish. EMA14 and EMA28 are still rising and sit below price, which is what a healthy trend looks like. The only warning sign is EMA7, which has flattened and is starting to curl down. That's short-term momentum fading, not a broken trend. KEY LEVELS 👇 🔴 Resistance: ~$80.6K (EMA7), then ~$84.4K, then $87.4K (swing high) 🟢 Support: ~$78.2K (EMA14), then ~$76.7K (EMA28), with the $75.5K zone as the last big line below BULL CASE 🟢 Buyers defend $78K, price reclaims EMA7 with a strong weekly close above $80.6K, and BTC retests $84K and then $87K. BEAR CASE 🔴 Weekly closes slip under EMA14, then lose $76.7K. That would signal a deeper correction toward $75K or lower and a weaker overall structure. MY VIEW Price is right at a decision zone. The trend is still bullish and this looks like a normal pullback, but it needs to prove itself. I'm not guessing the bottom. I'm waiting for the weekly close to confirm direction. ⚠️ Weekly charts reward patience. One candle won't make or break the trend, so manage your risk and let the market show its hand. $BTCUSDT #WSOT2026 #AnthropicS1Filing #IMPACTbyTrade #MyByXTake #ByXIMPACT

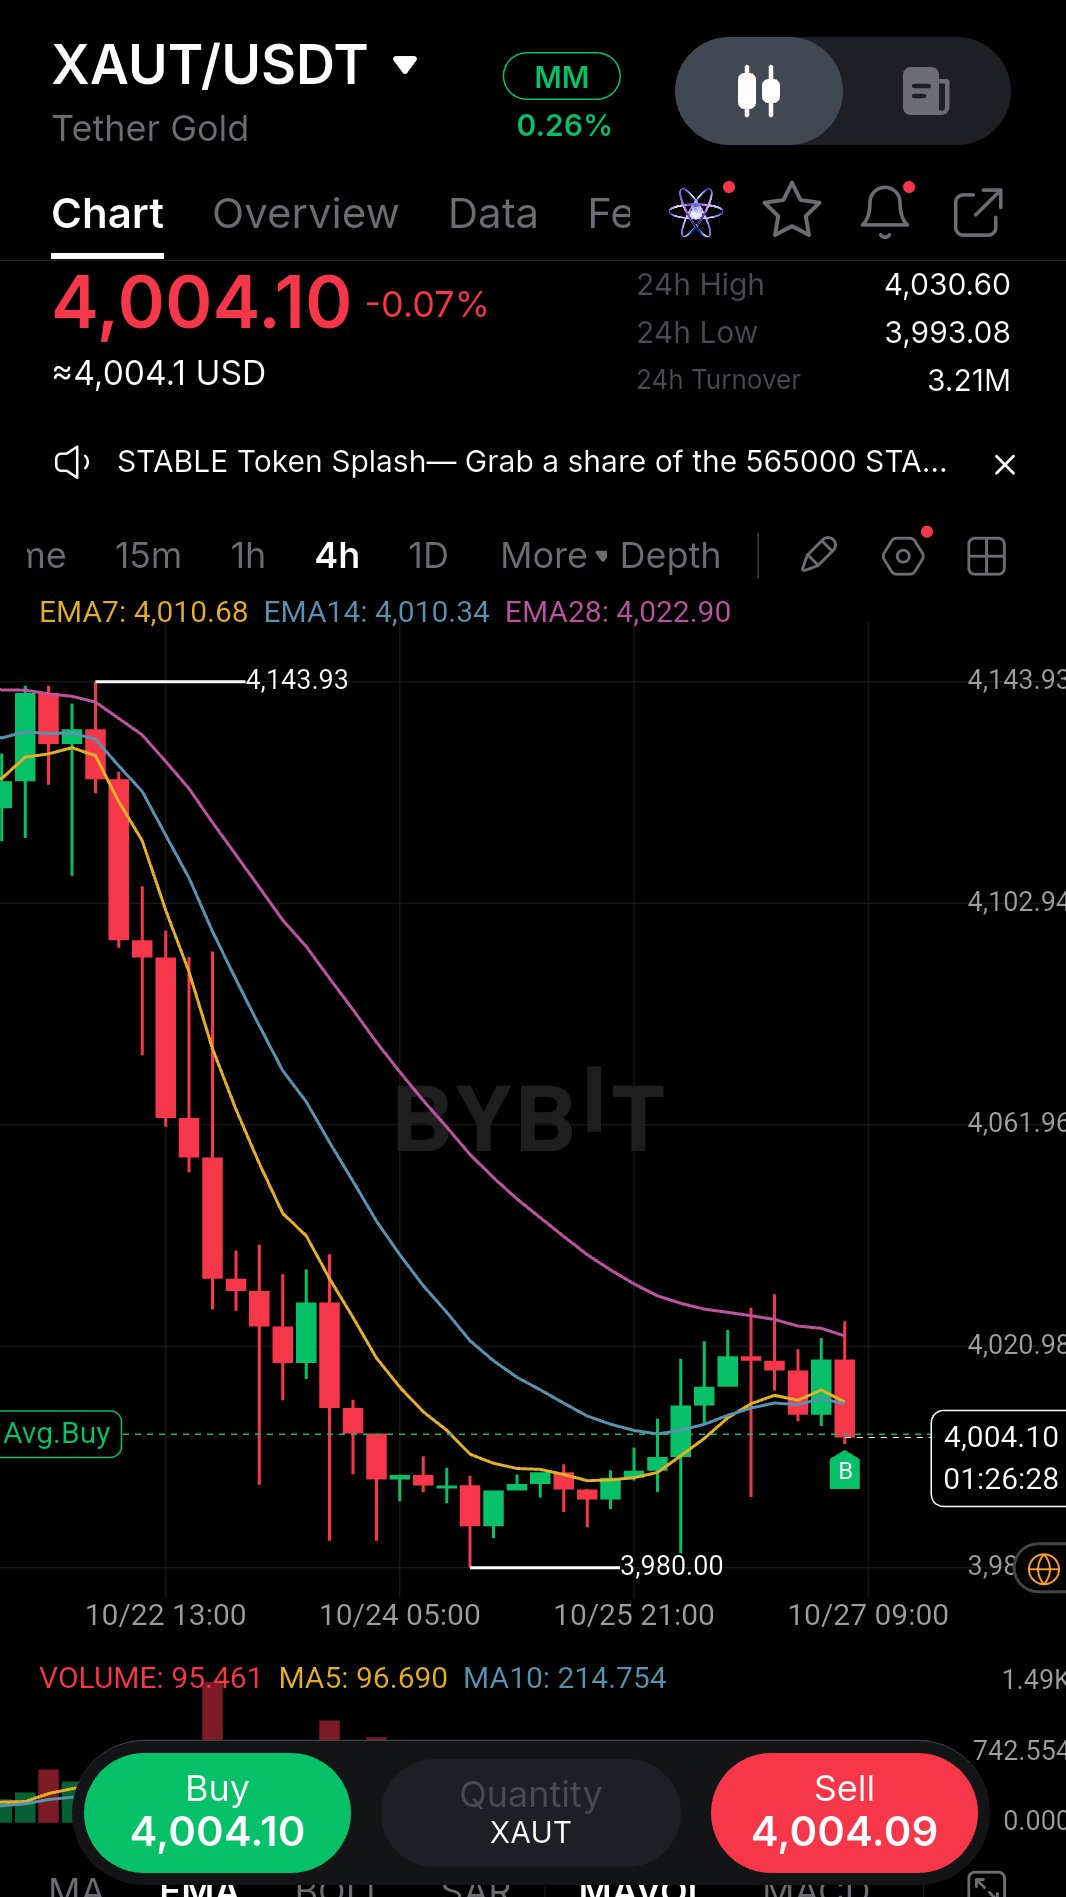
Mastering Gold On Bybit. The global bullion market meets high-speed crypto execution on Bybit. Tether Gold (XAUT) is currently hovering at $4,004.10, down a marginal -0.07% over the past session. Price action shows heavy battle lines drawn between the 24-hour peak of $4,030.60 and the crucial lower support floor sitting tightly at $3,993.08, with total turnover locked at 3.21M. Looking closely at the 4-hour chart structure, XAUT previously faced strong rejection from the $4,143.93 swing top, triggering a sharp descending wave down to a local base of $3,980.00. Following that sweep of liquidity, the asset has initiated a gradual structural recovery, currently consolidating right near the Exponential Moving Average cluster where EMA7 stands at 4,010.68, EMA14 at 4,010.34, and the overhead trend filter EMA28 resting at 4,022.90. This tight compression right beneath the moving averages signals that a decisive volatility expansion is loading. If buyers successfully flip the EMA28 resistance line into support, we could see a powerful push back toward mid-range targets. Lock in your positions and trade the gold standard with maximum efficiency. $XAUTUSDT #WSOT2026 #AnthropicS1Filing #IMPACTbyTrade #MyByXTake #ByXIMPACT

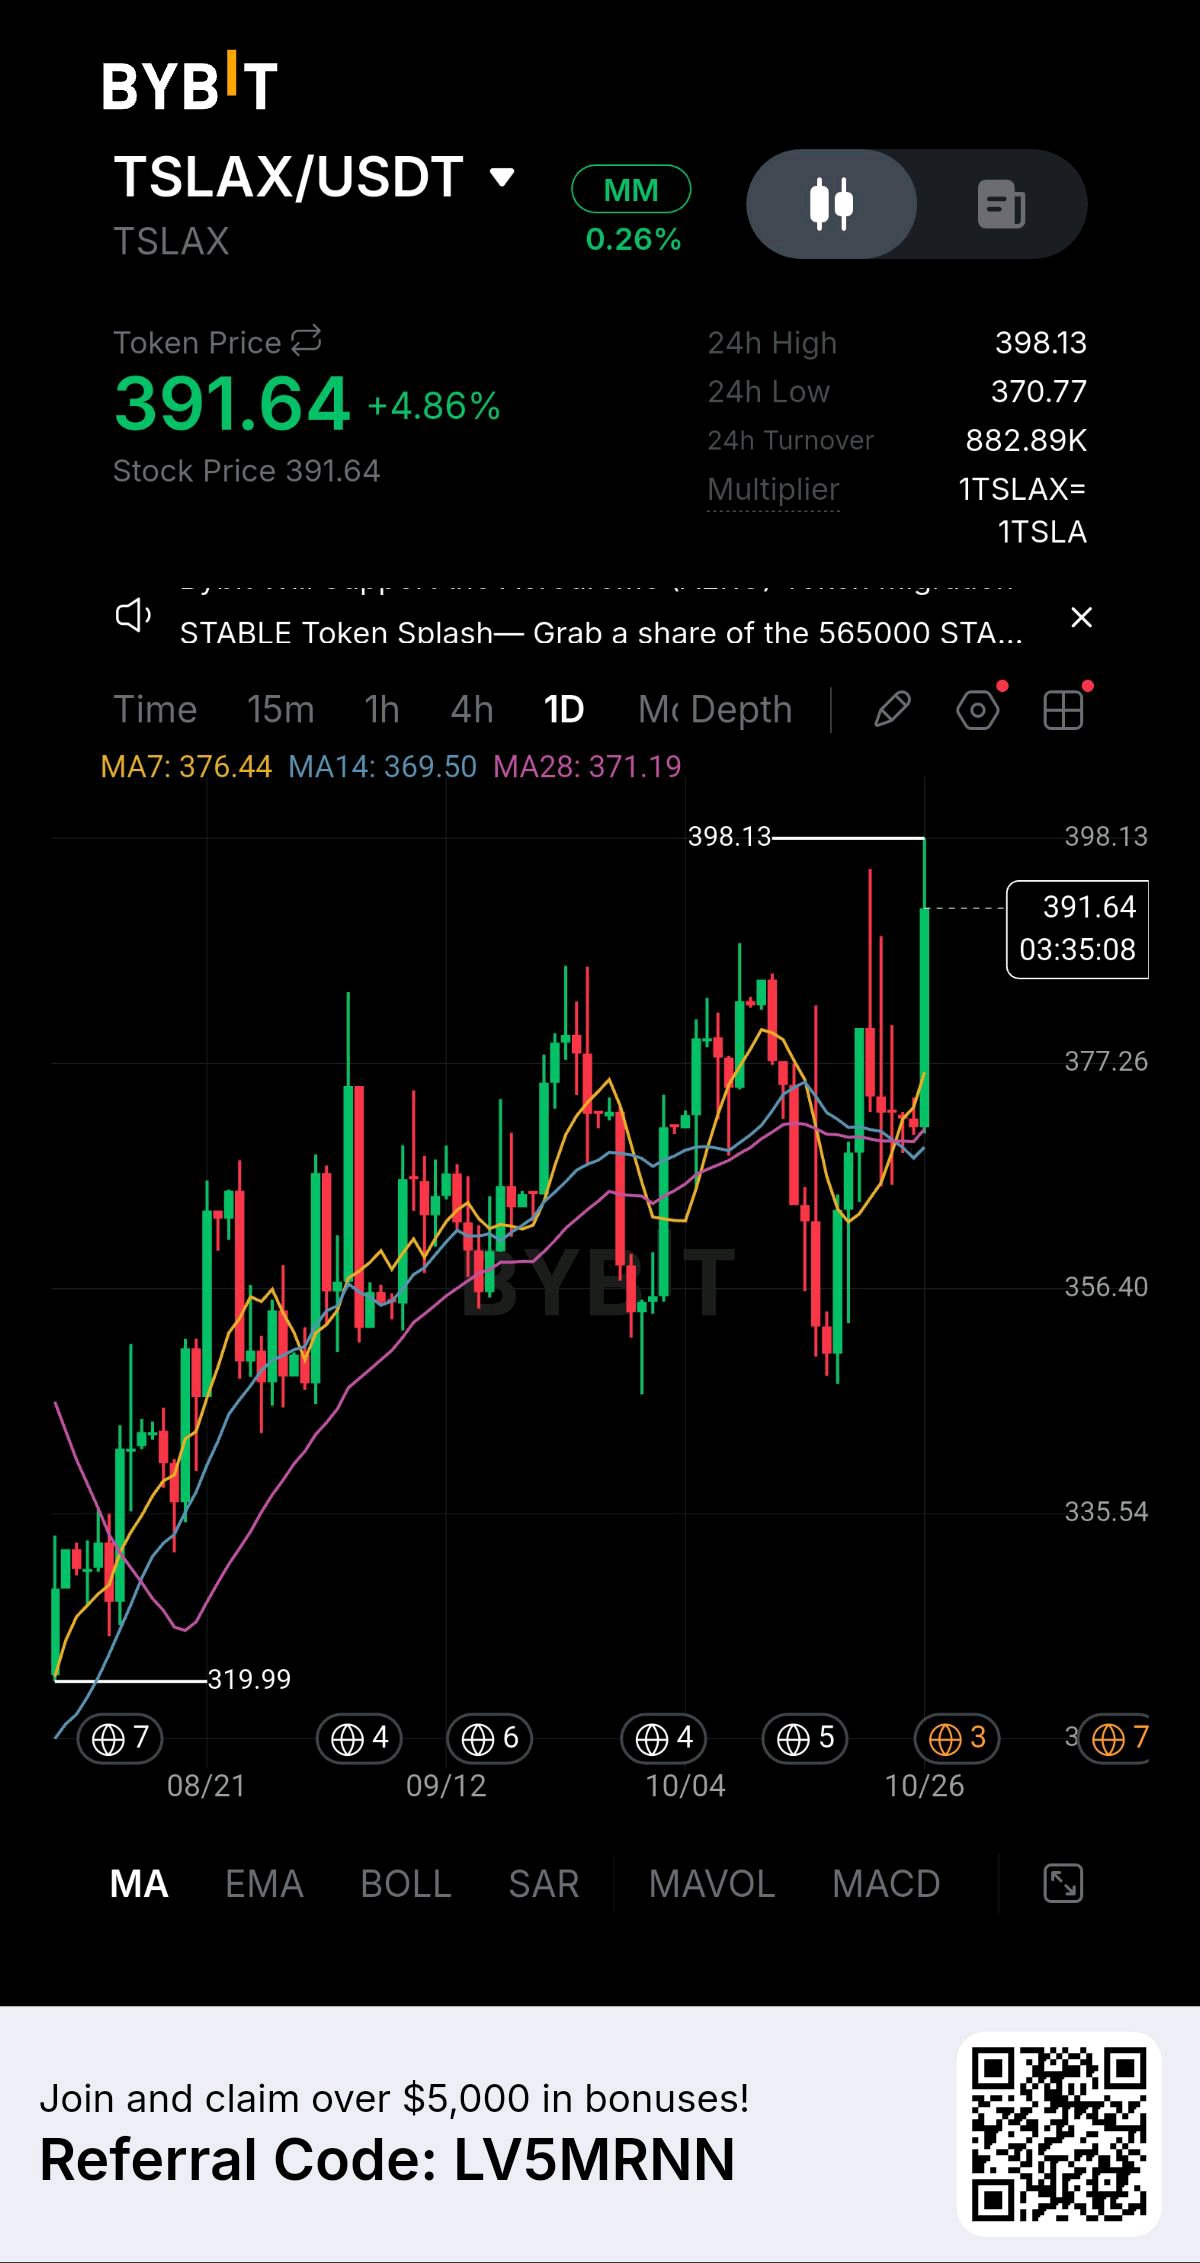
🚀 BYBIT PAIR ANALYSIS: $TSLAXUSDT ⚡ Snap Snapshot: • Price: $391.64 (+4.86%) • 24h High: $398.13 | 24h Low: $370.77 • 24h Volume: 882.89K 📊 Daily Technical Setup: • Bullish Expansion: TSLAX has staged a powerful recovery rally from recent swing pullbacks, surging aggressively toward the key high of $398.13. • Moving Average Alignment: The price action sits comfortably above all major daily moving averages—MA7 ($376.44), MA14 ($369.50), and MA28 ($371.19)—confirming clear momentum control by buyers. • Key Level to Watch: Holding above the $380 region keeps the path open for a retest and breakout over the $398-$400 resistance level. 📌 Execution Strategy: • Keep an eye on retests around the MA7 zone for low-risk entry confirmations during short-term pullbacks. #WSOT2026 #AnthropicS1Filing #IMPACTbyTrade #MyByXTake #ByXIMPACT
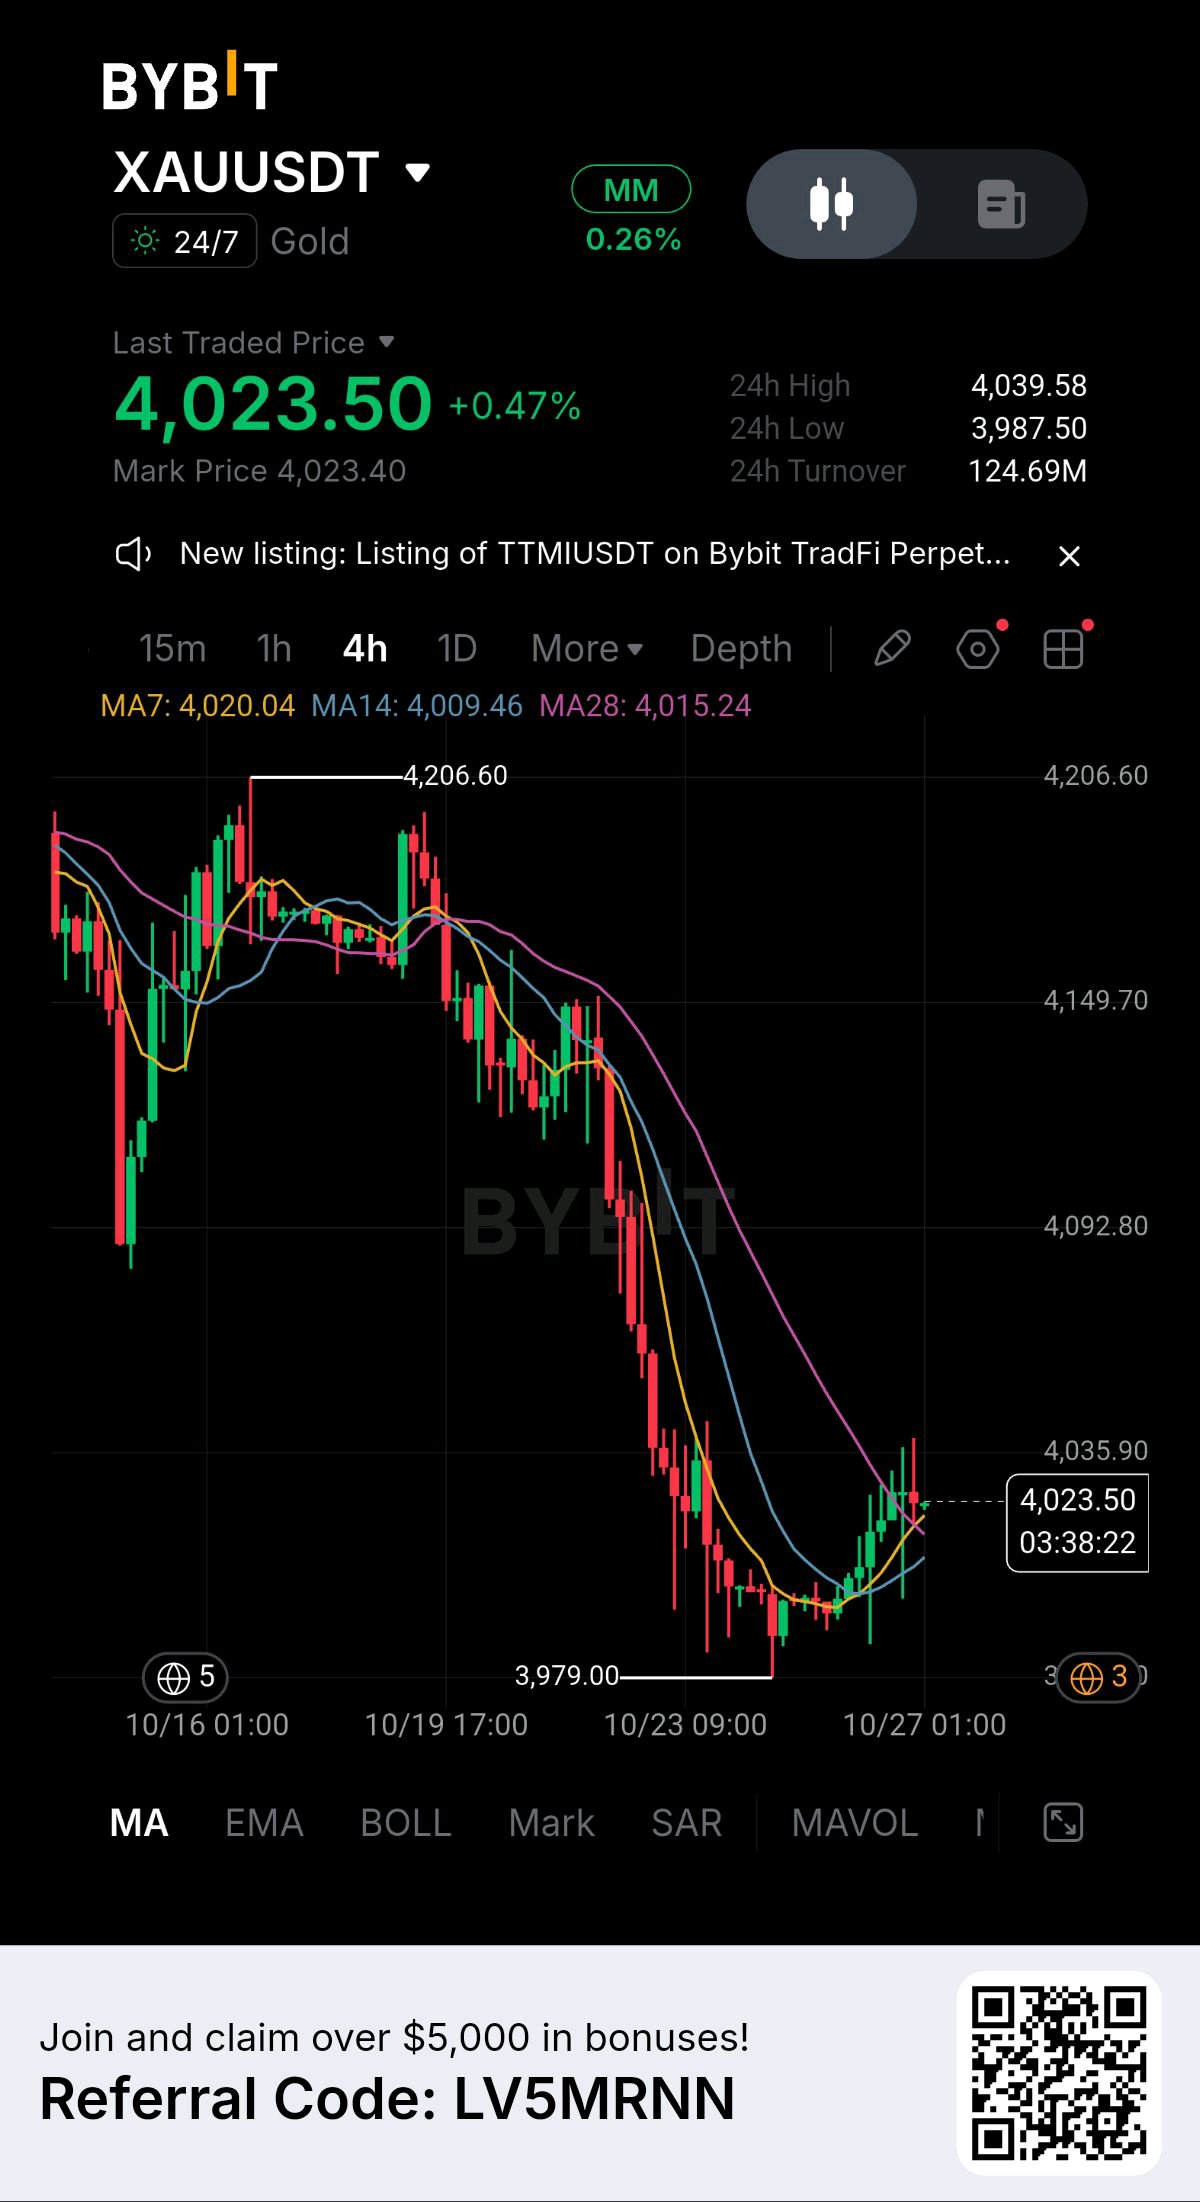
The sell-off looked brutal… but the chart is quietly starting to change character. After falling from the 4,200+ area all the way down toward 3,979, the price finally found buyers and started building a base around the 4,000 zone. Now we’re seeing something interesting on the 4H chart. Price has pushed back above the short-term moving averages, with MA7 around 4,020, MA14 near 4,009 and MA28 around 4,015. That puts the current price near 4,023 directly around an important decision area. A clean hold above 4,020–4,035 could open the door toward 4,090 first. If momentum continues and that level breaks convincingly, 4,145–4,150 becomes the next area to watch. On the other hand, losing the 4,000 psychological level would weaken this recovery and could bring the 3,979 low back into focus. For now, the chart is no longer showing the same aggressive selling pressure we saw earlier. The key question is simple: Is this just a relief bounce… or the beginning of a bigger recovery? 👀 $BTCUSDT #WSOT2026 #AnthropicS1Filing #IMPACTbyTrade #MyByXTake #ByXIMPACT
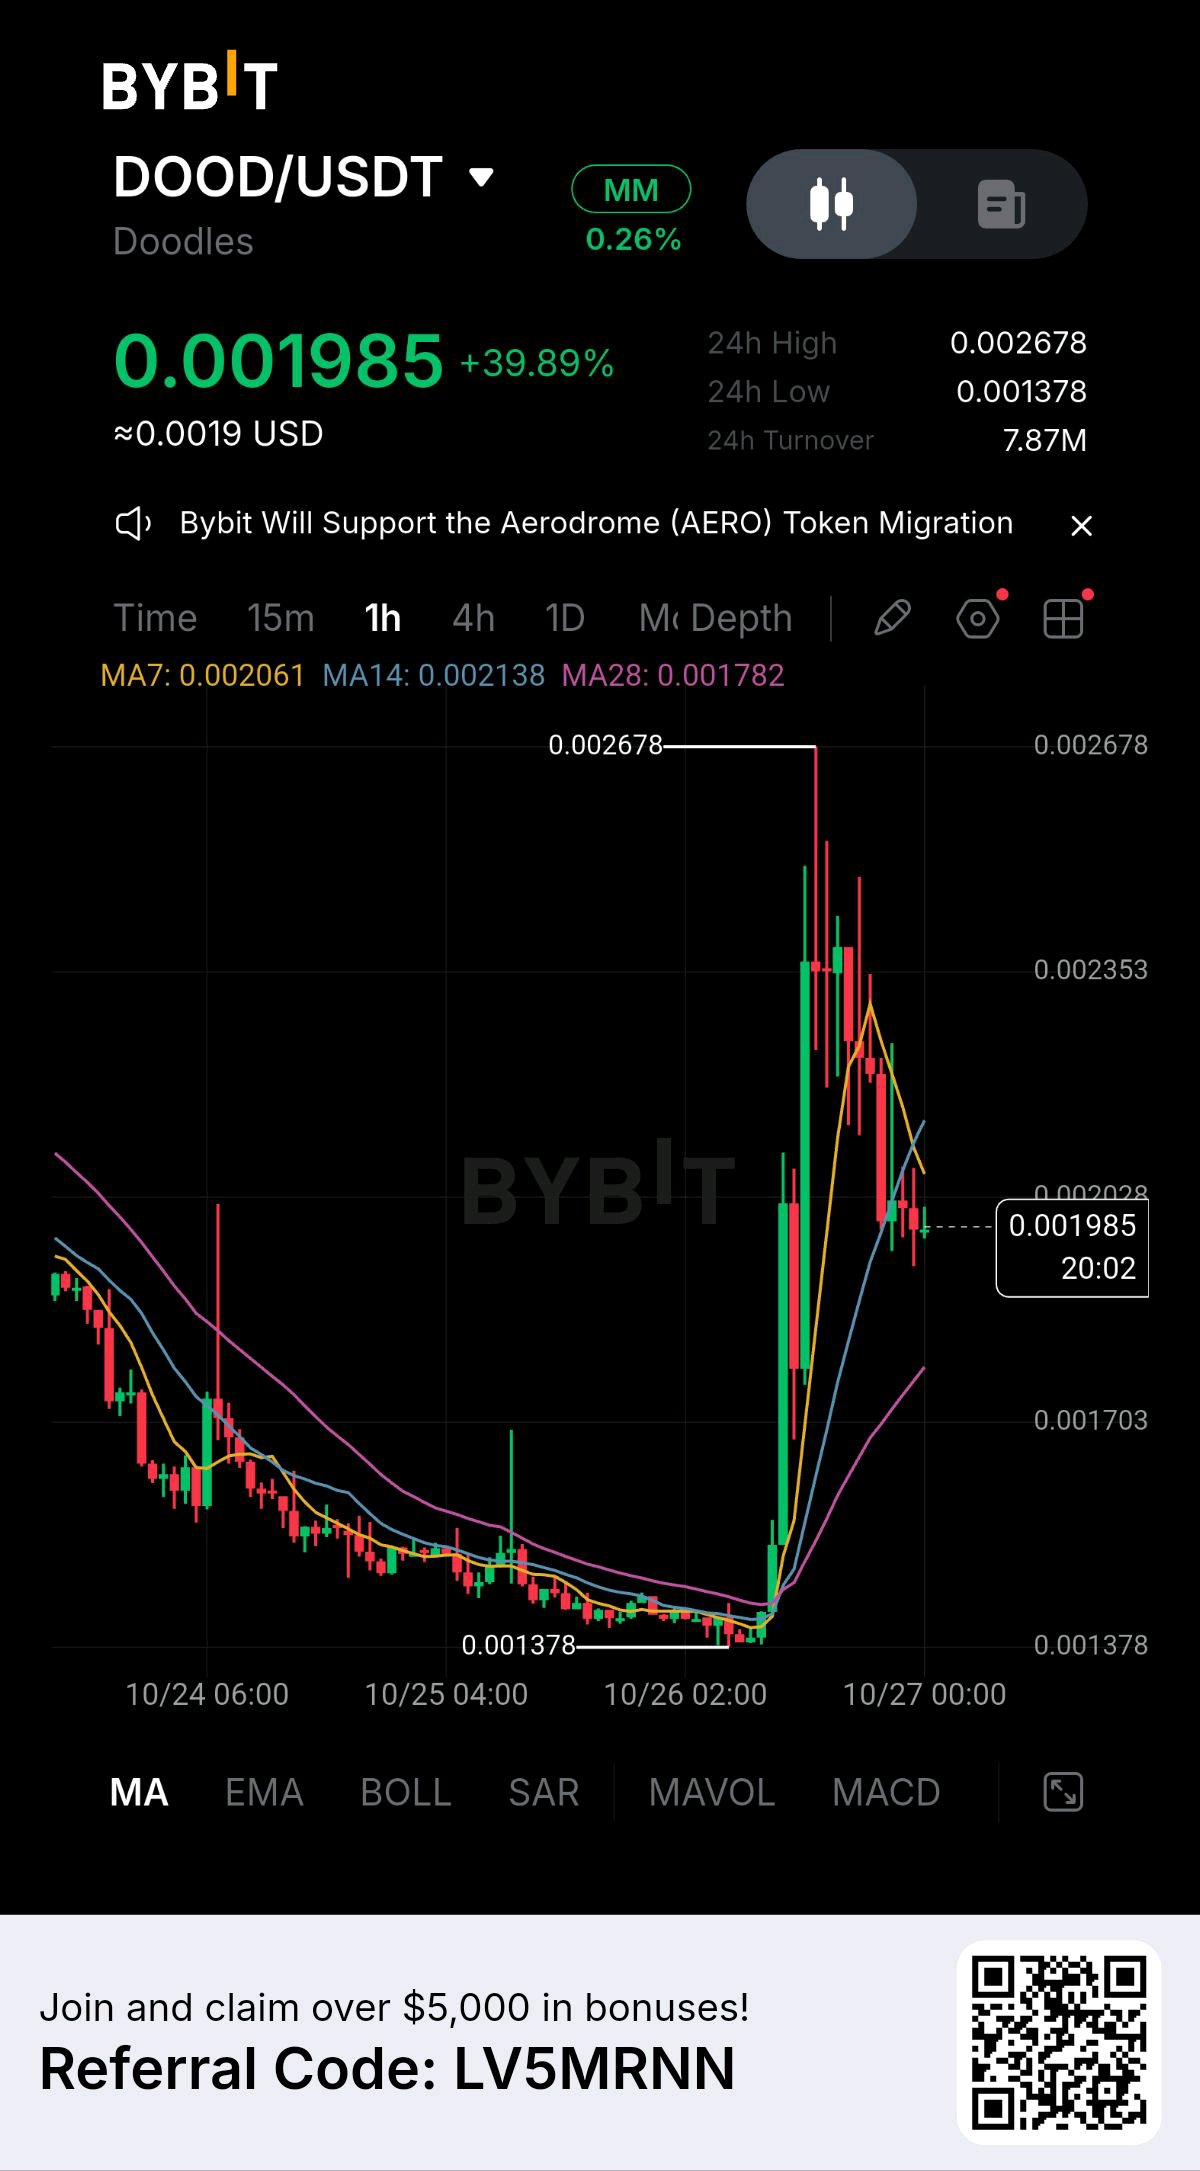
Sometimes the biggest move starts with a chart nobody was paying attention to. This one just woke up. After spending hours grinding around the 0.0014 area, price suddenly exploded toward 0.00268 — a move of almost 2x from the recent low. Now it’s cooling around 0.00198, but the structure is still interesting. The 0.00200–0.00205 area is the key zone to watch. Hold above it → 0.00235 becomes interesting, followed by the recent 0.00268 high. Lose it → a deeper pullback could come before the next attempt. After a move this aggressive, confirmation is everything. No need to chase the candle. Eyes on this one. $DOODUSDT #WSOT2026 #AnthropicS1Filing #IMPACTbyTrade #MyByXTake #ByXIMPACT
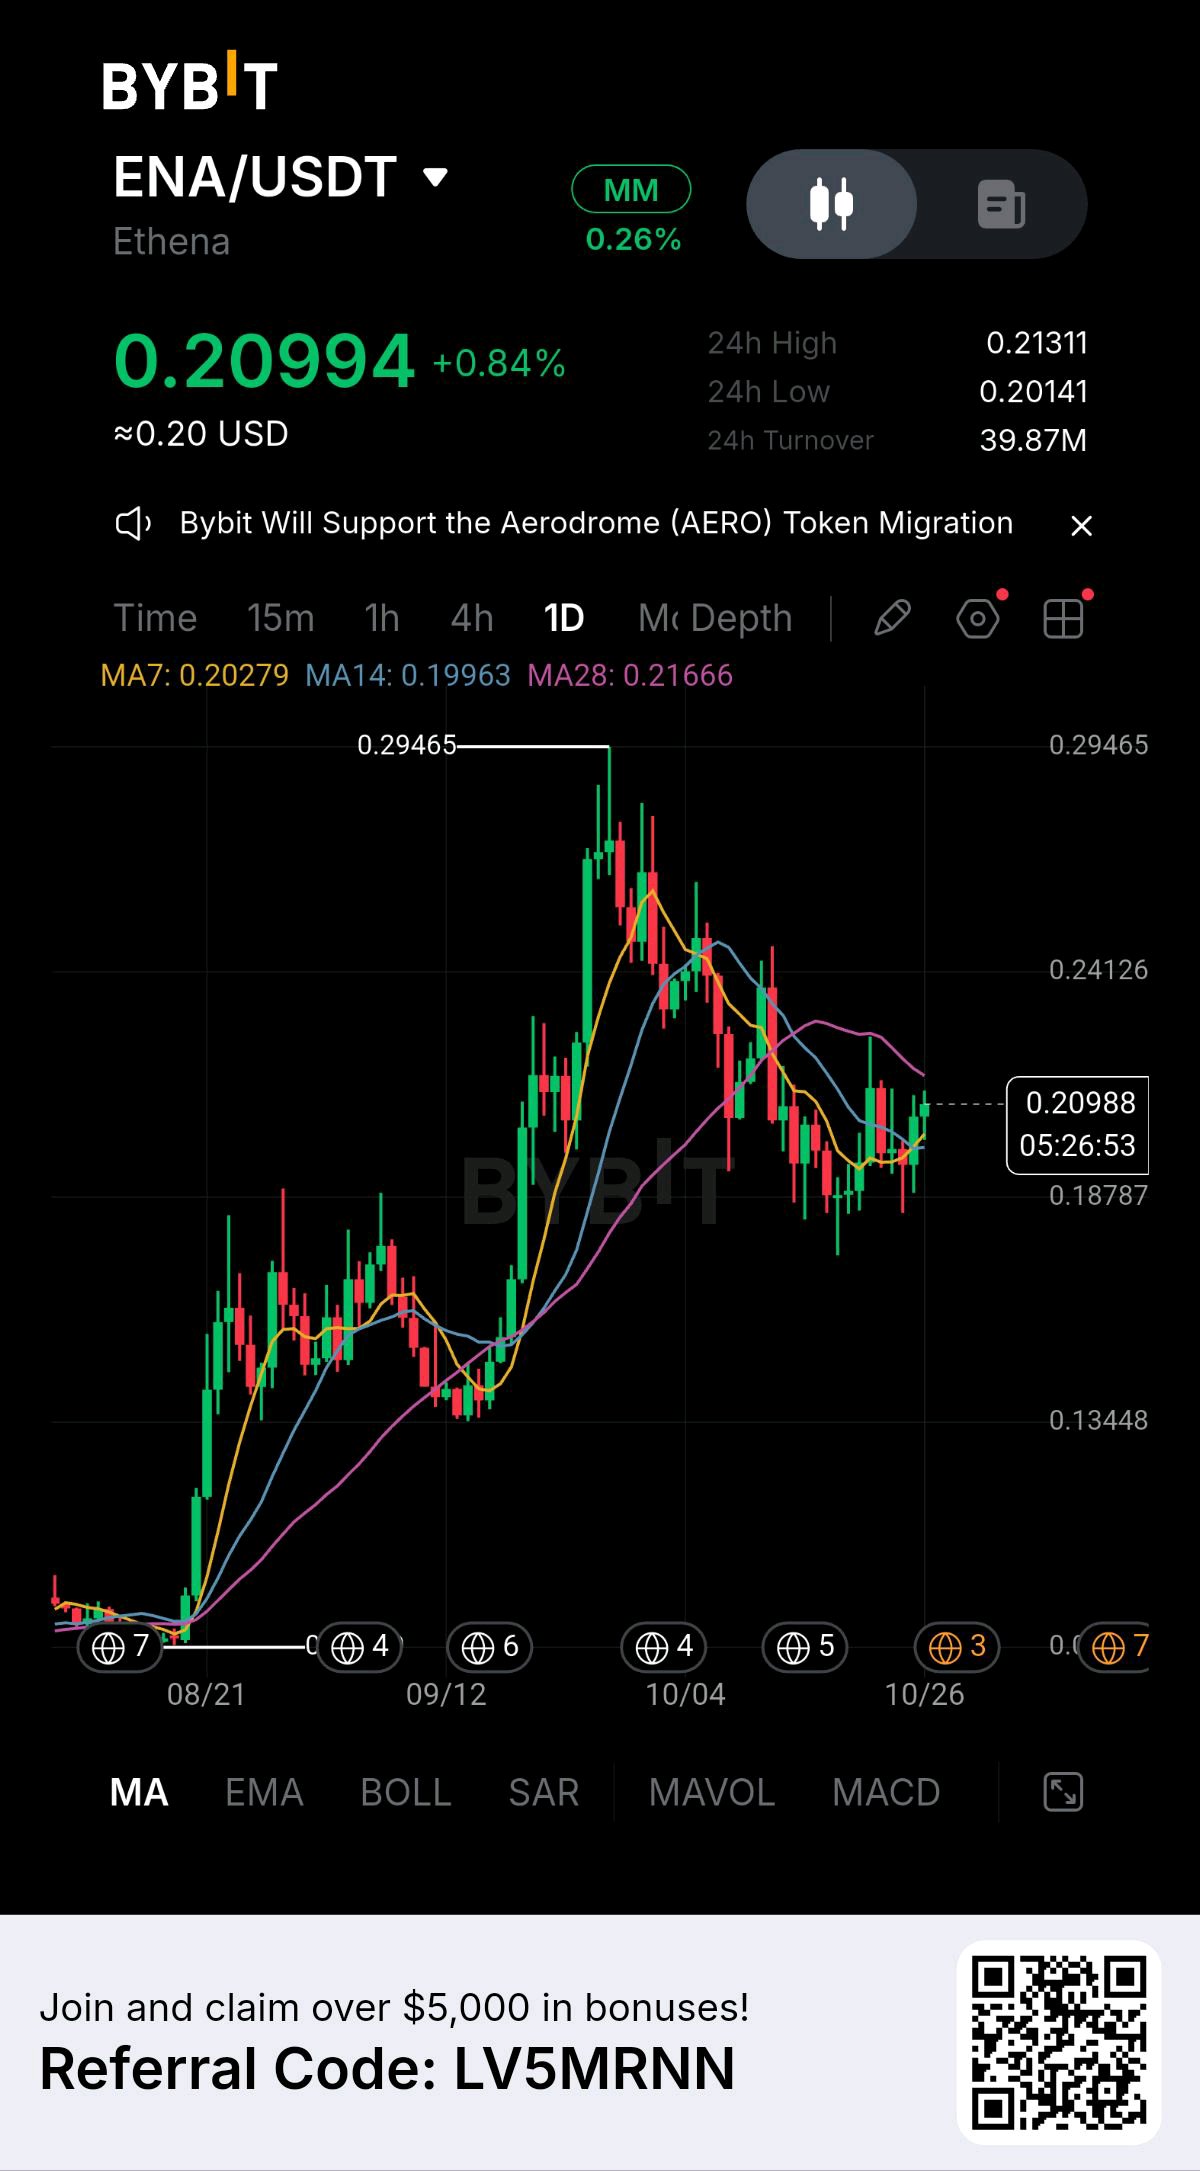
📊 BYBIT MARKET UPDATE: $ENAUSDT 🔥 Current Performance & Metrics: • Last Traded Price: $0.20994 (+0.84%) • 24h High / Low: $0.21311 / $0.20141 • 24h Turnover: 39.87M 📉 Technical Breakdown (Daily Chart Analysis): • Range Stabilization & Support Bounce: Following a correction from its peak at $0.29465, ENA established a firm local bottom near $0.18787 and has begun attempting a gradual upward recovery. • Moving Average Dynamics: Price has pushed above both MA7 ($0.20279) and MA14 ($0.19963), now facing dynamic resistance right around the MA28 level ($0.21666). • Market Outlook: A decisive daily close above the MA28 barrier will be key to unlocking secondary targets toward $0.241+, whereas failure to clear this overhead cluster could result in short-term sideways consolidation. 💡 Market Insight: • Look for sustained daily candle closes above major moving average clusters to confirm trend continuation rather than entry on initial impulse spikes. #WSOT2026 #AnthropicS1Filing #IMPACTbyTrade #MyByXTake #ByXIMPACT
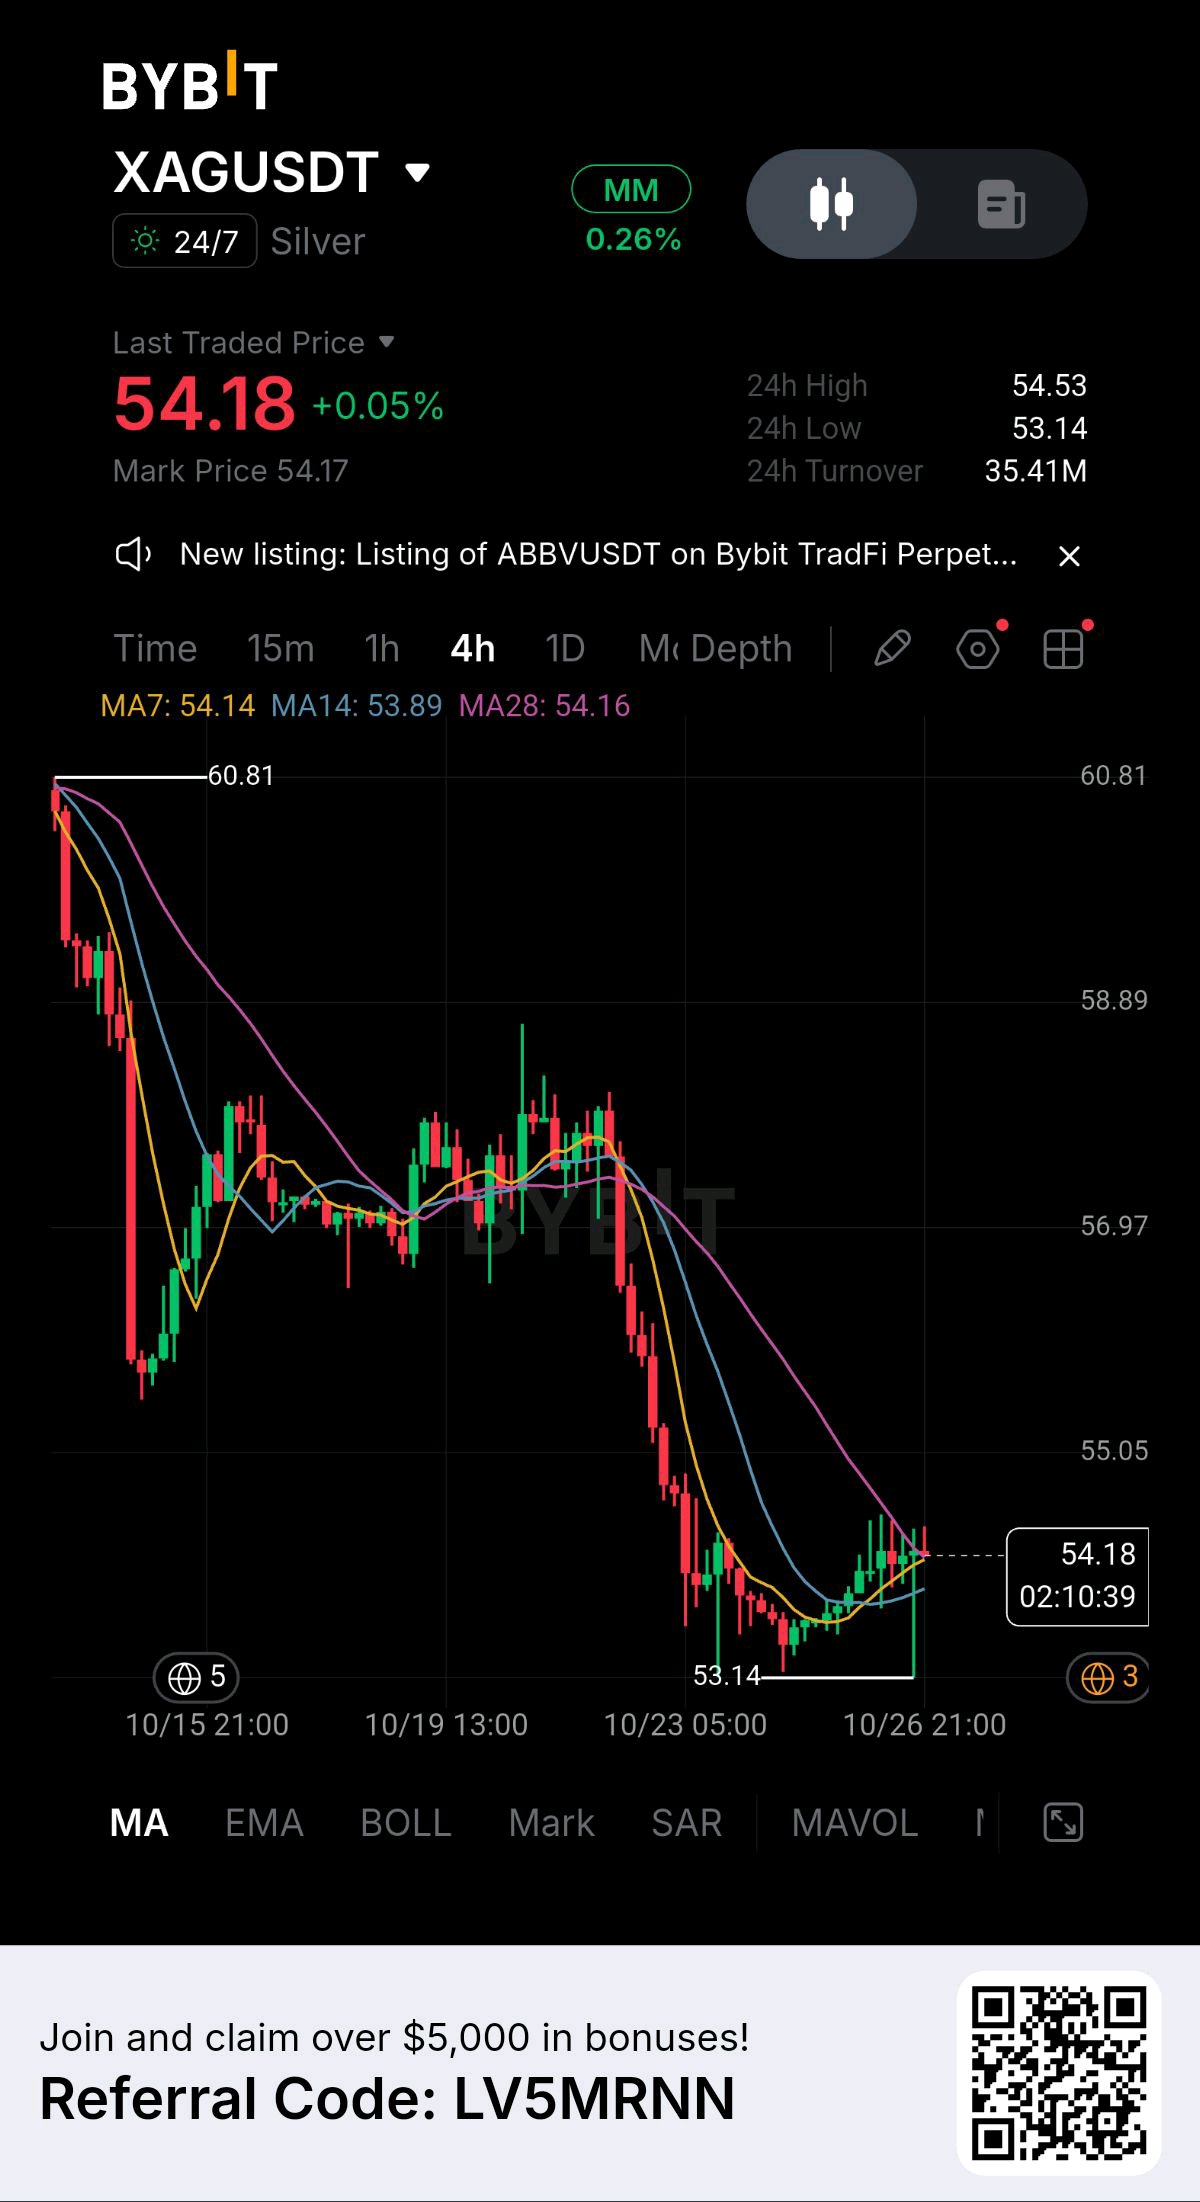
📊 BYBIT MARKET UPDATE: $XAUTUSDT 🔥 Market Overview & Price Action: • Last Traded Price: $54.18 (+0.05%) • Mark Price: $54.17 • 24h High / Low: $54.53 / $53.14 • 24h Turnover: 35.41M 📉 Technical Structure (4H Chart & Moving Averages): • Price Behavior & Stabilization: XAG has defended the crucial floor near the $53.14 low, carving out a base to steady itself after a sharp prior descent. • Moving Averages Alignment: The MA7 ($54.14), MA14 ($53.89), and MA28 ($54.16) are converging tightly right around the current price zone, indicating a transition phase where momentum is trying to flip. • Trend Outlook: Price is testing resistance levels near the MA lines following a bounce from local supports, and a sustained break higher will be needed to confirm a broader trend reversal from the $60.81 drop. 🎯 Pro-Tip for Position Sizing: • During tight moving average consolidations, wait for a definitive volume breakout candle before opening heavy directional positions to avoid fakeouts. #WSOT2026 #AnthropicS1Filing #IMPACTbyTrade #MyByXTake #ByXIMPACT
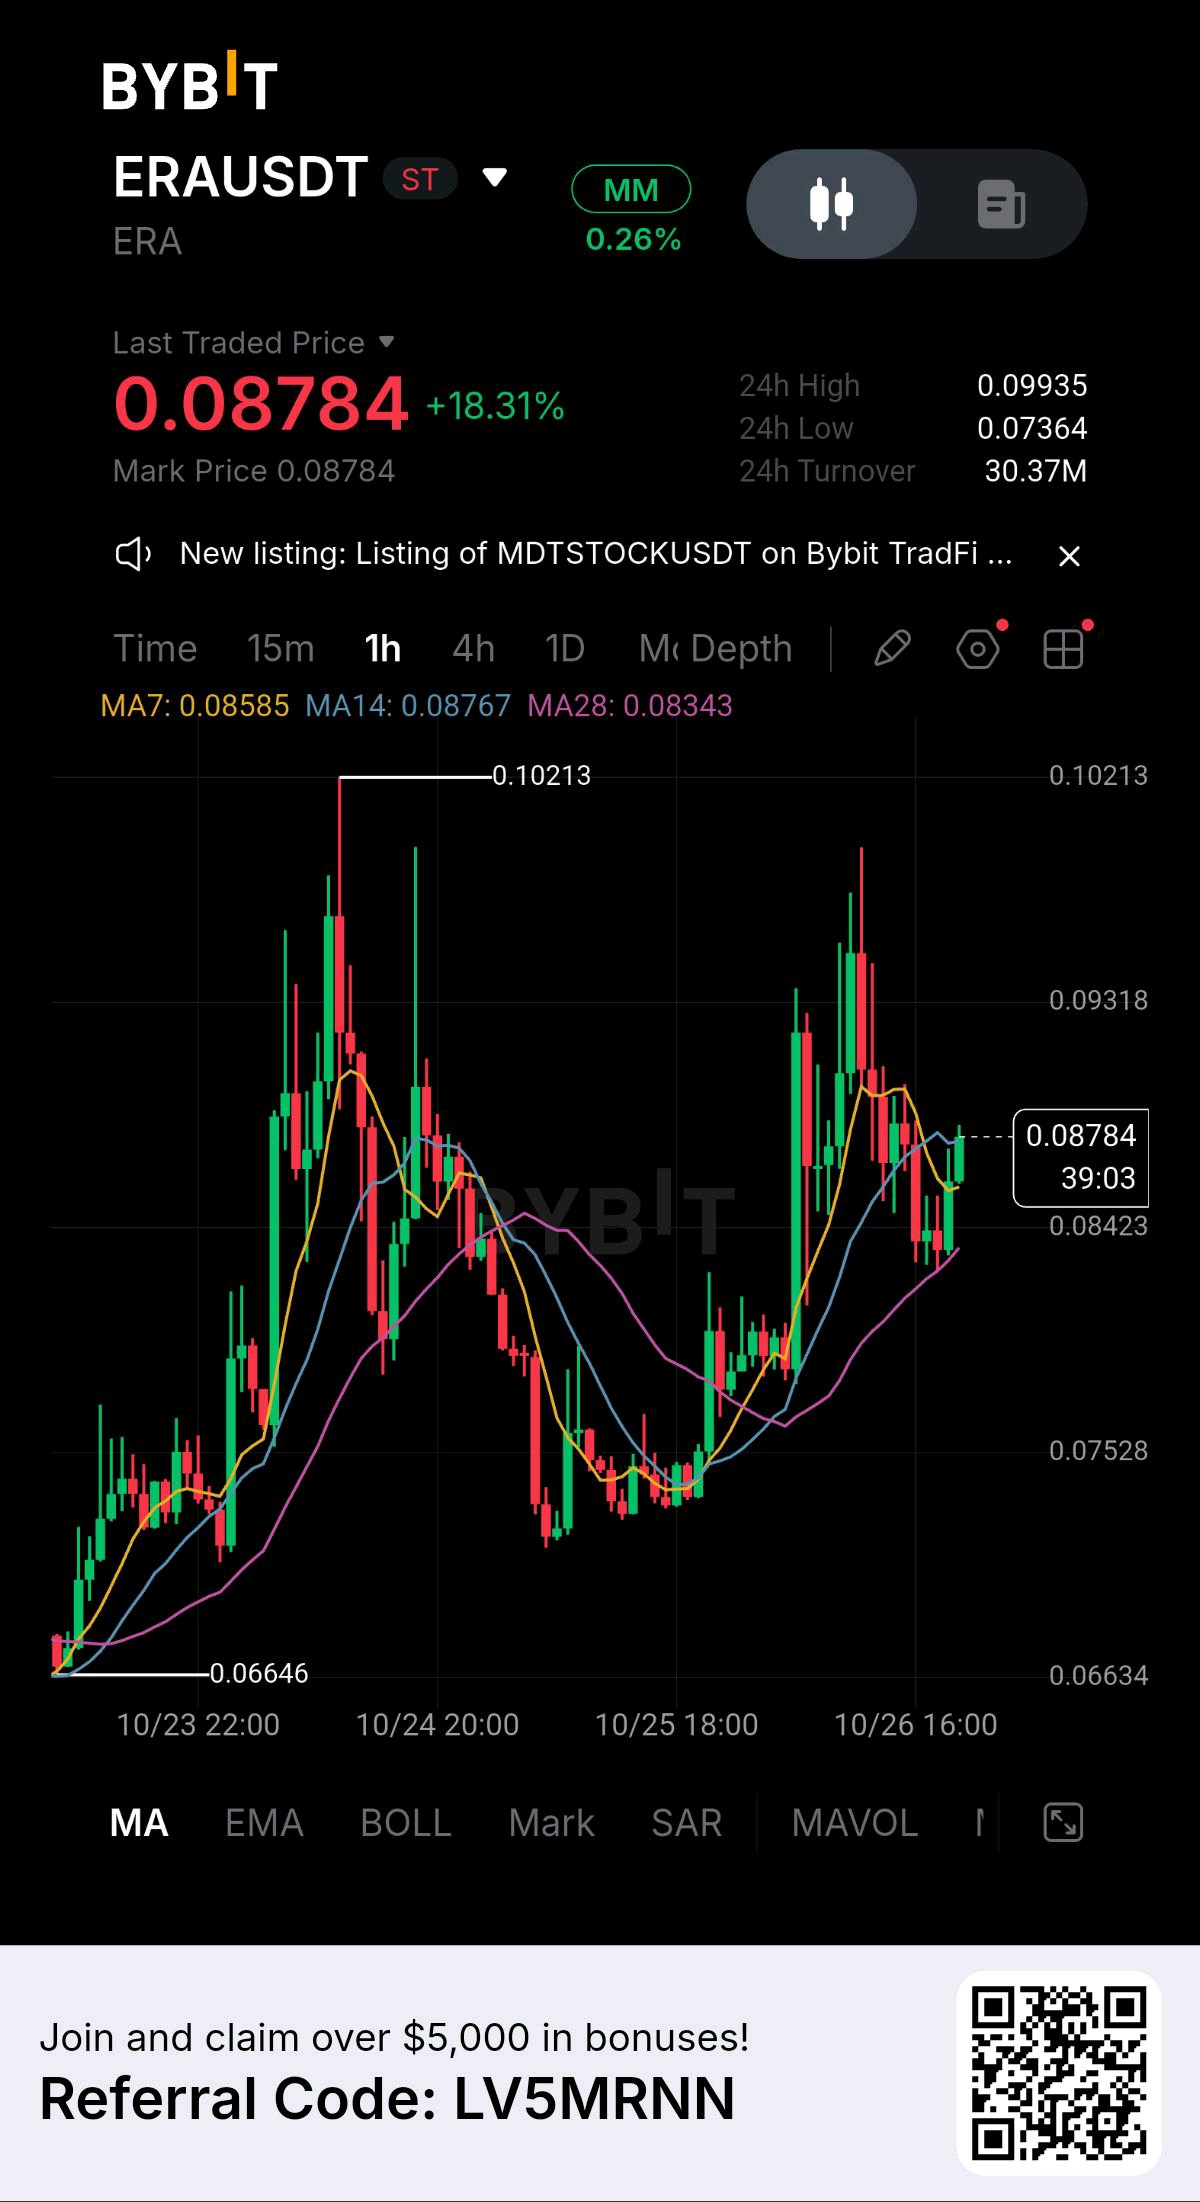
What looked like a quiet consolidation has suddenly turned into a move that is getting much harder to ignore. ERA is now trading around $0.08784, up an impressive 18.31% in the last 24 hours, after buyers stepped in aggressively from the lower range and pushed price back toward the key resistance area. The important part isn't the percentage gain itself. It's where price is now. ERA is approaching $0.09318, a level that could determine whether this move has enough strength to continue expanding or whether sellers are finally ready to step in. On the 1H chart: MA7: $0.08585 MA14: $0.08767 MA28: $0.08343 Price is currently holding above the MA28 and around the faster moving averages, which keeps the short-term structure constructive. If buyers can maintain this position and push through $0.09318, the next major test comes around $0.09935, which is also the current 24H high. A sustained break above $0.09935 would become much more significant, potentially opening the way toward the $0.10213 area. But there is still an important level underneath. The $0.085–$0.087 region is now the first area I would watch on any pullback. Holding this zone would suggest that buyers are successfully defending the momentum they just created. Below that, $0.08343, around the MA28, becomes the next important technical support. If that level also fails, the recent breakout attempt could start losing its strength and price could move back toward the lower part of the previous range. So the key levels are: $0.08343 → MA28 support $0.085–$0.087 → Short-term support zone $0.09318 → First major resistance $0.09935 → Breakout high $0.10213 → Next major upside level The setup is interesting because the market has already shown strong buying pressure, but the real confirmation hasn't arrived yet. A clean break above $0.09318, followed by a successful hold, would give this move considerably more credibility. If buyers fail there and price slips back below the MA cluster, the market could simply be taking a breather after the sharp expansion. For now, $0.09318 is the level I would keep closest watch on. That is where this 18% move either starts looking like the beginning of something bigger — or runs into its first serious test. 🔥 $ERAUSDT #WSOT2026 #AnthropicS1Filing #IMPACTbyTrade #MyByXTake #ByXIMPACT
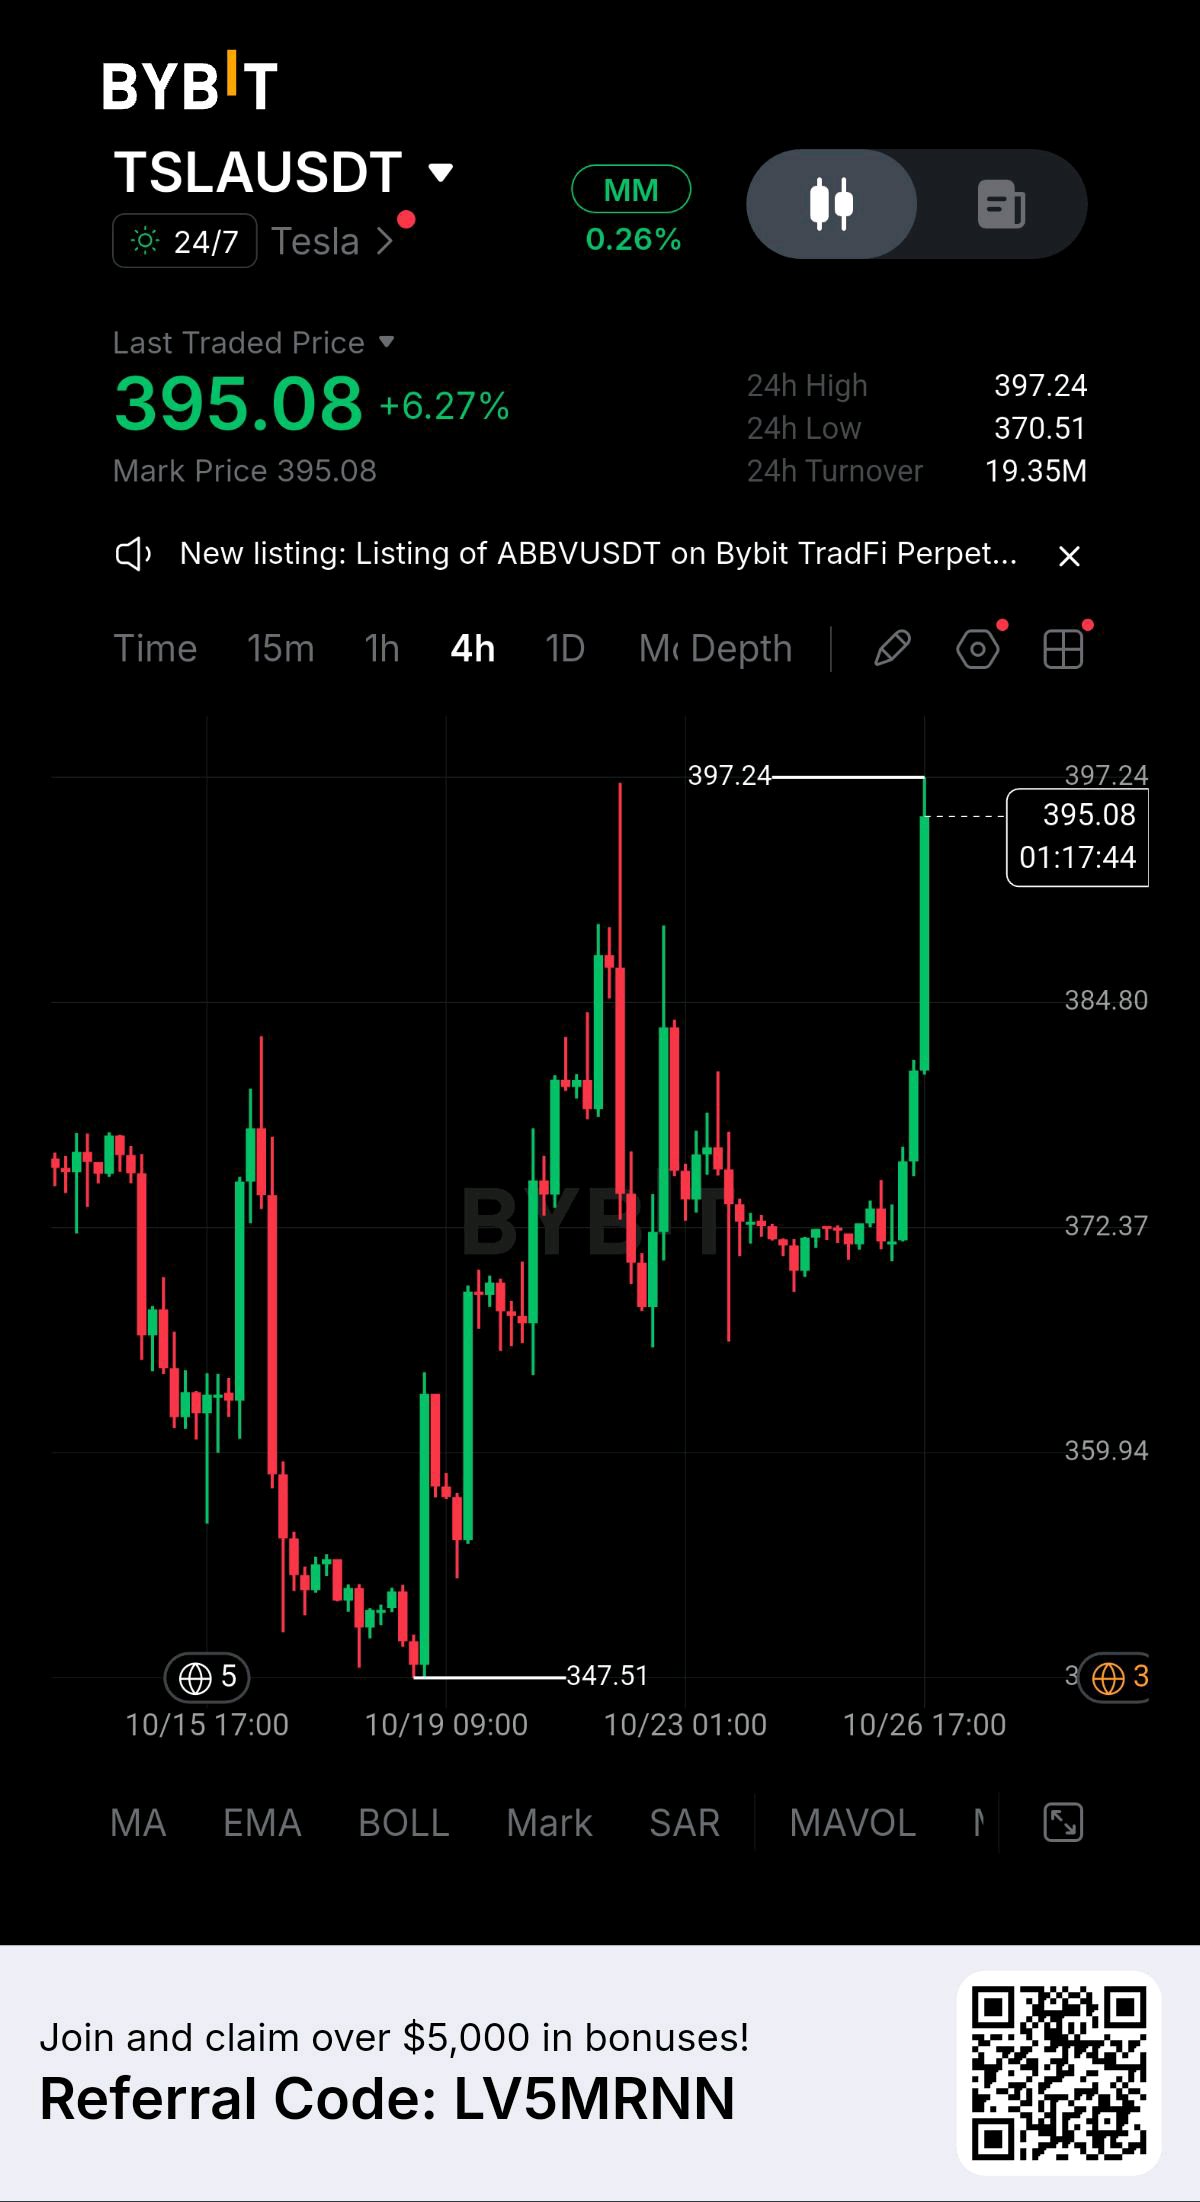
Tesla is showing a strong bullish move on the 4H chart, with price currently around $395.08, up +6.27%. After spending several sessions consolidating around the $370–$375 zone, buyers have stepped in aggressively and pushed price toward the important $397.24 resistance. 📊 Current Setup: 💰 Price: $395.08 📈 24H Change: +6.27% 🔺 24H High: $397.24 🔻 24H Low: $370.51 📍 Major Support: $372–$375 📍 Breakout Support: $384–$385 🎯 Immediate Resistance: $397.24 🎯 Psychological Level: $400 🔥 BULLISH SCENARIO If TSLA breaks above $397.24 with strong buying volume and manages to hold above this level, the next major psychological target becomes $400. A clean breakout and hold above $400 could potentially open the way for another upside continuation. 🛡️ IMPORTANT SUPPORT The $384–$385 area is now an important short-term support zone. If price pulls back but successfully holds this region, the breakout structure remains healthy. The $372–$375 zone is an even stronger structural support area. Losing this zone would weaken the current bullish setup considerably. ⚠️ RISK Price has already moved sharply in a short period, so chasing the candle at the top can carry higher risk. A breakout confirmation or a controlled pullback may provide a better risk/reward setup than entering after an extended candle. 📌 KEY LEVEL TO WATCH: $397.24 Tesla is now standing directly below a major resistance level. Break $397.24 → $400 becomes the next psychological battle. Reject $397.24 → watch $384–$385 for support. The momentum is clearly with the buyers right now, but the reaction around $397–$400 will be crucial. 👀🔥 $TSLAXUSDT #WSOT2026 #IMPACTbyTrade #AnthropicS1Filing #MyByXTake #ByXIMPACT
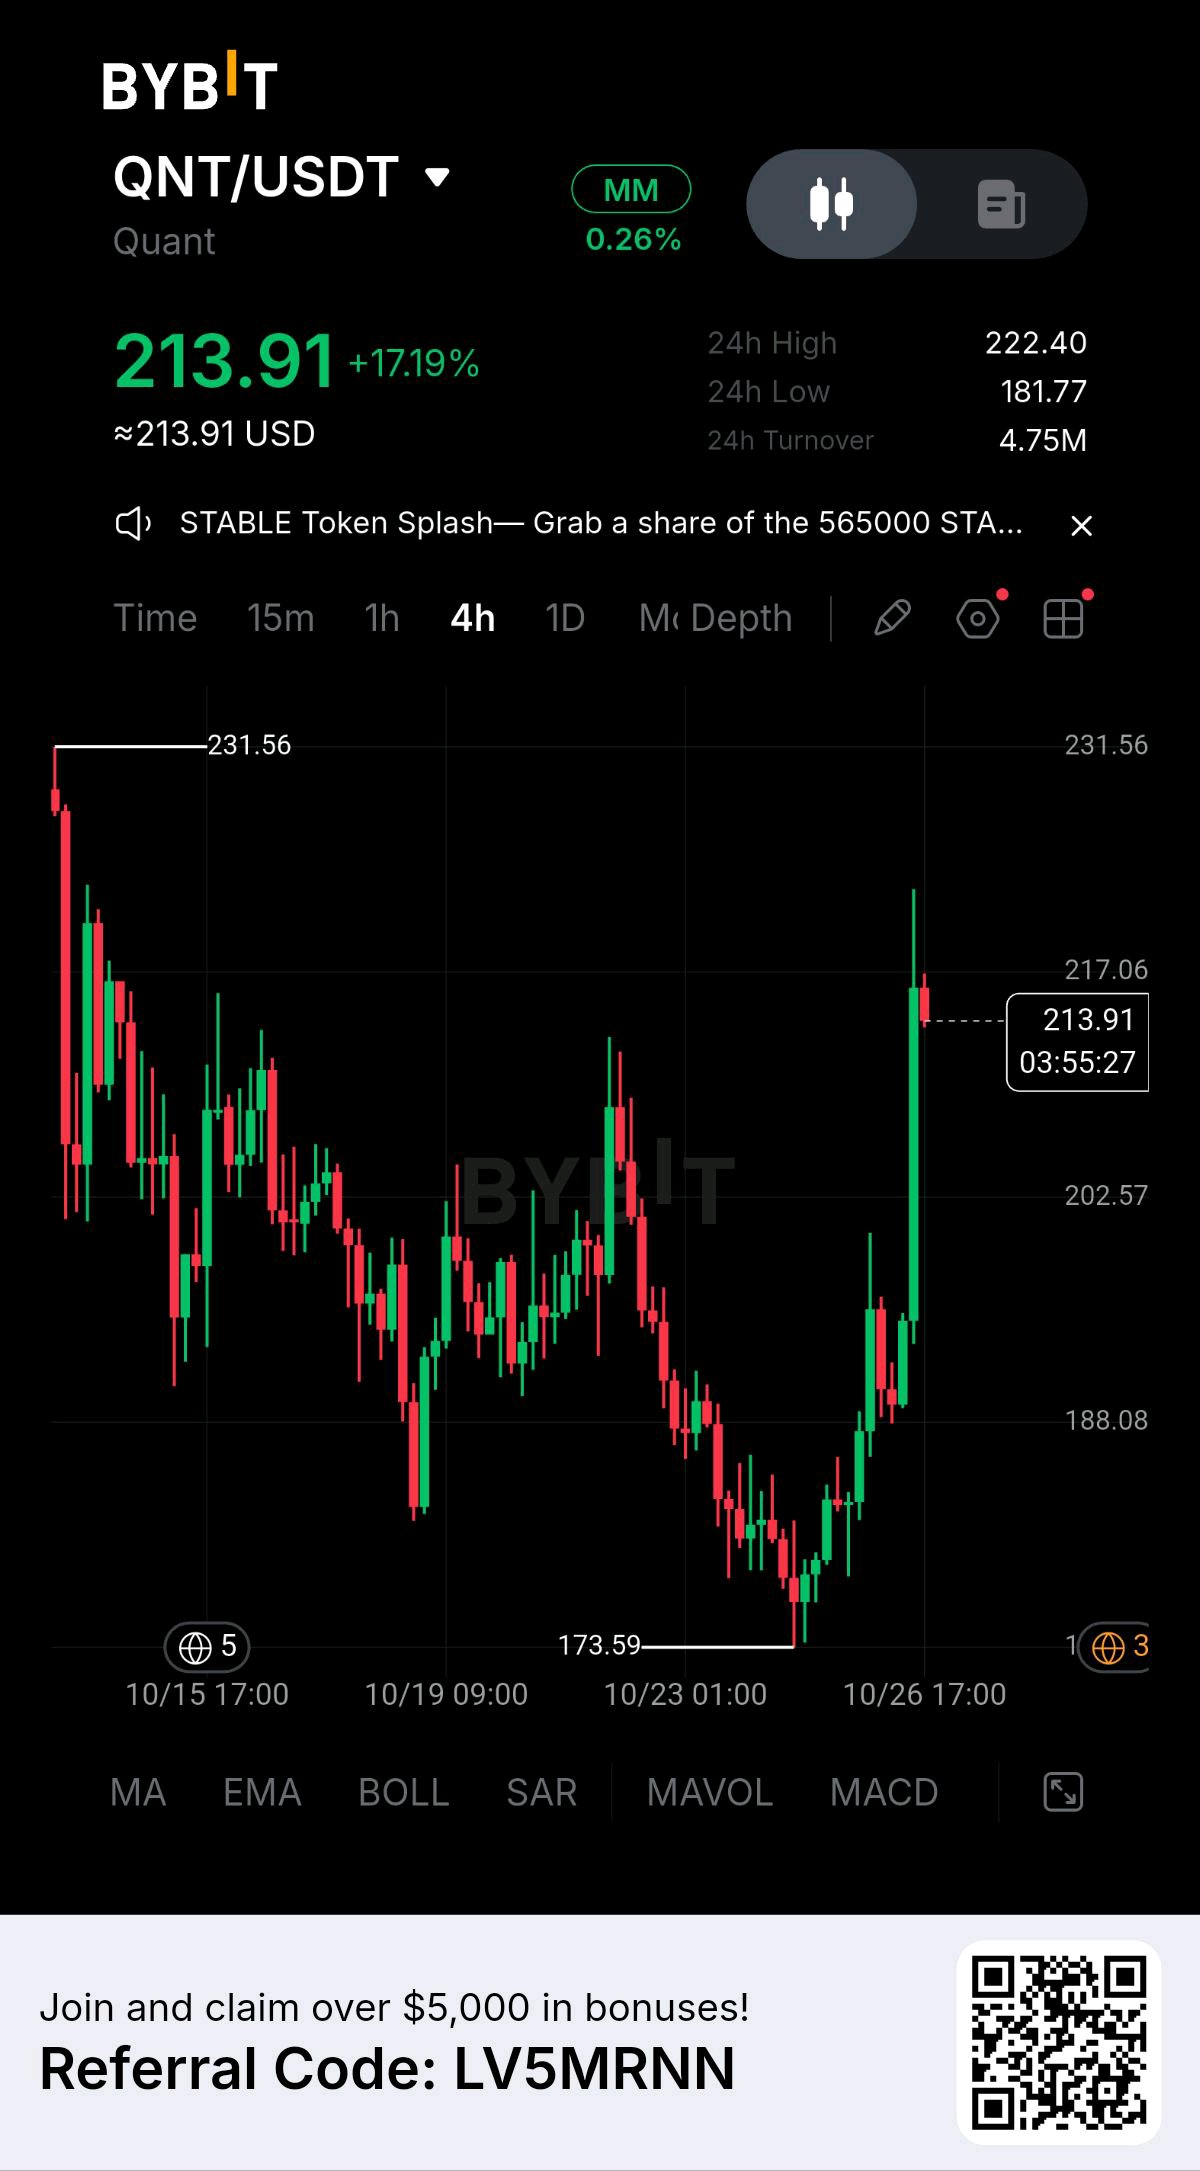
📊 BYBIT MARKET UPDATE: $QNTUSDT 🔥 Current Price & Momentum: • Last Traded Price: $213.91 (+17.19%) • 24h High / Low: $222.40 / $181.77 • 24h Turnover: 4.75M 📈 Technical Structure (4H Chart Analysis): • Price Action & Massive Breakout: QNT printed an explosive vertical rally, surging strongly from its local low of $173.59 to tap highs around $222.40. • Resistance & Targets: Following the massive price surge, consolidation is taking place around $213.91 as buyers prepare for another test of the $222+ resistance zone. • Trend Outlook: Strong buying volume confirms dominant momentum, though traders should monitor key support levels closely to manage risk after such a steep vertical move. 🎯 Strategic Trading Takeaway: • When trading fast-moving breakout setups, always utilize strict stop-loss orders and avoid chasing market tops during extended vertical expansions. #WSOT2026 #IMPACTbyTrade #MyByXTake #MidtermsMarketWatch #ByXIMPACT
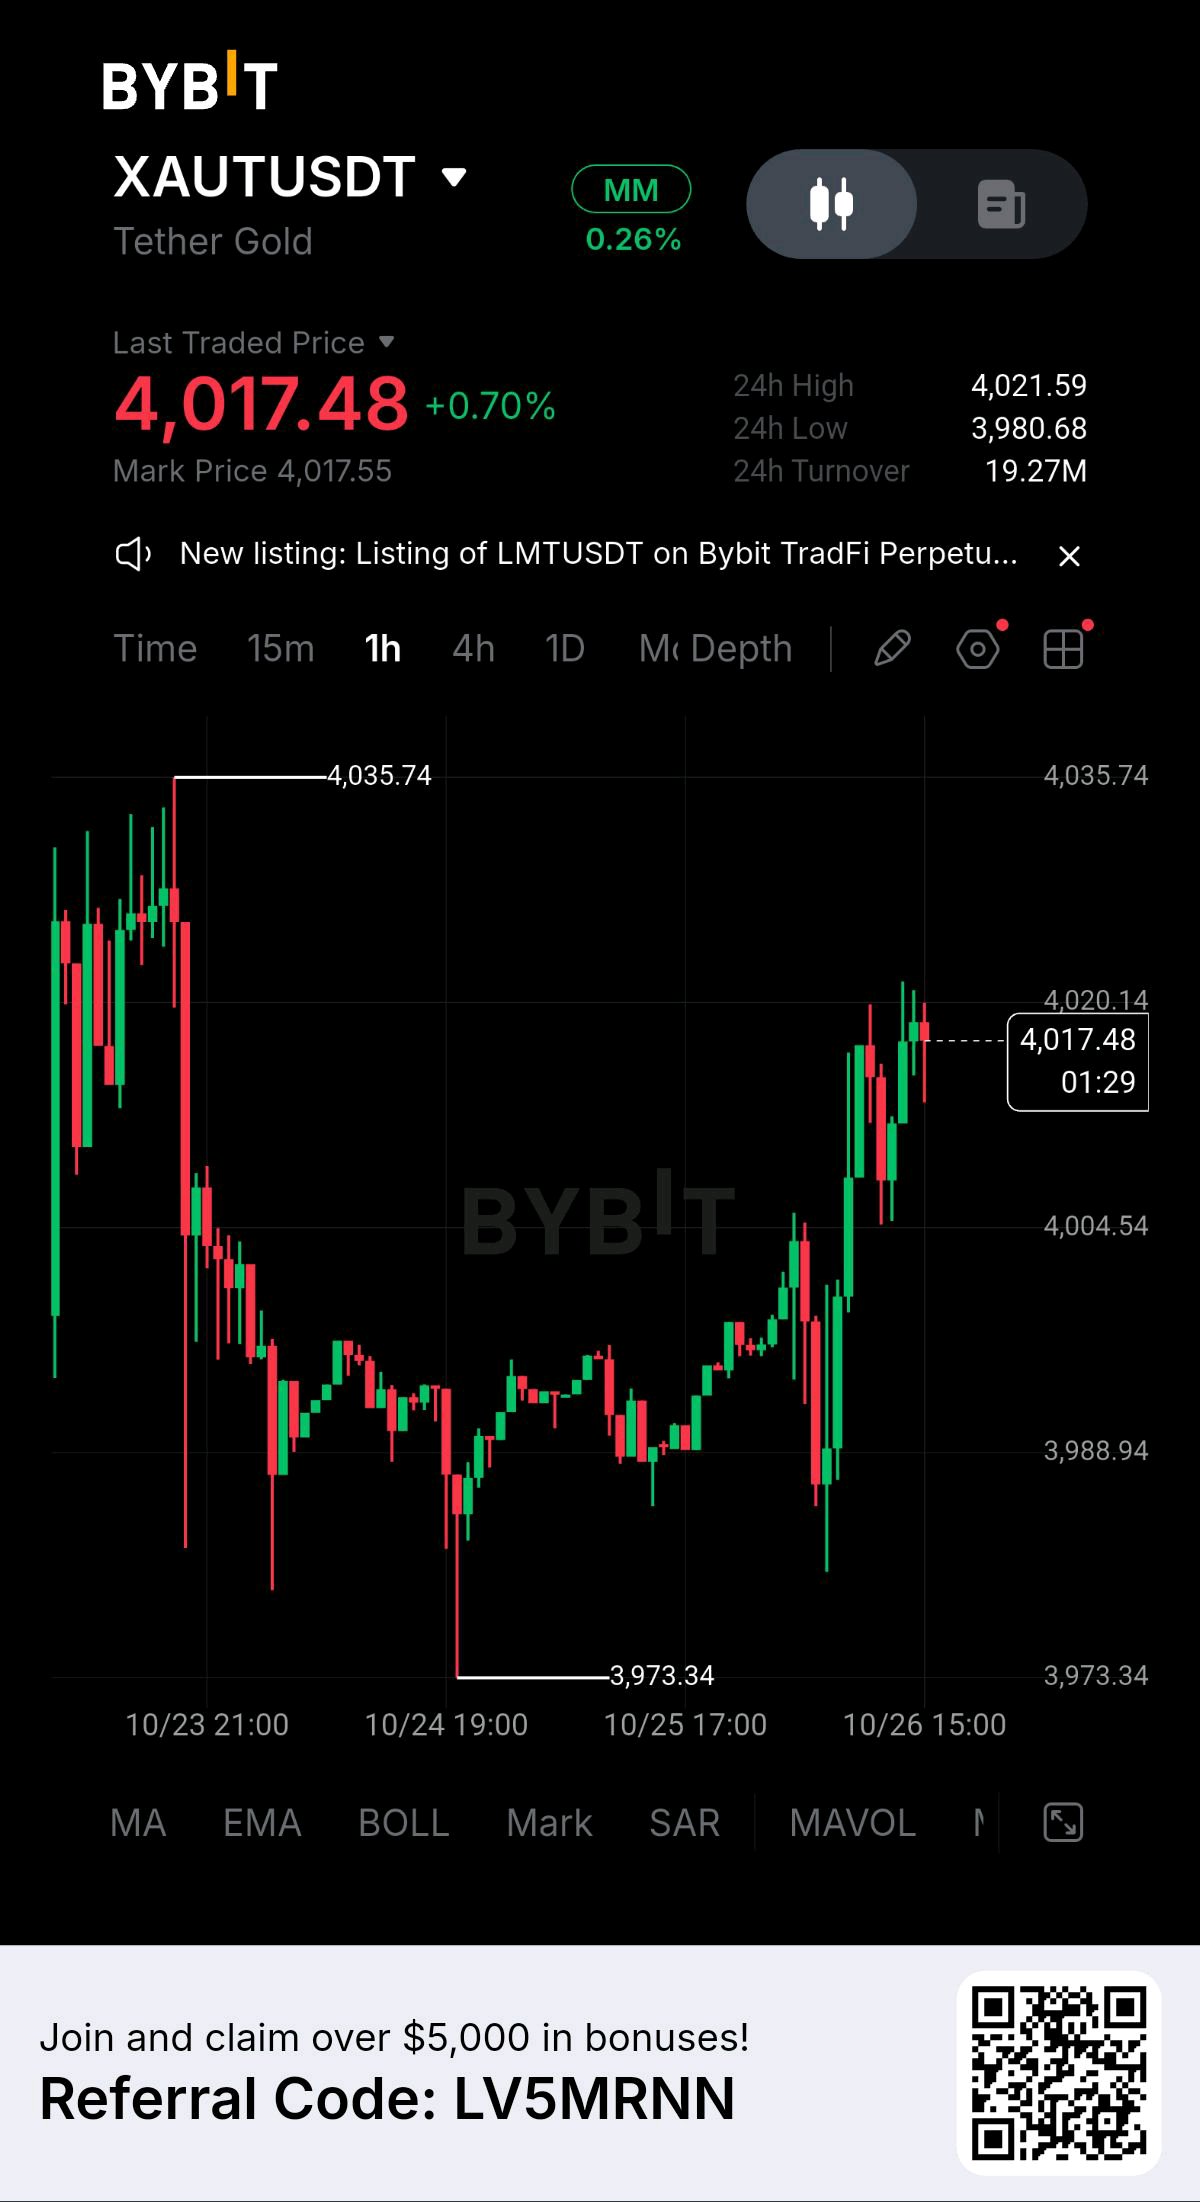
📊 BYBIT MARKET UPDATE: $XAUTUSDT 🔥 Current Price & Momentum: • Last Traded Price: $4,017.48 (+0.70%) • Mark Price: $4,017.55 • 24h High / Low: $4,021.59 / $3,980.68 • 24h Turnover: 19.27M 📈 Technical Structure (1H Chart Analysis): • Price Action & Recovery: XAUT has shown a strong bullish bounce after testing the local support zone around the $3,973.34 mark. • Resistance & Targets: The price is now pushing towards the immediate resistance zone in the $4,020 - $4,035 range, with the previous swing high noted at $4,035.74. • Trend Outlook: Sustained momentum above the $4,000 psychological level highlights solid buyer interest, pointing to a continuation of the short-term upside as long as current support holds. 💡 Trade Smart on Bybit: Trade XAUT/USDT on Bybit with advanced tools and deep liquidity. #WSOT2026 #IMPACTbyTrade #MyByXTake #MidtermsMarketWatch #ByXIMPACT
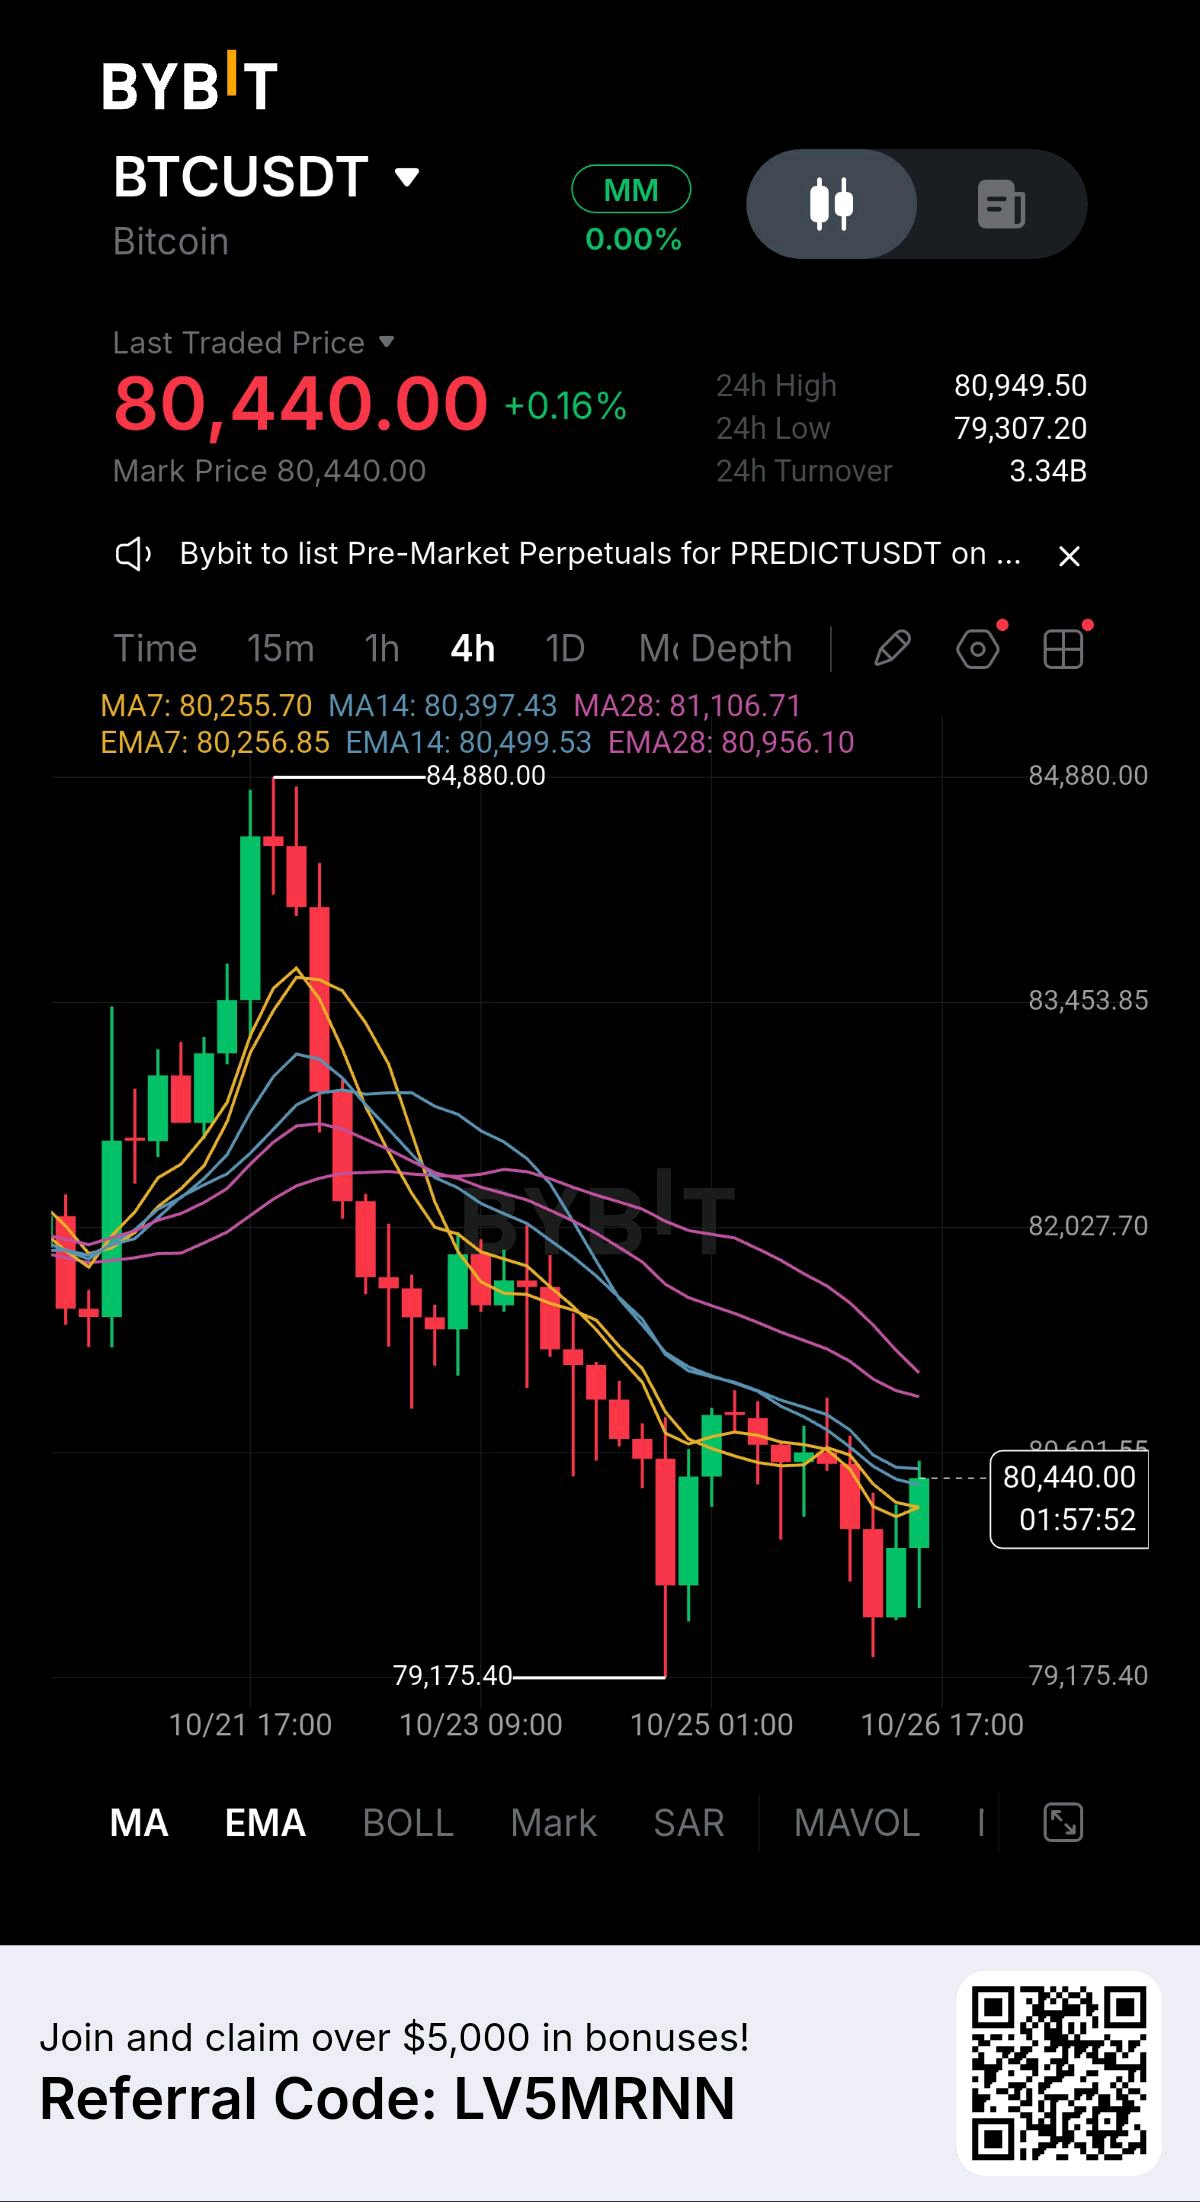
$BTCUSDT is trading near 80,440.00 on the 4-hour timeframe, displaying a short-term recovery following the recent corrective drop. Here is the exact, concise trade setup including entry, stop loss, and take profit targets: * Trade Setup: Long / Rebound Play * Entry Range: 80,200 – 80,500 (Near the fast EMA 7 and EMA 14 dynamic support) * Stop Loss (SL): 79,100 (Placed securely below the 79,175.40 swing low structural support) * Take Profit (TP 1): 82,000 (Immediate overhead resistance) * Take Profit (TP 2): 83,450 (Major supply zone target) Trade Rationale & Execution: Price recently bounced after a liquidity sweep at the 79,175.40 baseline and is testing the fast moving averages. As long as the 79.1k support floor holds, the market favors a relief rally toward higher resistance zones. A clean break above the EMA 28 (80,956.10) will accelerate bullish momentum. Always manage your risk and adjust leverage carefully based on your account size. #WSOT2026 #IMPACTbyTrade #MyByXTake #Bybit8thAnniversary #ByXIMPACT
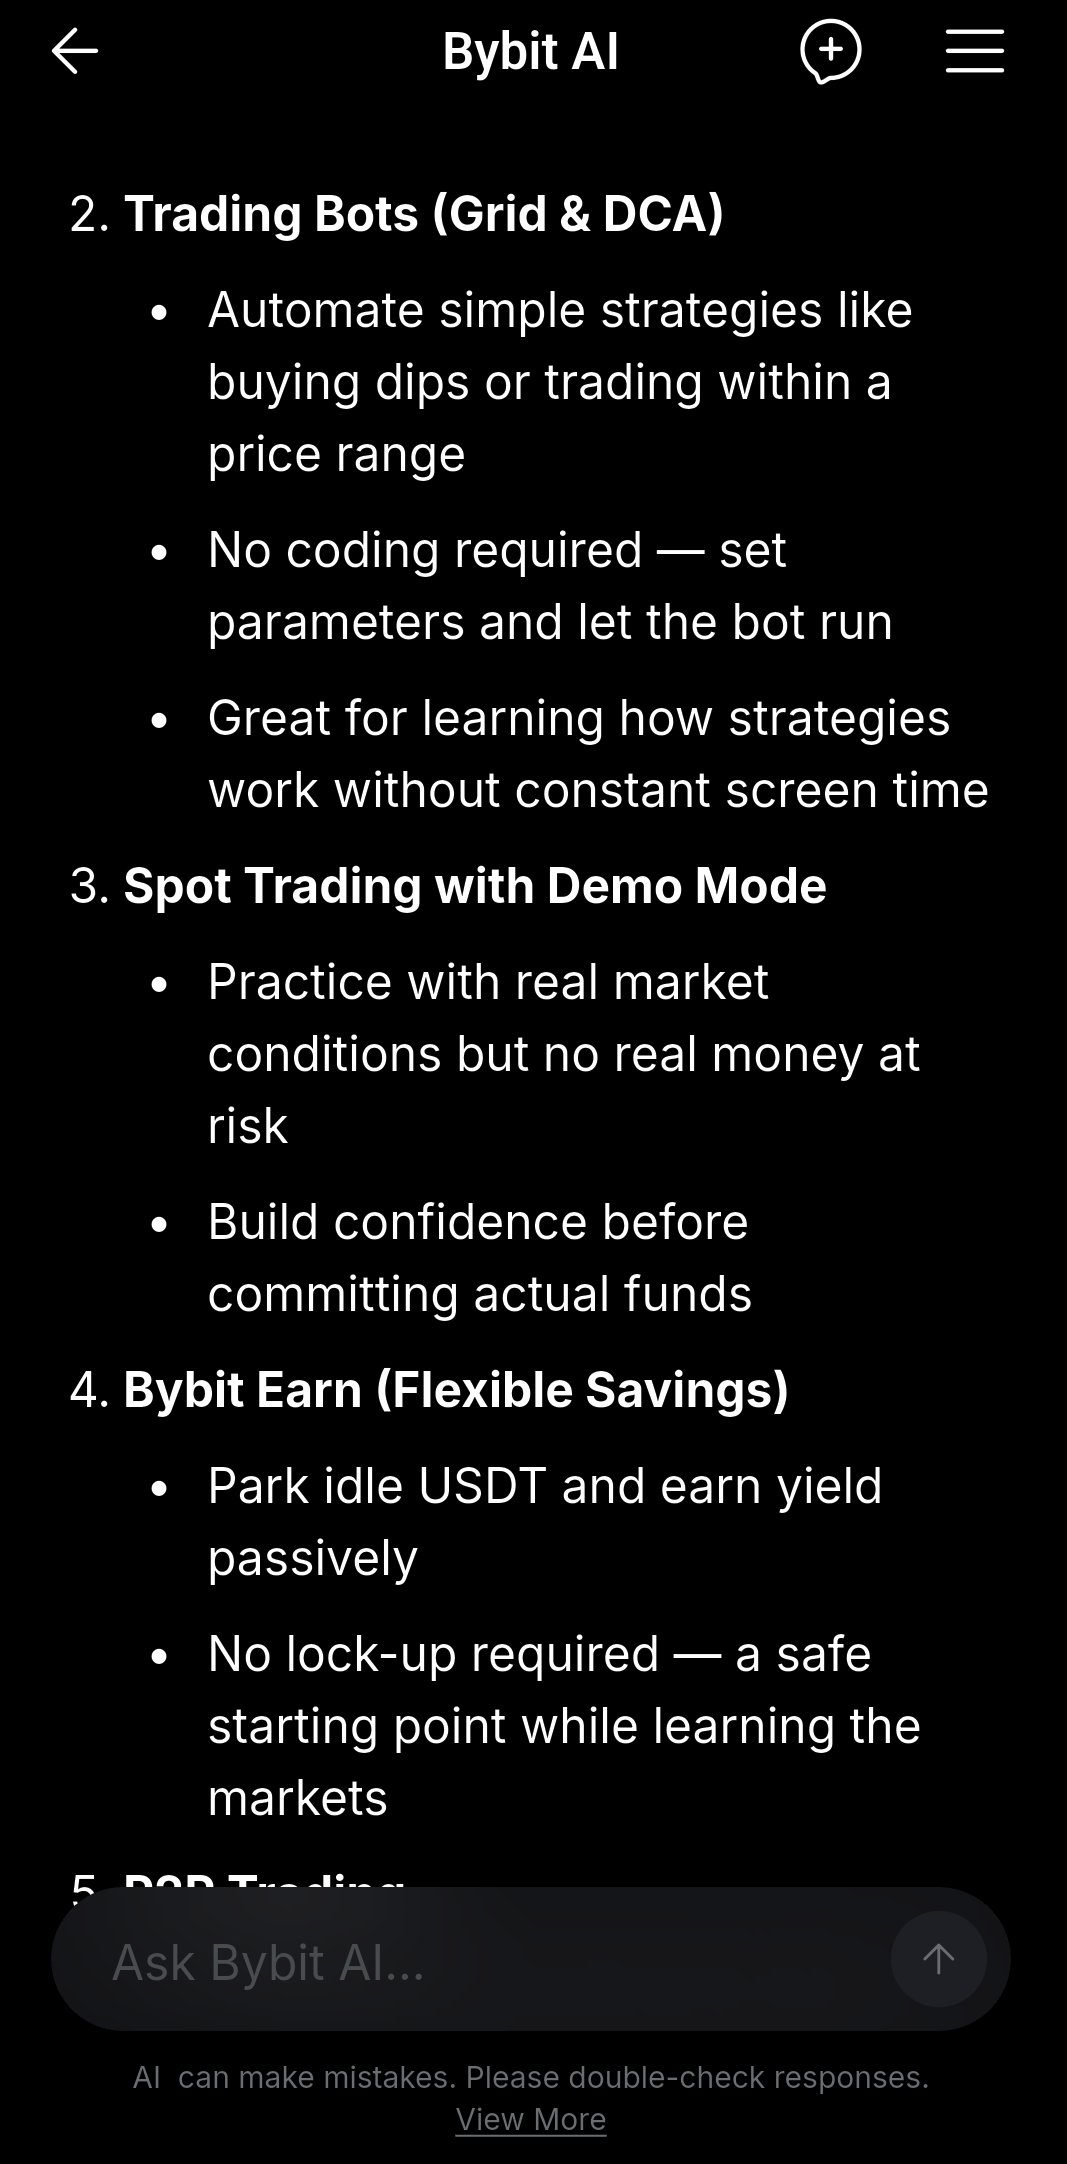
I asked Bybit AI which feature is most useful for new traders, and it gave me a detailed comparison of Copy Trading, Trading Bots, Demo Mode, Bybit Earn, and P2P Trading. I liked that the answer didn't just name one feature—it explained why Copy Trading could be useful for beginners and compared it with other options. What could be better: the response was a little too long for a simple question. A shorter summary with the top 2–3 recommendations first would make the answer faster and easier to understand. Overall, the response was useful and well structured, but making it more concise would improve the experience. $BTCUSDT $SOLUSDT #BybitAIBestReplies #FOMC #FOMCMinutes #TradFiOptions24/7 #ByXIMPACT


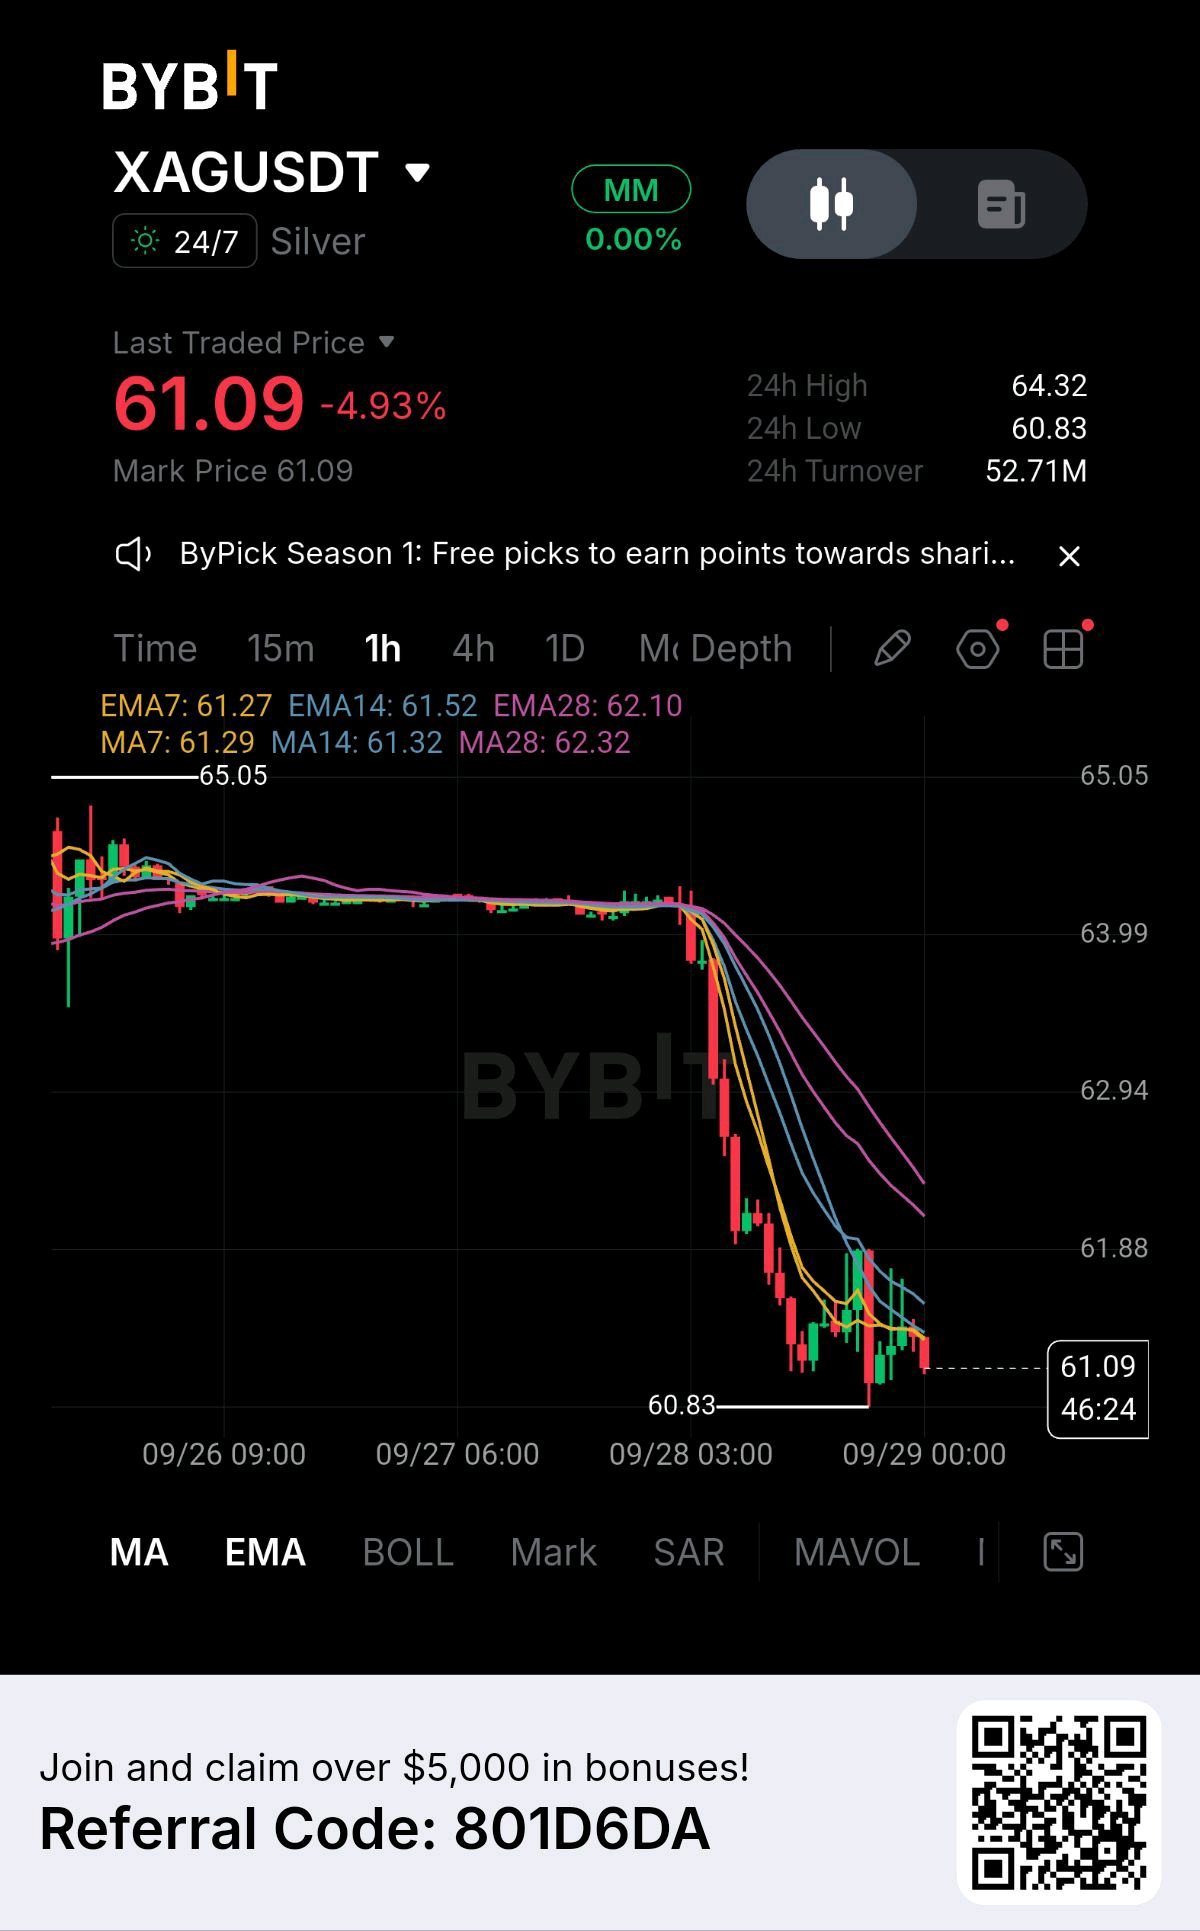
XAG caught my attention because the chart is showing a very different structure after that sharp sell-off. Silver is trading around $61.09, down 4.93%, after dropping aggressively from the $65.05 area and eventually finding buyers near $60.83. Since that sell-off, price has stopped making the same aggressive moves and started moving sideways around the $61.0–$61.3 region. That consolidation is important because it shows the market is trying to establish a new balance after the volatility. On the 1H chart: EMA7: $61.27 EMA14: $61.52 EMA28: $62.10 MA7: $61.29 MA14: $61.32 MA28: $62.32 The moving averages are still clustered relatively close to price, making the $61.25–$61.55 area an important decision zone. Right now, XAG is trading just below the short-term moving-average cluster. A clean move above $61.55 would give buyers their first sign of renewed momentum. From there, the first meaningful area to watch is around $62.94. Reclaiming that level would be more significant because it would start moving price away from the current consolidation zone. Above that, $63.99 becomes the next major resistance before the previous high around $65.05 comes back into focus. But the downside remains just as important. The $60.83 region is the major support visible on this chart. Buyers defended that area after the sharp decline, and as long as it holds, the current sideways structure can still develop into a recovery base. A break below $60.83, however, would seriously weaken the recovery setup and indicate that sellers may be attempting to regain control. So the structure is basically: $60.83 → Major support $61.25–$61.55 → MA/EMA decision zone $62.94 → First major resistance $63.99 → Key resistance $65.05 → Previous high What makes this setup interesting isn't the current -4.93% move. It's the fact that XAG went through a violent expansion, found support near $60.83, and is now attempting to stabilize around the short-term averages. That creates a much clearer battle between buyers and sellers. If buyers reclaim $61.55 and then push through $62.94, the chart could start showing signs that the recovery is gaining structure. If price continues getting rejected around the MA/EMA cluster and eventually loses $60.83, the entire recovery attempt would need to be reassessed. For now, I wouldn't focus only on the percentage move. I'd watch the range breakout. After a move as aggressive as the one XAG just experienced, the next meaningful expansion could come from whichever side finally wins this consolidation battle. 📈 $XAUTUSDT $BTCUSDT #ByXIMPACT
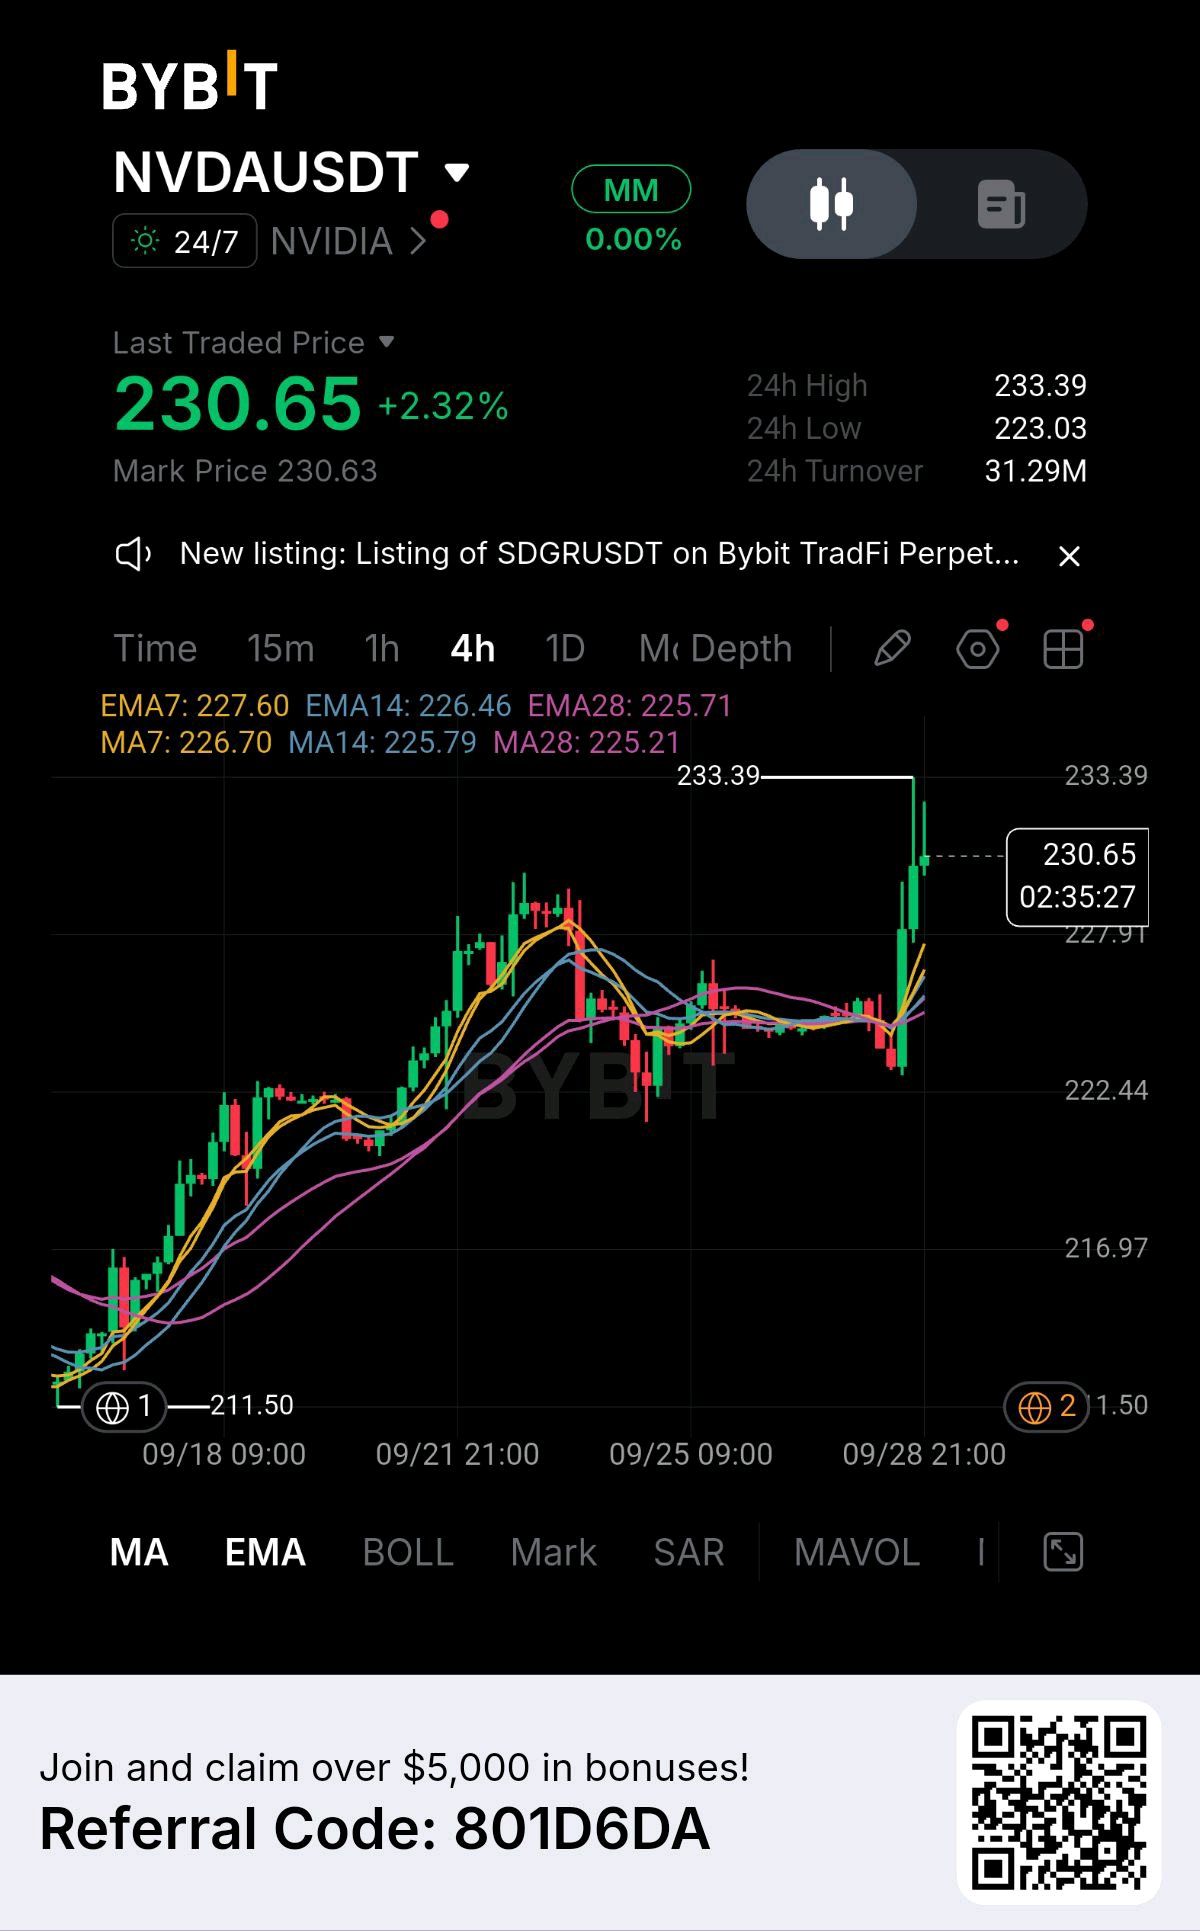
NVIDIA is demonstring a decisive upside expansion on the 4-hour chart, printing an impulsive green bar up to 233.39 before stabilizing around the 230.65 region (+2.32%). This aggressive spike effectively shattered days of tight range-bound trading, forcing short-term dynamic indicators into a steep bullish dispersion. The moving average hierarchy reflects instant buyer dominance, with EMA 7 (227.60) launching sharply above EMA 14 (226.46) and EMA 28 (225.71). This moving average spread confirms a swift injection of buying momentum, transforming the previous resistance zone into active underlying support. Analyzing the structural landscape, this expansion represents a high-conviction breakout from the prolonged equilibrium base established near 222.44–225.00. The broader uptrend retains firm anchoring at the major 211.50 swing low, which served as the original accumulation springboard for this entire multi-week leg. The rapid absorption of floating liquidity during the recent squeeze indicates that market participants were actively building long positions throughout the previous tight consolidation rather than liquidating. Heading into the upcoming sessions, technical focus centers squarely on the local peak at 233.39. A sustained 4-hour candle close above 233.39 with expanding volume will clear the remaining overhead supply and pave the way toward price discovery at higher levels. On the pullbacks, the 227.60 level (EMA 7) followed by the 225.71 zone (EMA 28) mark the primary demand defense lines where buyers are expected to step in on any shallow retests. Only a breakdown back below 222.44 would disrupt this immediate bullish structure. With momentum indicators expanding rapidly and price breaking out of its local consolidation, NVDAUSDT is signaling strong upside initiative. How are you navigating this breakout setup on the 4-hour timeframe? Are you entering on shallow EMA pullbacks or holding out for a clean candle confirmation above 233.39? Share your targets and trade setups in the comments below! $NVDAXUSDT #ByXIMPACT

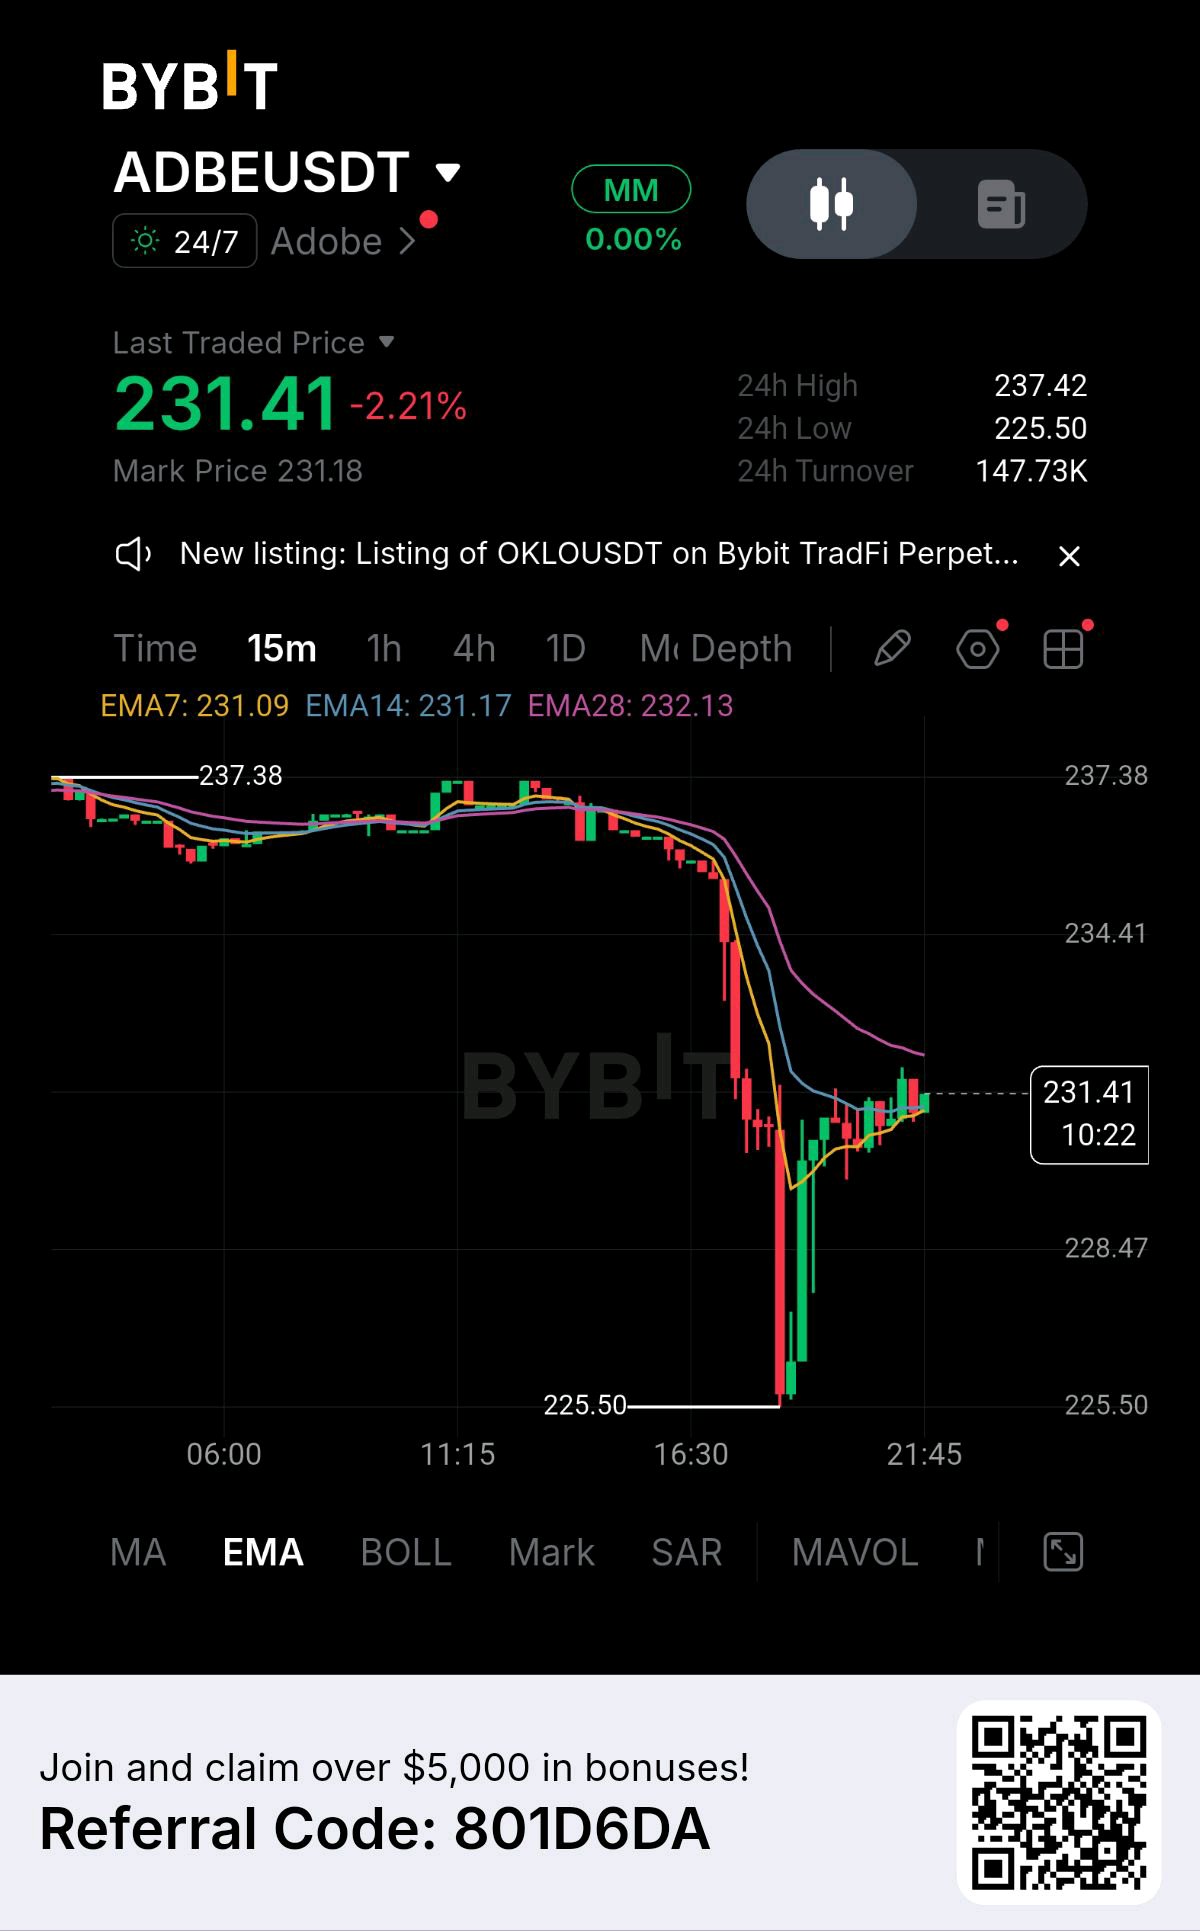
Adobe locked in a solid lower-wick turnaround off the 253.22 intraday demand basin, coiling at 231.41 (-2.21%) as smart money absorbs panic selling following an extended markdown from the 294.56 macro peak. Institutional order flow stepped in directly above 253.22 to halt the down-trend, forcing price into a high-compression squeeze directly against the 1H moving average ribbon—MA28 (257.52), MA7 (257.74), and MA14 (257.91). Supported by 147.73K in 24h turnover and seller exhaustion into deep discount territory, $ADBE is gathering kinetic force for a dynamic mean-reversion move to clear dynamic resistance and challenge the 263.55 supply shelf. TRADE PARAMETERS Pair: ADBEUSDT (1H Timeframe) Current Price: 231.41 Bias: Bullish Discount Re-accumulation / Mean-Reversion Rebound Buy Zone: 254.50 to 257.50 Stop Loss: 251.00 (1H close below 253.22 intraday support floor) PROFIT TARGETS Target 1: 260.10 Target 2: 263.50 Target 3: 273.80 TECHNICAL CONFLUENCES 1. Deep Discount Demand Defense at 253.22 Aggressive institutional buy orders halted the vertical descent at the 253.22 trough, trapping short-sellers and forming a resilient local accumulation floor. 2. Dynamic Moving Average Ribbon Pinch The tight convergence of 1H MA28 (257.52), MA7 (257.74), and MA14 (257.91) is compressing price into a high-tension coil, setting up an upward volatility expansion. 3. Seller Exhaustion in Oversold Territory Extensive markdown from 294.56 down toward the recent 225.50 low has exhausted sell-side liquidity, creating a potential mean-reversion setup. RISK & EXECUTION PLAN Build long positions inside the defined buy zone on lower-timeframe stabilization. The moment Target 1 is cleared, harvest initial partial profits and shift Stop Loss toward entry to manage downside risk into the higher targets. $BTCUSDT $SOLUSDT #ByXIMPACT

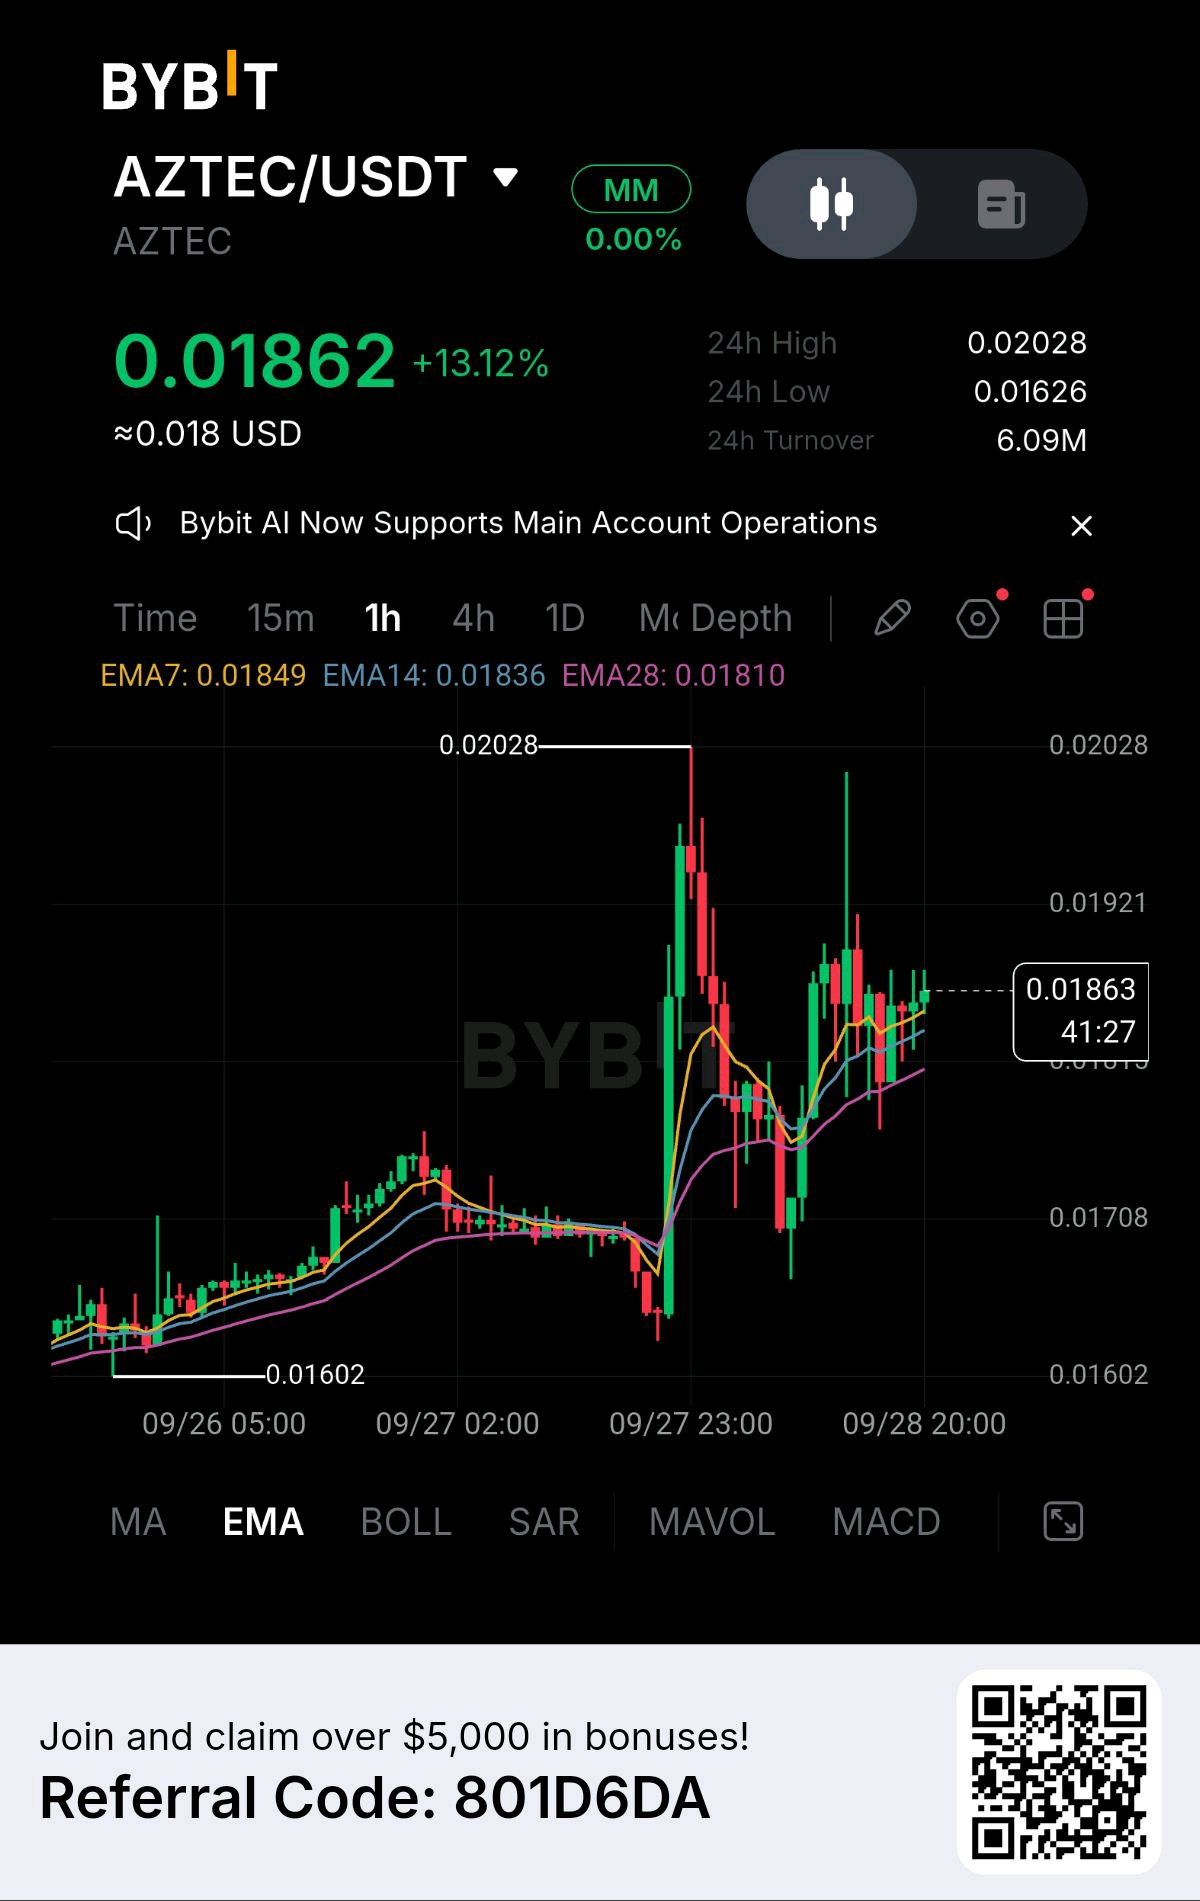
AZTEC is staging a noticeable momentum rebound on the 1-hour chart, currently holding around the 0.01862 mark with a +13.12% daily gain. After enduring an intense volatile shakeout from its 0.02028 peak, price action has managed to re-establish itself squarely above the short-term trendlines. The exponential moving average alignment reflects this shifting tide: EMA 7 (0.01849) has crossed back over EMA 14 (0.01836) and EMA 28 (0.01810), forming an ascending support stack beneath the active price candles. This structural reclaim signals that localized selling pressure has dissipated and aggressive buyers are stepping back in to guide order flow. Examining the chart's broader framework, the entire bullish leg draws its strength from the major baseline established at 0.01602. The violent whip-saw down toward the 0.01708 region served as a crucial liquidity grab, effectively flushing out over-leveraged positions before aggressive demand stepped in to absorb the floating supply. By defending 0.01708 and carving out a distinct higher low, the market has validated the presence of institutional interest at lower valuations, transforming a potential breakdown into a constructive re-accumulation structure. Looking ahead, the market faces a pivotal decision near key overhead technical levels. The immediate obstacle for buyers is the 0.01921 resistance zone, which marks the recent lower-high inflection point. A confident 1-hour candle close above 0.01921 with sustained volume expansion will likely open the gates for a full retest of the primary 0.02028 supply ceiling. On the flip side, as long as price maintains its stance above the dynamic 0.01810 EMA 28 floor, the bullish bias remains favoured, whereas a loss of this level would re-open the risk for another dip toward the 0.01708 support layer. With short-term moving averages angling upward and price attempting to push into upper range liquidity, AZTEC is positioning itself for a key continuation move. What is your strategy for this 1-hour AZTEC/USDT structure? Are you bidding the moving average retest near 0.0181–0.0184, or waiting for a clean breakout confirmation past 0.0192? Drop your technical analysis and trade plans in the comments! $AZTECUSDT #ByXIMPACT #ByPickMakeYourPickCount #BybitOdds #MakeYourMove #NewFinancialPlatform

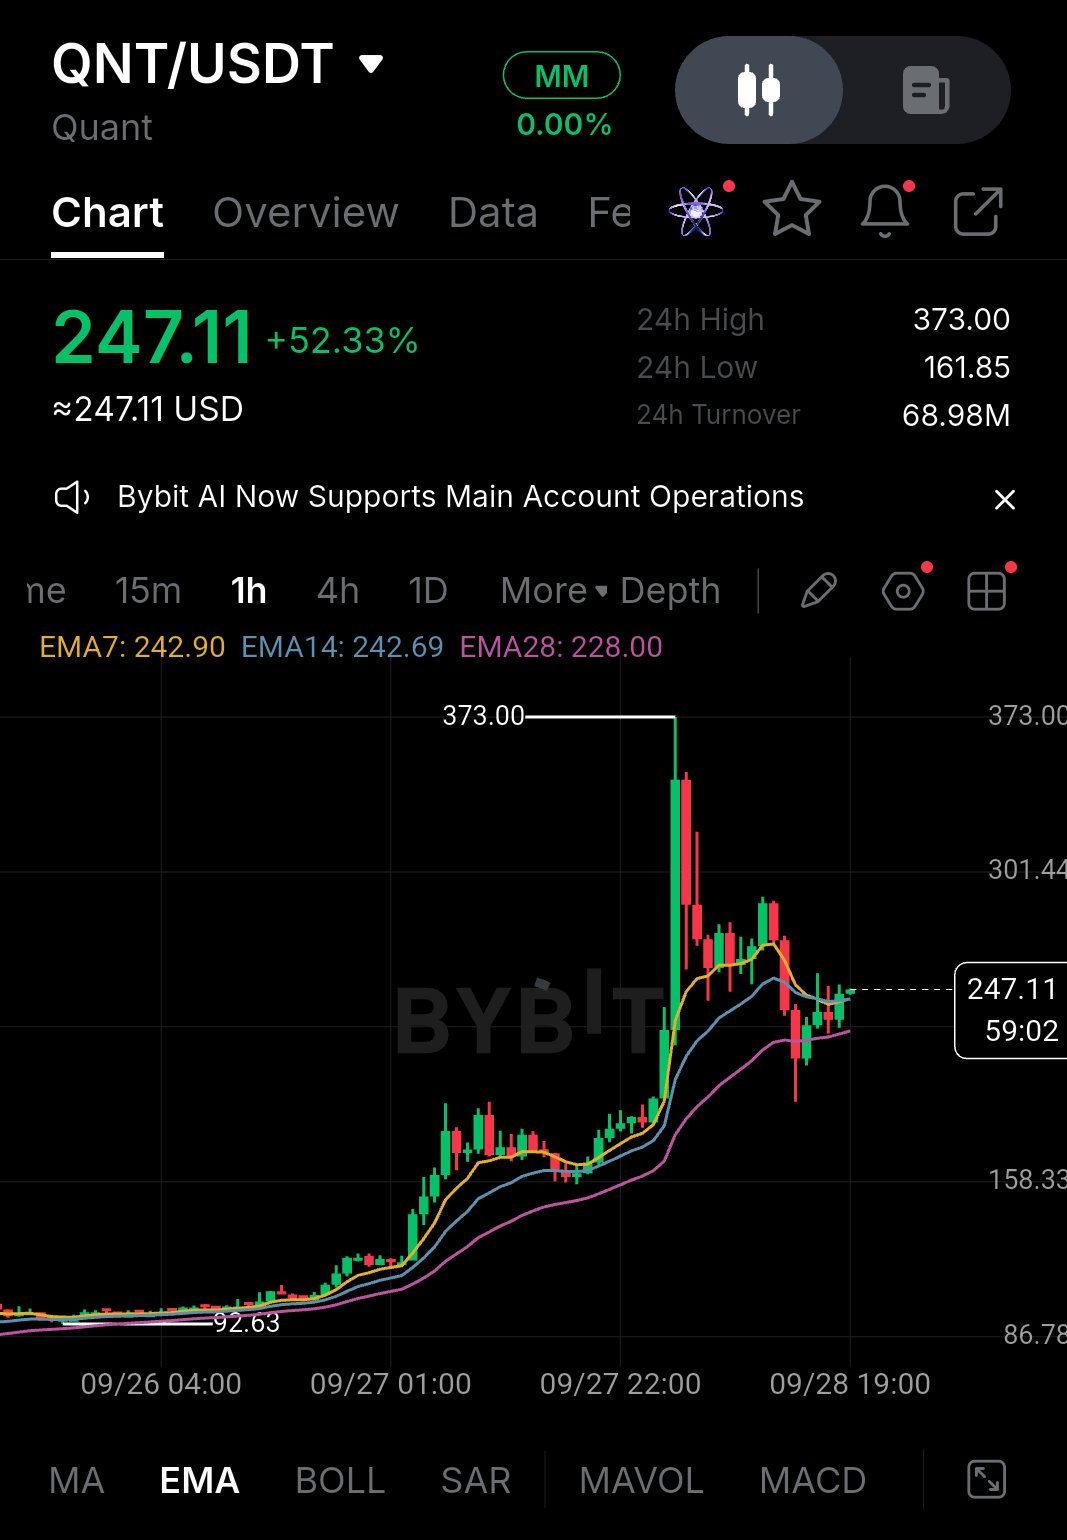
QNT witnessed an extraordinary volatility expansion on the 1-hour timeframe, surging toward a 24-hour high of 373.00 before undergoing a sharp profit-taking pullback. After sweeping sell-side liquidity down to the 161.85 low, price action mounted a swift recovery and is currently holding near 247.11. A key development on the chart is price reclaiming the dynamic EMA 7 (242.90) and EMA 14 (242.69) levels, which are now curling back above EMA 28 (228.00). This rapid stabilization indicates that aggressive selling pressure is diminishing as order flow transitions into a low-timeframe consolidation phase. Evaluating the broader structural footprint, the vertical rally originating from the 92.63 baseline generated massive market participation, driving 24-hour turnover to $68.98M. Following the initial rejection off the 373.00 top, price produced a secondary lower-high reaction peak at 301.44 before establishing the current equilibrium band. The fact that buyers are holding price firmly above the 228.00–242.00 moving average region prevents a full unwind of the move, suggesting that market participants are absorbing floating supply to construct a higher support floor. Moving forward, technical attention shifts toward how price interacts with surrounding key boundaries. A sustained 1-hour acceptance above the dynamic 242.90 EMA cluster keeps the immediate bias tilted upward toward a retest of the 301.44 intermediate resistance. Breaking through 301.44 with expanding volume would be the primary catalyst required to reopen a path toward the 373.00 major peak. Conversely, losing the 228.00 EMA 28 support on a candle close would invalidate this immediate recovery, likely forcing a secondary liquidity sweep down toward 158.33. With hyper-volatility resetting and price compressing around dynamic moving average support, QNT is preparing for its next major expansion. How are you executing on this 1-hour QNT/USDT structure? Are you bidding the EMA reclaim around 242–228, or waiting for a confirmed breakout above 301.44? Drop your chart setups and targets in the comments below! $QNTUSDT #ByXIMPACT #ByPickMakeYourPickCount #PolyMarketPreIPO #BybitAIBestReplies #BybitOdds