CryptoLegend
Crypto Trader web3 Content Creator
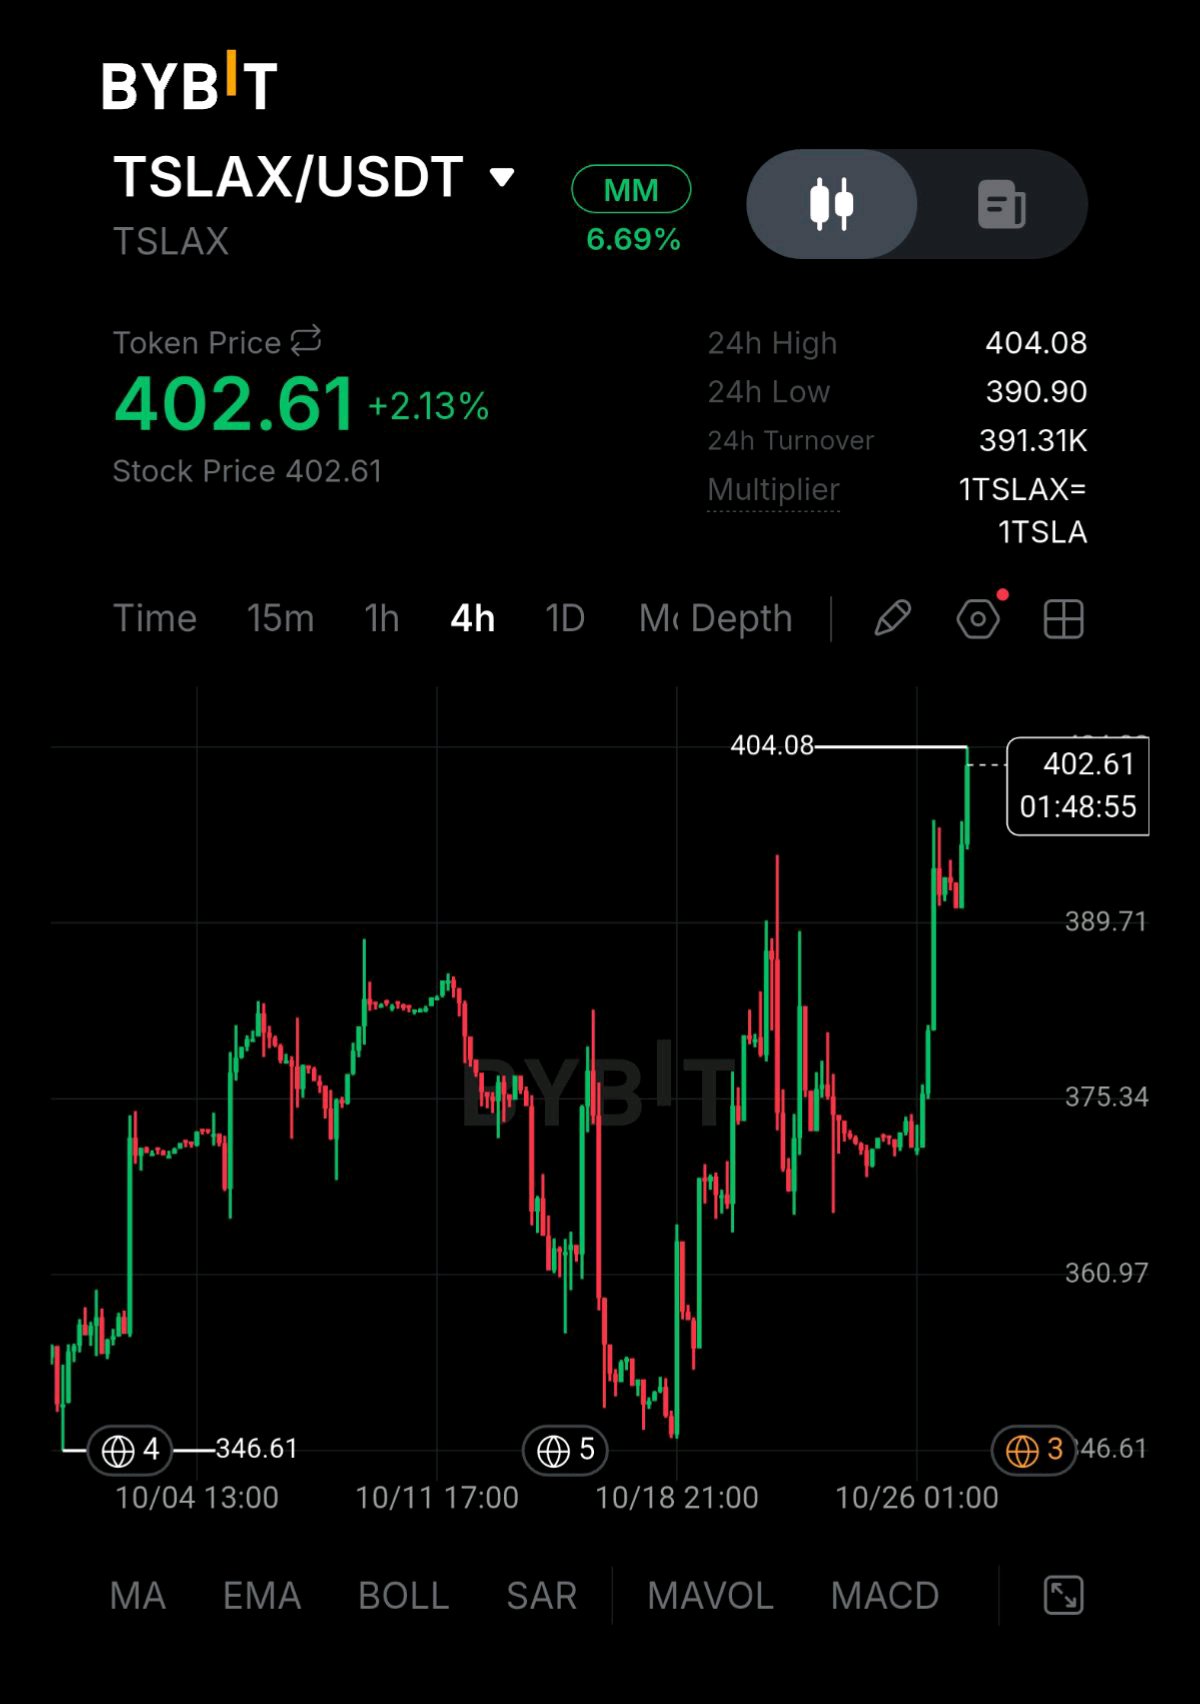
TSLAX is up 2.13% at $402.61 pushing to a fresh high and extending one of the sharpest moves on any chart this month. This isn't a routine breakout it's a stock being repriced around real takeover speculation. The catalyst is clear and it's a big one. Barclays upgraded Tesla to Overweight on Monday lifting its price target to $450 from $370 and explicitly tied the call to growing odds of a Tesla-SpaceX merger something Barclays suggested could be announced as soon as before December with special committees reportedly already formed at both companies to review it. That news alone drove a 5.2% jump on volume running nearly 50% above average a scale of participation that signals institutional money actually repositioning, not just retail chasing a headline. The chart reflects that repricing almost exactly. After weeks of choppy, directionless trading between roughly $347 and $390, price broke decisively higher right on the Barclays news and hasn't looked back, pushing straight through the old range ceiling to a fresh high of $404.08. That kind of clean break on a specific, large catalyst tends to hold better than a technical breakout with no story behind it and the analyst picture backs that read: only 5 of 60 covering analysts still rate the stock a sell the fewest in over a decade. The level that matters now is $390.90-397.27 the shelf this move broke out from. Holding above it on any pullback keeps the breakout intact. The next real resistance sits in the $406-410 zone where price would be pushing into territory last seen back in June and July The risk to watch is the merger story itself this is speculation not a confirmed deal and any cooling of that narrative could unwind the move quickly given how fast it built. What I'm watching: a hold above $390.90 to confirm the breakout or a fade back into the old range that would suggest the merger premium is being questioned. $TSLAXUSDT #ByXIMPACT #IMPACTbyTrade #MyByXTake

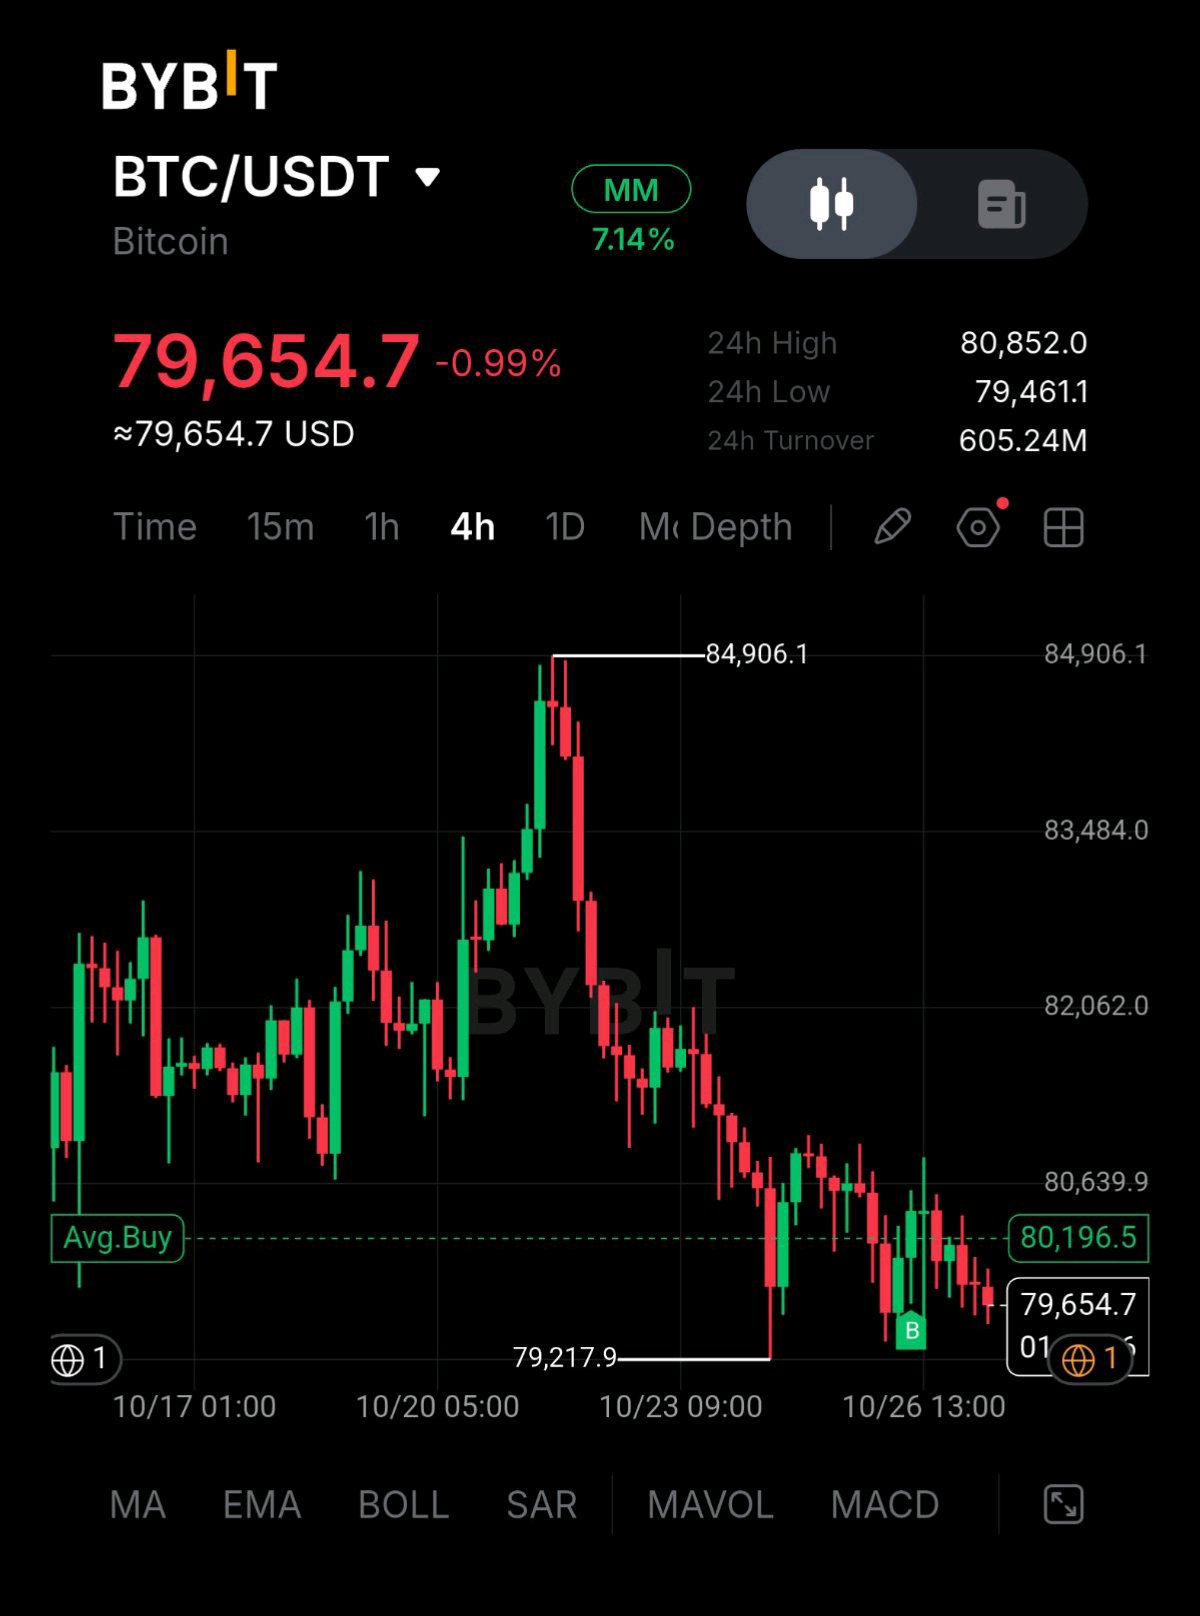
BTC is down 0.99% at $79,654.7 pressing right back against the floor that held a day earlier. This is now the fifth straight down day on this chart, and the pattern is a market in a genuine standoff ahead of tomorrow's Fed decision. The range has become well-defined. Since the drop from $84,906.1, price has carved out repeated tests of the $79,217-79,461 zone, each one getting bought, but each bounce capping out lower than the last, now struggling to even reclaim $80,639 before rolling over again. That's the signature of a market in a holding pattern rather than trending, exactly what you'd expect with a nearly fully priced-in Fed outcome just a day away. Bitcoin lost its 50-day moving average over the weekend and hasn't won it back which is adding technical weight to the hesitation on every bounce attempt. There's a genuine split in the data worth flagging. ETF flows just turned positive again, $110 million in Monday ending a two-day outflow stretch with all of it concentrated in one fund. That's a mild positive signal sitting underneath a chart that's still grinding lower the kind of divergence that often resolves once the actual catalyst, the Fed decision, finally lands and gives the market a reason to commit. The level that matters is $79,217-79,461. That's held multiple times now, and the market widely treats it as the immediate battleground a clean break below opens the door toward $78,000 and ultimately $75,000 if the slide extends. Reclaiming $80,639-80,960 would be the first sign of real stabilization. What I'm watching: whether $79,217 holds into tomorrow's Fed decision or a break below it that puts $78,000 in play. $BTCUSDT $BTCUSDC #ByXIMPACT #IMPACTbyTrade #MyByXTake

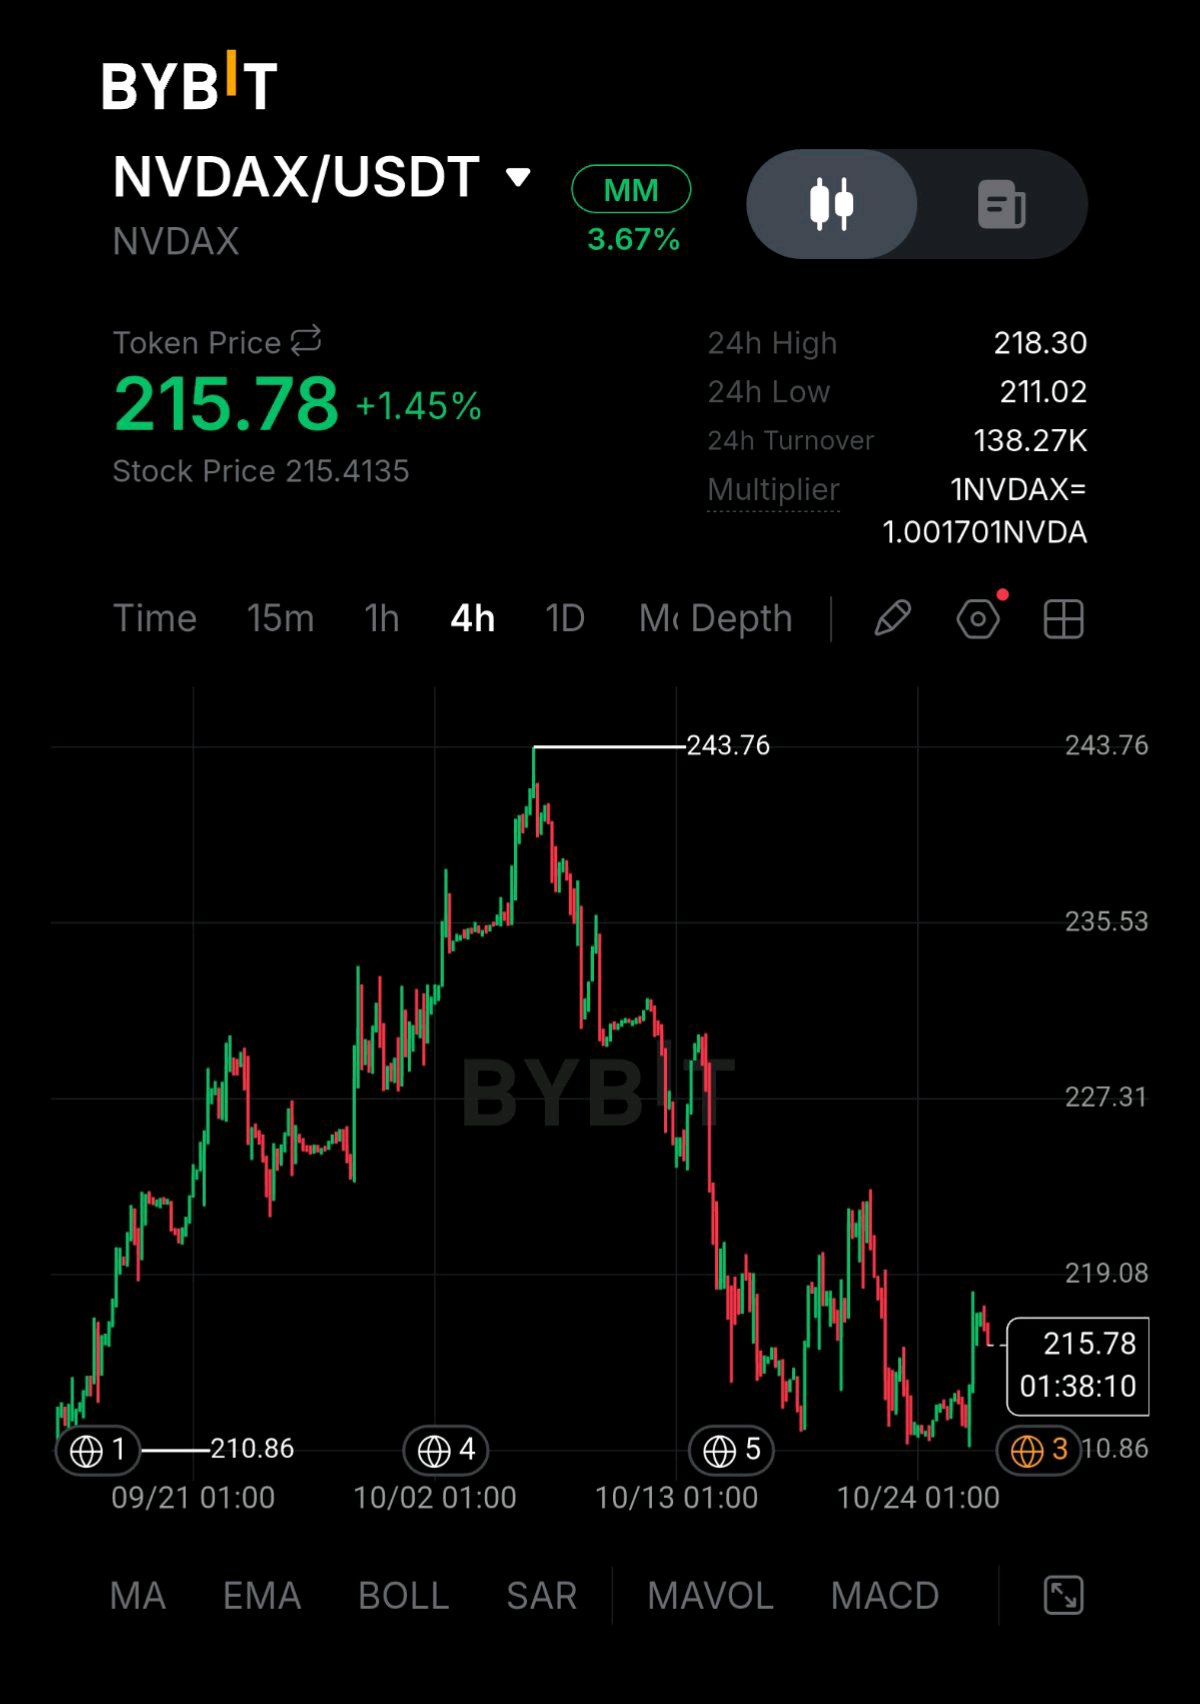
NVDAX is up 1.45% at $215.78 extending the bounce off the $211.02 double bottom that held through last week slide Zoomed out this move is now part of a much bigger clearer story than a single day candle The full month tells it well. From the $243.76 peak NVDAX fell in a sustained near uninterrupted slide down to $211 an eight session selloff that on the underlying stock side wiped out roughly $2 trillion in semiconductor market value as AI infrastructure financing fears spread across the sector That's not noise that's a real repricing of risk What makes today's bounce meaningful is the catalyst behind it Anthropic IPO filing and Meta plan to raise up to $95 billion in share sales with Nvidia itself named as a cornerstone investor alongside AMD and Broadcom reignited the AI trade just as the stock was testing its lows. That combination matters A technical bounce off a double-bottom is one thing a bounce backed by a fresh demand side catalyst is another and this chart has both Turnover at 138.27K is picking up from the quiet consolidation days before it consistent with real buying returning rather than a weak reflex bounce. The level that matters now is $219.08-227.31. That's the shelf this chart broke down through on the way to the lows, and reclaiming it would be the first sign this bounce is turning into a real recovery rather than a pause inside a downtrend The $211.02 low remains the line that needs to hold losing it again would undo the double bottom structure that's formed there. What I'm watching: a push through $219-227 to confirm the recovery or a slip back toward $211 that would put the stabilization in question. $NVDAXUSDT #ByXIMPACT #IMPACTbyTrade #MyByXTake

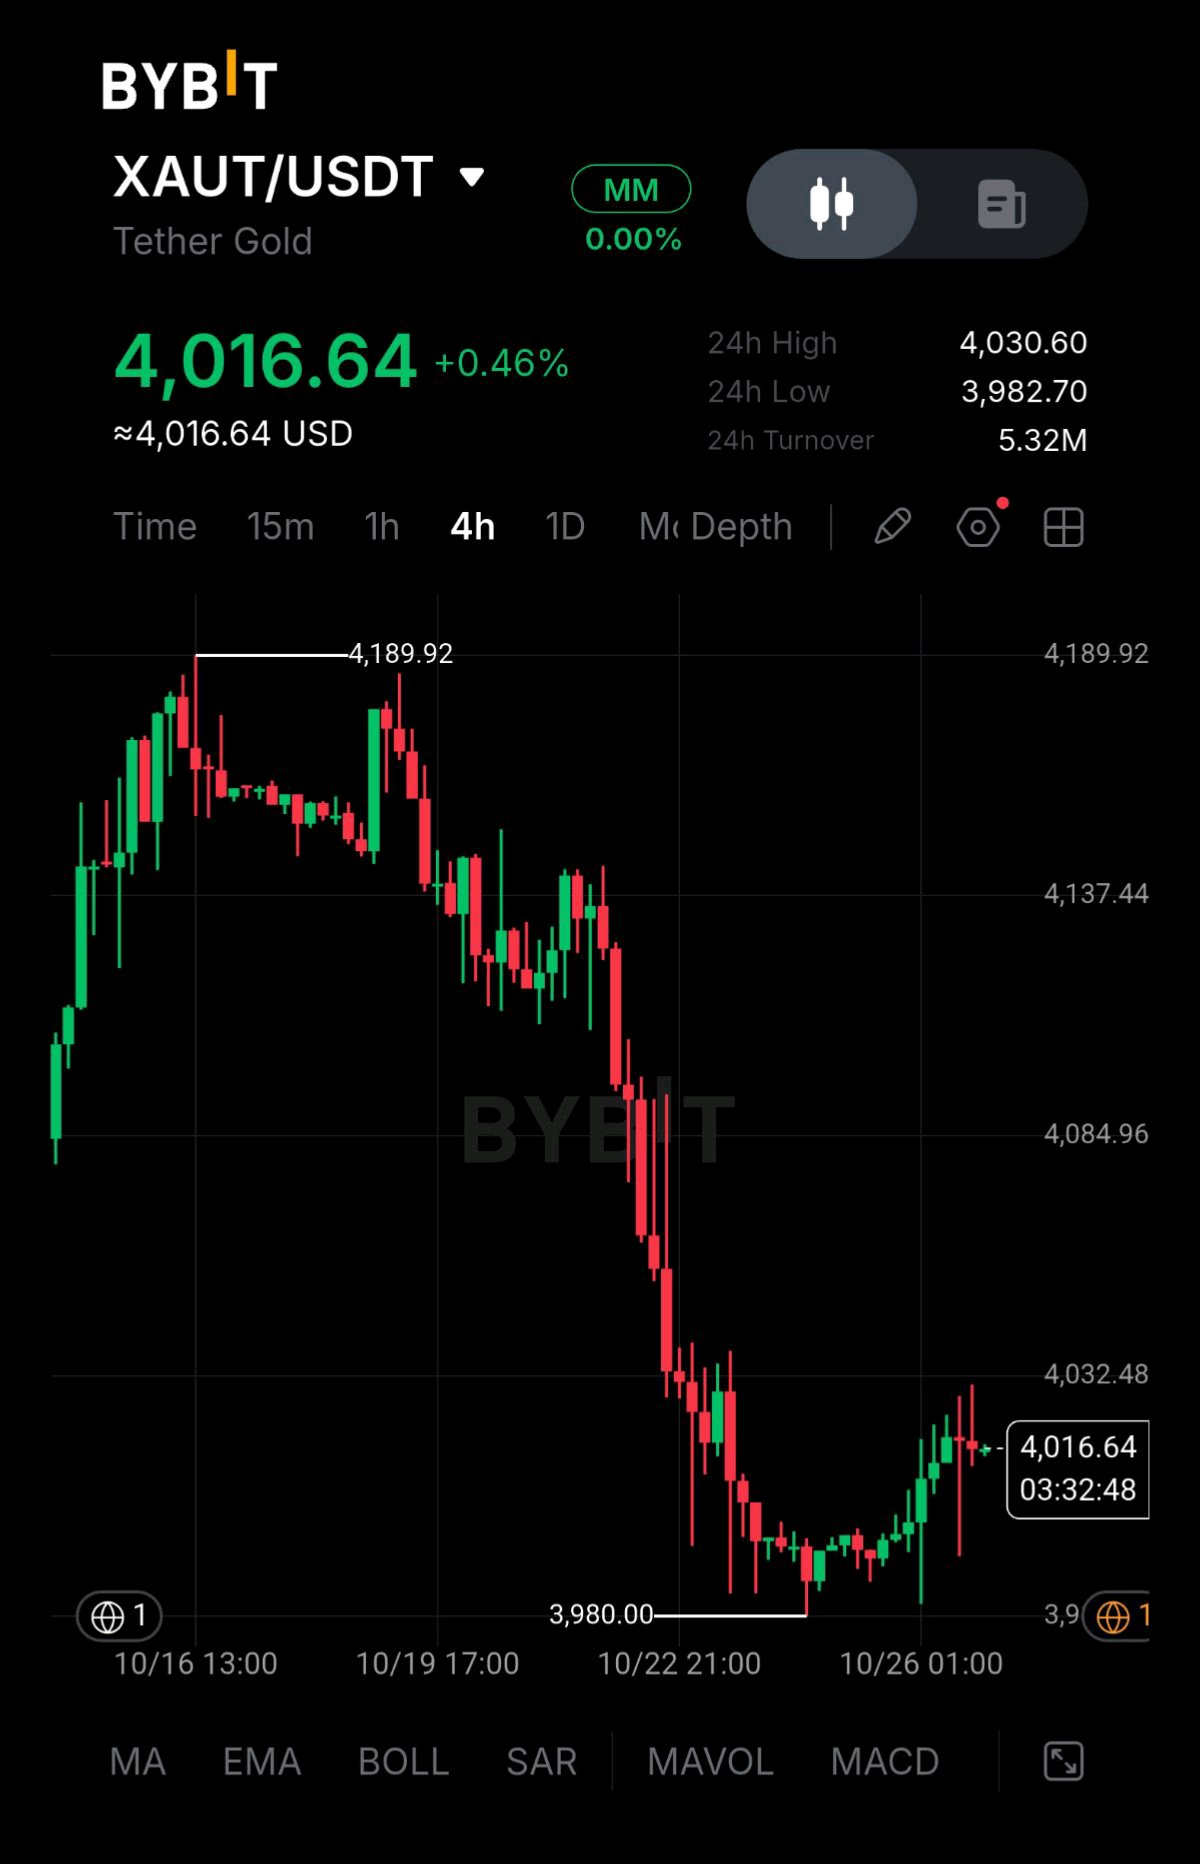
XAUT is up 0.46% at $4,016.64 and this chart is the clean technical picture of a macro story a sharp breakdown a brutal week and now the first real stabilization attempt right at a round-number floor. The decline has an obvious cause. Gold held a range roughly between $4,100 and $4,200 for weeks, then broke down hard as crude oil spiked and revived rate-hike fears a slide that cost gold more than $150 in a single week. This chart shows that breakdown almost textbook: a drop from $4,189.92 that accelerates rather than slows cutting straight through $4,137, then $4,084 then gapping down toward $4,032 before finally bottoming near $3,980. That's not profit-taking that's a genuine repricing around a macro catalyst. What's happened since the low is the more important part right now. Oil has started cooling, easing the same inflation anxiety that drove the selloff and gold has found a floor right at the $3,980-4,000 zone bouncing in a clean V-shape back to today $4,016.64. Markets are also squaring positions ahead of Wednesday's Fed decision which tends to produce exactly this kind of cautious, range bound stabilization rather than a decisive move in either direction. The level that matters is $4,032-4,084. That's the base of the sharp drop, and reclaiming it would be the first sign this bounce has real legs rather than just a dead-cat recovery. The two things to watch into Wednesday are the same ones driving the whole move: the 10 year yield holding below 5.00% would support further recovery, while a re-spike above it would likely send gold back toward the $3,980 low. What I'm watching: a reclaim of $4,032 for a real recovery signal or a slip back toward $3,980 if yields push higher into the Fed decision. $XAUTUSDT #ByXIMPACT #IMPACTbyTrade #MyByXTake

TSLAX is up 5.81% at $395.16, while ETH is down 1.59% around $2,320.56. What makes this divergence interesting is that both charts are testing the consequences of very different stories: Tesla is regaining momentum around its AI and autonomy ambitions, while Ethereum is struggling to turn its underlying ecosystem activity into stronger market demand. The four-hour chart shows a substantial recovery from $347.58. After climbing toward $386 and then spending several sessions consolidating around $370–$373, TSLAX has suddenly accelerated higher. The latest move pushed price to $398.13, bringing it close to the top of the visible range. This is not just another small bounce. The market has moved out of a prolonged base and into a strong upward expansion, with turnover reaching approximately $855.97K. There is a fresh fundamental catalyst behind the renewed attention. Tesla recently reported third-quarter revenue of around $28B and adjusted earnings that exceeded analyst expectations, while free cash flow reached $1.5B. The company is also targeting the launch of customer Cybercab sales before the end of 2026 although regulatory scrutiny remains an obstacle. Investors are also weighing the possibility of a Tesla–SpaceX combination. That possibility has attracted fresh market attention, but discussions are not the same as a completed deal, and significant hurdles remain. That combination of renewed price momentum and a developing autonomy narrative helps explain why Tesla is attracting attention again. $398.13 is the immediate ceiling. A sustained break above it would strengthen the breakout structure. If price retreats, $385.49 is the first visible area to watch, followed by $372.85. A deeper move toward those levels would test whether the latest surge has created a durable base or simply a sharp rally. ETH has fallen from $2,526.76 and continues to form lower highs and lower lows. Its latest price near $2,320.56 sits well below the $2,343.76 area, which now becomes an important recovery level. U.S. spot Ethereum ETFs recorded approximately $224.96M in net outflows for the week ending October 23, according to recent market reporting. That contrasts with inflows into Bitcoin ETFs and suggests institutional demand has been less supportive of ETH lately. At the same time, Ethereum's next development milestone has encountered a delay. Developers postponed a planned Hoodi testnet activation while reviewing changes related to gas costs and network behavior. That doesn't mean Ethereum's long-term development is broken, but it removes one near-term catalyst while the market is already under pressure. The disconnect is important: Ethereum can continue building useful infrastructure while its token struggles to attract fresh capital. Network progress and short-term price performance do not always move together. On the chart $2,282.77 is the level I would watch closely. A break below it would extend the current weakness. To improve the short term picture, ETH first needs to recover $2,343.76, then challenge $2,404.76. Until that happens, a bounce alone doesn't establish a reversal. Tesla is attempting to convert a long consolidation into a fresh breakout while ETH is trying to stop a declining structure from extending lower. One has momentum but must prove it can hold its gains; the other has a strong underlying ecosystem but needs demand and price action to recover together. The next few sessions could tell us whether Tesla breakout has staying power and whether ETH can defend its recent low Which setup looks stronger to you right now: TSLAX continuing toward $400 or ETH reclaiming $2,344? $TSLAXUSDT $ETHUSDT #IMPACTbyTrade #MyByXTake #ByXIMPACT


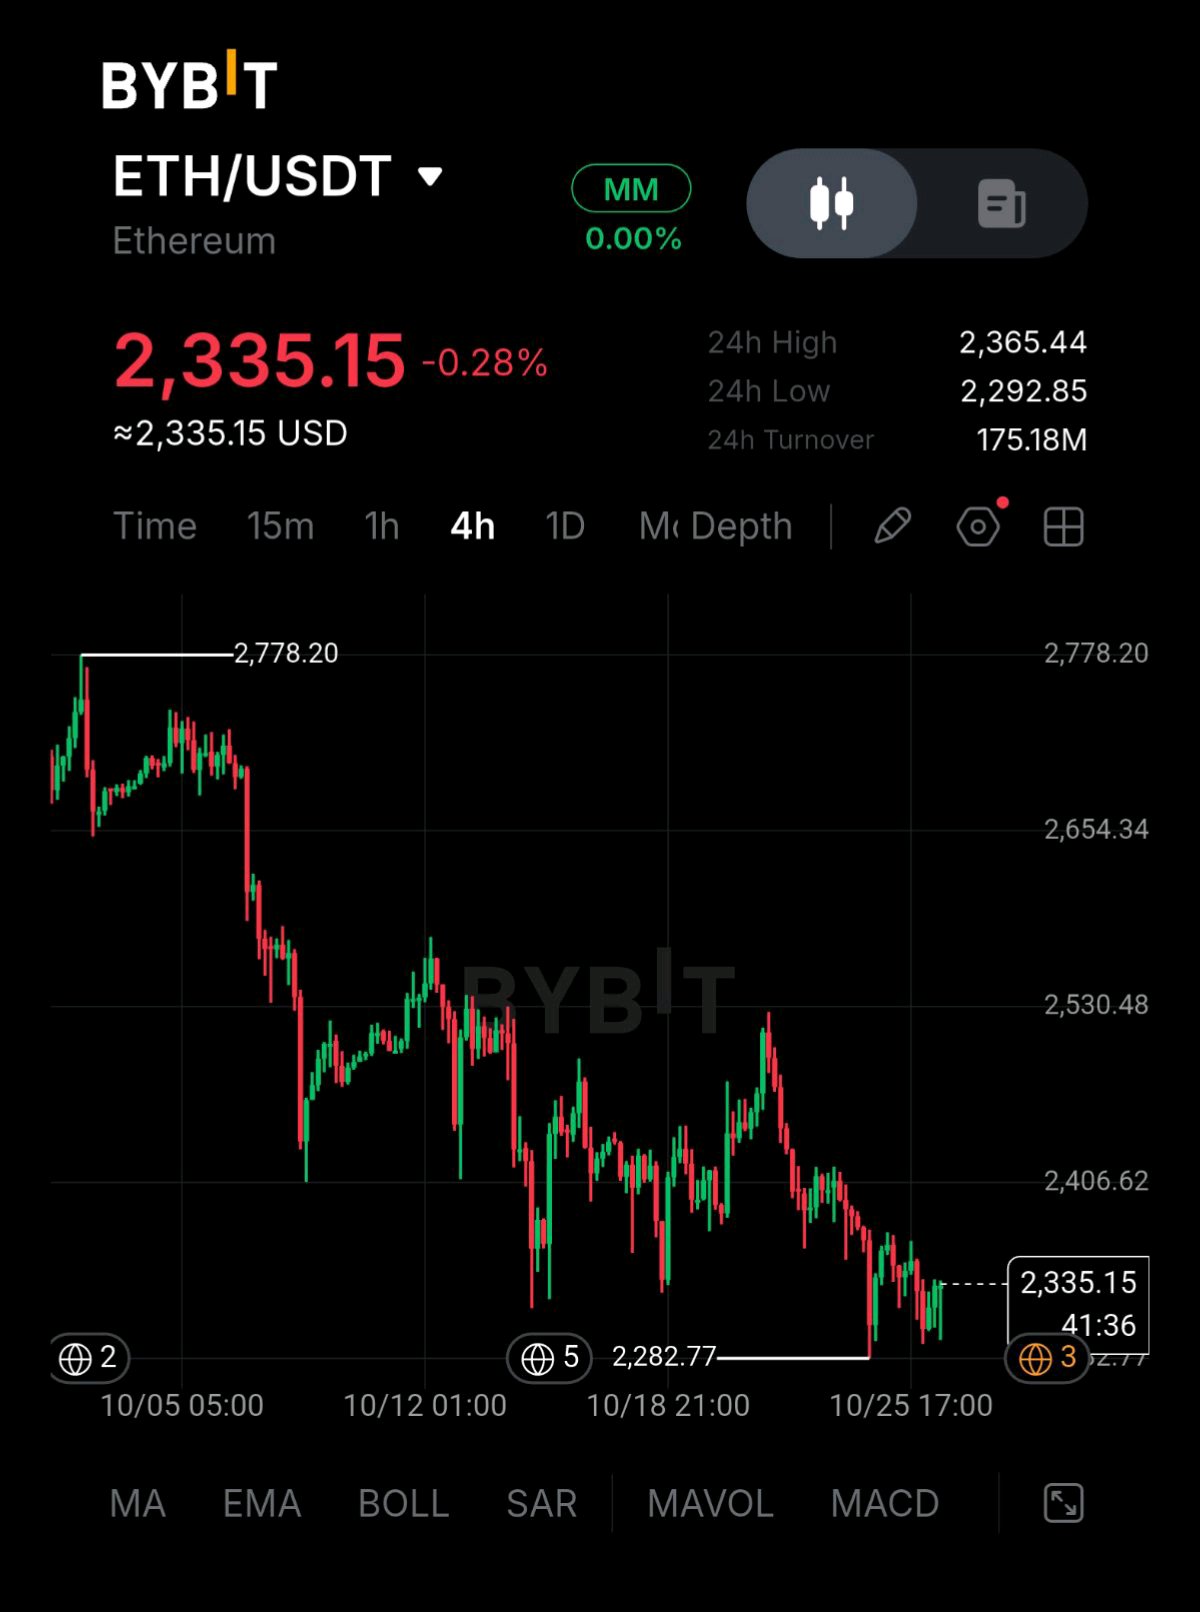
ETH is down a slight 0.28% today at $2,335.15, sitting right at a level the broader market has been watching closely. This chart's month-long slide from $2,778.20 has landed almost exactly on the $2,300 zone that's being talked about as critical support right now, and that context matters more than today's small red candle. The decline itself has had a clear shape: a sharp initial drop from the $2,778 peak, then a long stretch of failed recovery attempts each bounce topping out lower than the last through $2,654, then $2,530 now struggling to hold even $2,406. That persistent lower high pattern lines up with what's been driving it. Ether ETFs have bled around $1.07 billion in net outflows this month alone, and that sustained institutional selling pressure is a big part of why every rally attempt on this chart has run out of steam early. What makes today's level significant is that $2,300 isn't just a round number, it's where Ethereum's long-term moving average sits too, a real technical confluence rather than an arbitrary line. Price has now tested the $2,282-2,300 zone multiple times on this chart without breaking it outright which is the first sign of a floor even inside an otherwise weak month. The level that matters is $2,282.77, the recent low. Holding above it keeps this looking like consolidation at support rather than a breakdown in progress. Reclaiming $2,406-2,450 would be the first real sign of stabilization. Lose $2,282 instead and the next real test comes into view: $2,200 is where downside risk is seen opening up if selling pressure intensifies from here. What I'm watching: whether $2,282-2,300 holds as the floor or a break below it that opens the path toward $2,200. $ETHUSDT $ETHUSDC #ByXIMPACT #IMPACTbyTrade #MyByXTake

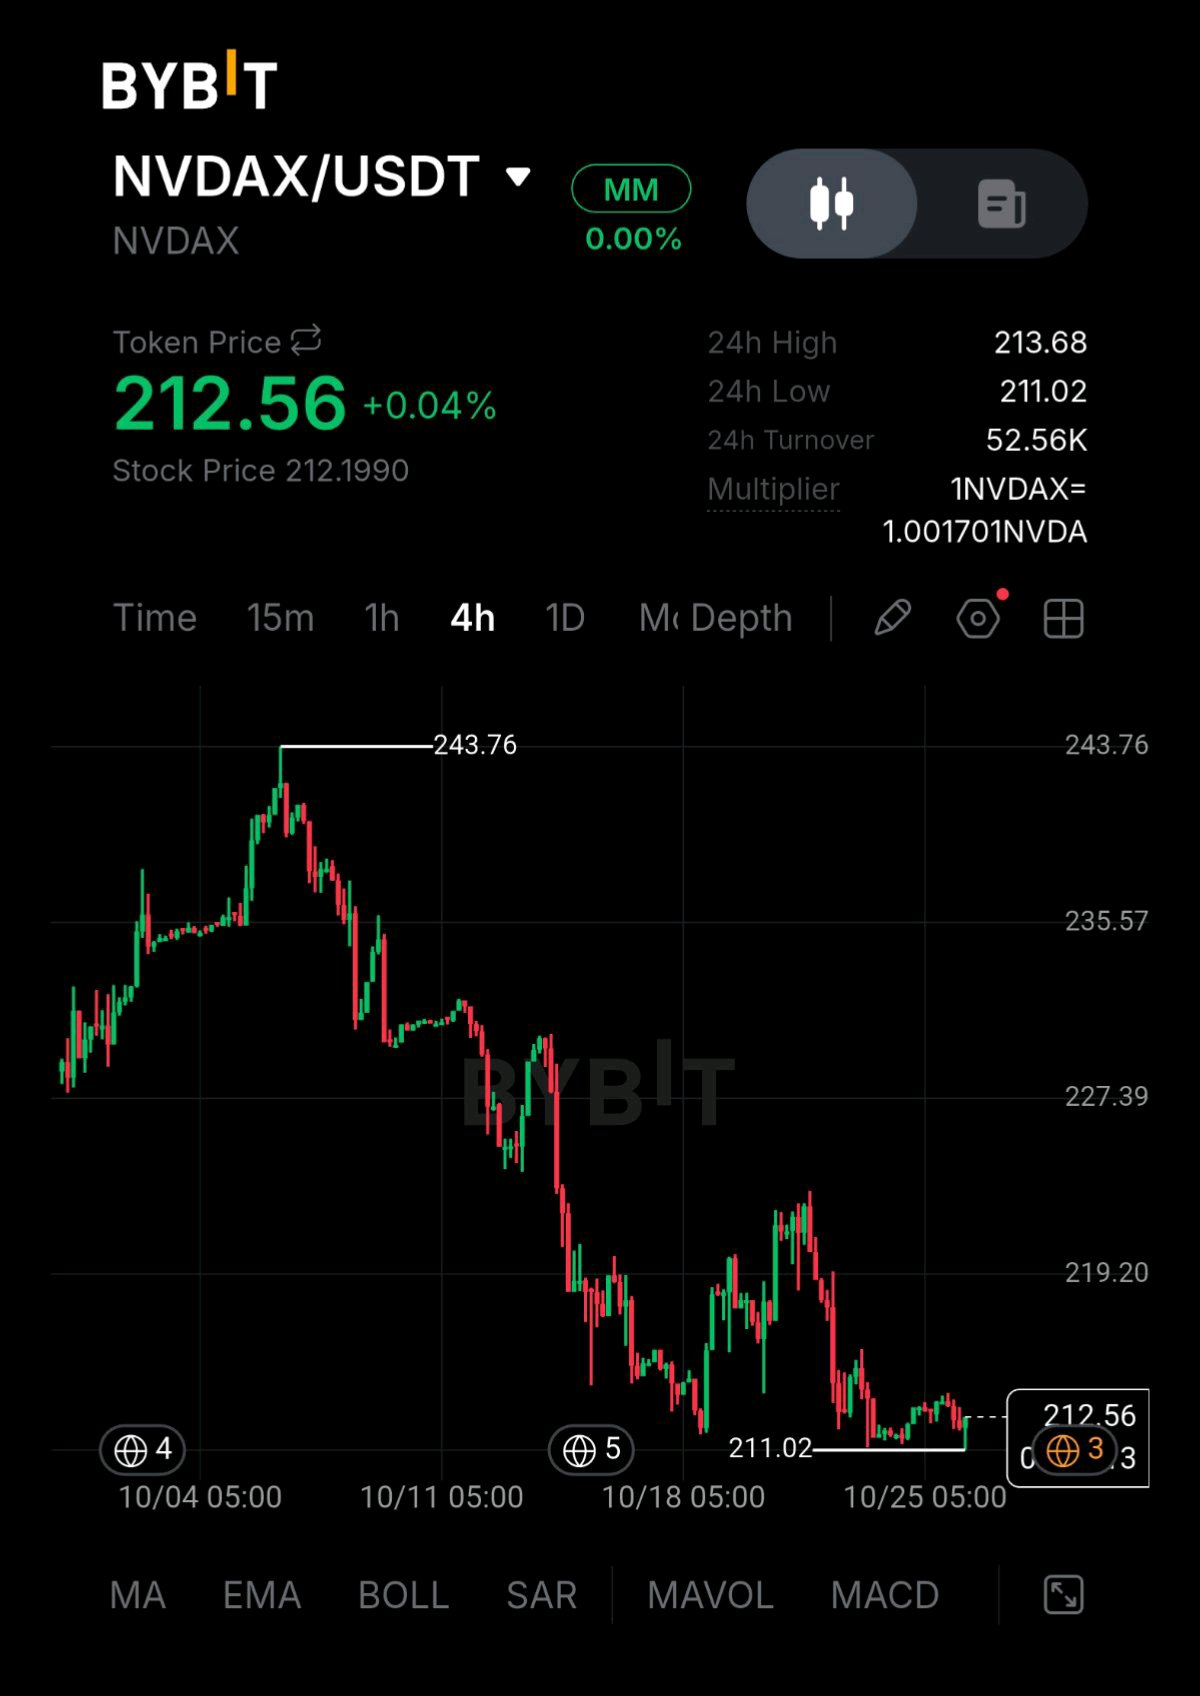
NVDAX is up a marginal 0.04% at $212.56 and after three weeks of straight-line selling a flat day near the lows is itself worth noting This chart has gone from a clean top at $243.76 to a slow, grinding decline that's only just starting to show signs of catching its breath. The decline itself has been unusually persistent. From the $243.76 peak, price fell in a near-uninterrupted stairstep through $235, $227, $219, bottoming near $211 before a small bounce attempt failed and brought it right back down to retest that same low. That's not a sharp crash, it's a sustained derating, and it lines up with the broader story around this name. The stock closed at a 20-day low on Friday sitting below both its 20-day and 50-day moving averages down over 6% in the past month amid a wider market reassessment of AI infrastructure spending even as the underlying business kept accelerating, profit growth actually sped up over the past year rather than slowing. That gap between weakening price and strengthening fundamentals is the real tension sitting under this chart. Today's price action is the first genuinely quiet session after that whole slide holding in the $211-213 band without making a fresh low or a real bounce. Turnover at 52.56K is on the lighter side, consistent with a market pausing rather than deciding. The level that matters is $211.02, the low this chart has now tested twice. A third test that holds would start to look like a real floor forming. Losing it opens clean air below since nothing in this slide has acted as support beneath that level yet. On the upside $219.20 is the first real resistance the last area price held before this stairstep down accelerated. What I'm watching: whether $211.02 holds as a double-bottom floor or a break below it that confirms the slide is not done. $NVDAXUSDT #ByXIMPACT #IMPACTbyTrade #MyByXTake

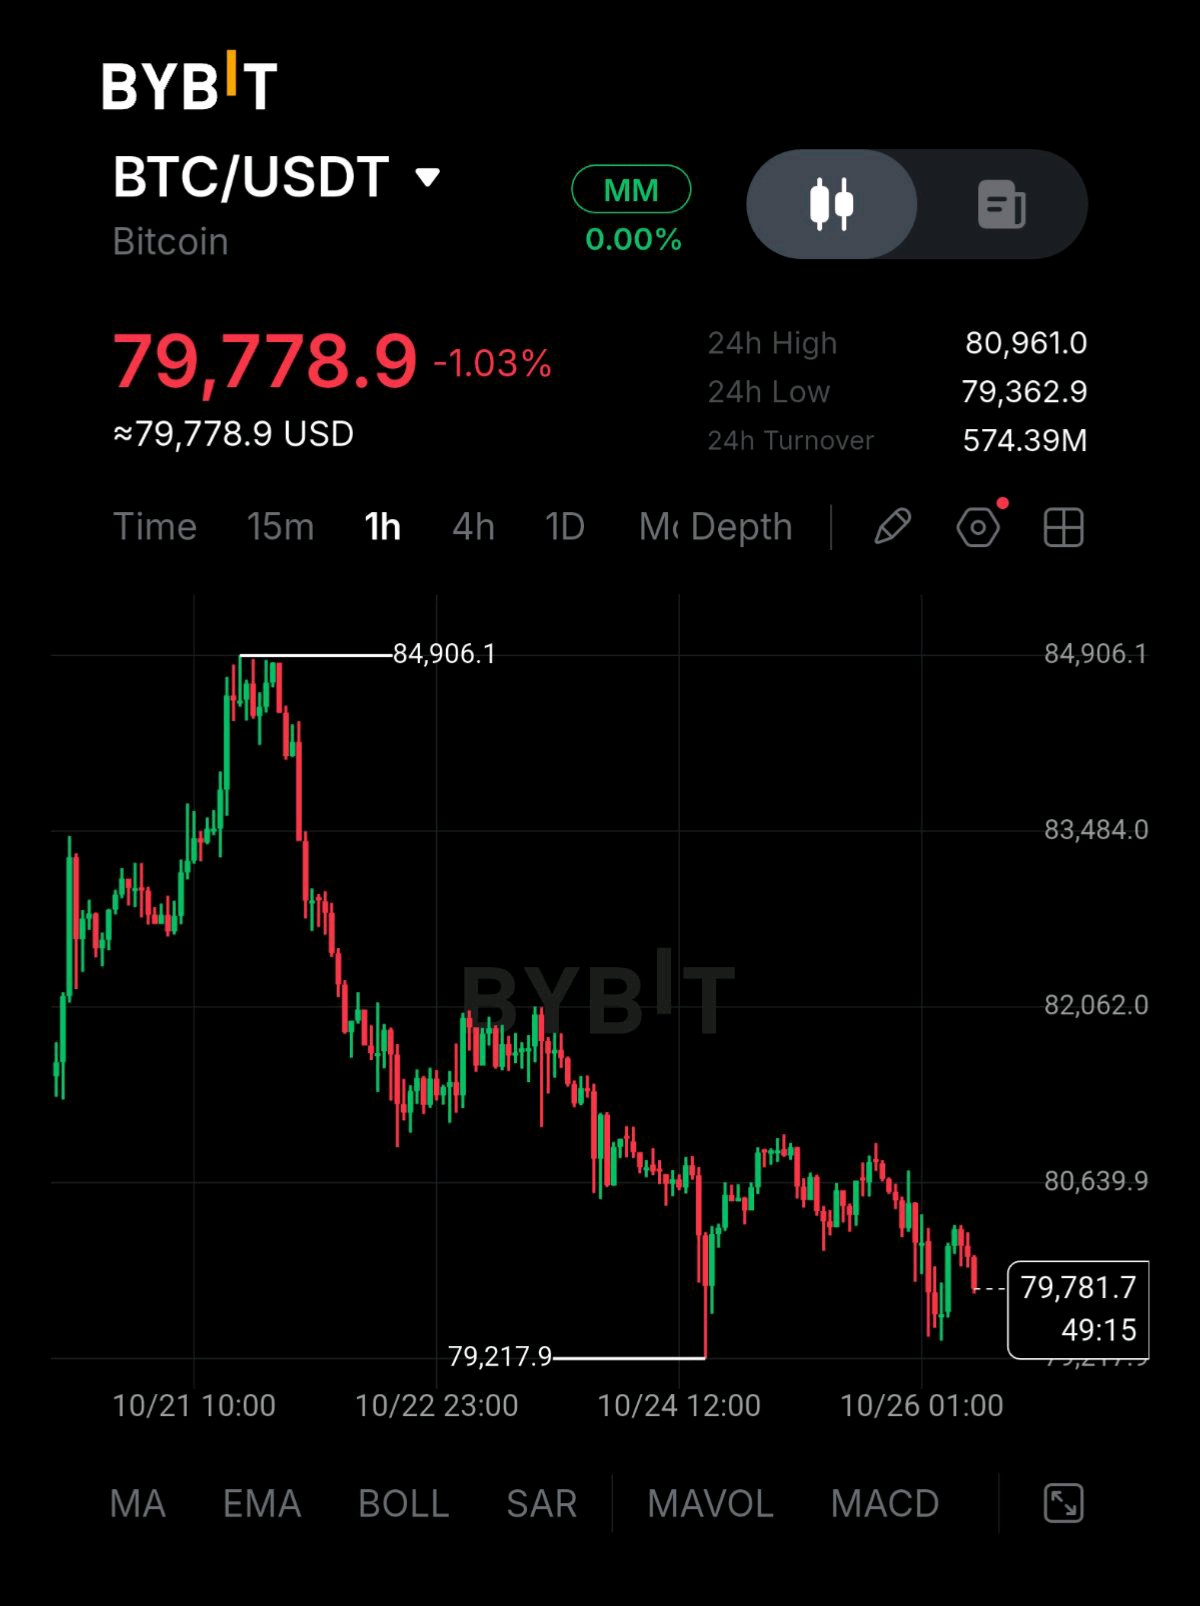
BTC is down 1.03% today at $79,778.9 trading right at the lower edge of a range that's dominated this chart for days. This is not an isolated red candle, it's the latest leg in a slide that's been building since the mid month highs near $85,000. The shape is a steady grind lower rather than a single sharp break. Price topped at $84,906.1 rolled over, and has spent since then making a series of lower highs on every bounce now pressing against the $79,217.9-79,362.9 zone that's acted as the floor through the last few days. That kind of persistent step-down pattern usually reflects sustained selling pressure rather than a one off shock and that fits the backdrop. Leveraged long liquidations have been adding fuel to the decline, a large spot ETF outflow in the prior week helped kick off the move toward $80K and the market is now largely in a holding pattern ahead of the Fed October 28 decision, which is keeping price pinned rather than trending cleanly in either direction. What's notable is where prediction markets are positioning. Traders on Kalshi have been assigning real odds to a test of $78,000 before month-end meaning the move toward today's low is not happening in a vacuum there's an actual target zone the market has already started pricing in below current levels. The level that matters is $79,217-79,362. That's the floor this range has held so far and it's also the last line before the $78,000 zone the market is already watching. Hold it and this remains a range waiting on the Fed rather than a confirmed breakdown. Lose it and $78,000 becomes the next real test. What I'm watching: whether $79,217 holds into the Fed decision or a break below it that puts the $78,000 zone squarely in play. $BTCUSDT $BTCUSDC #MyByXTake #ByXIMPACT

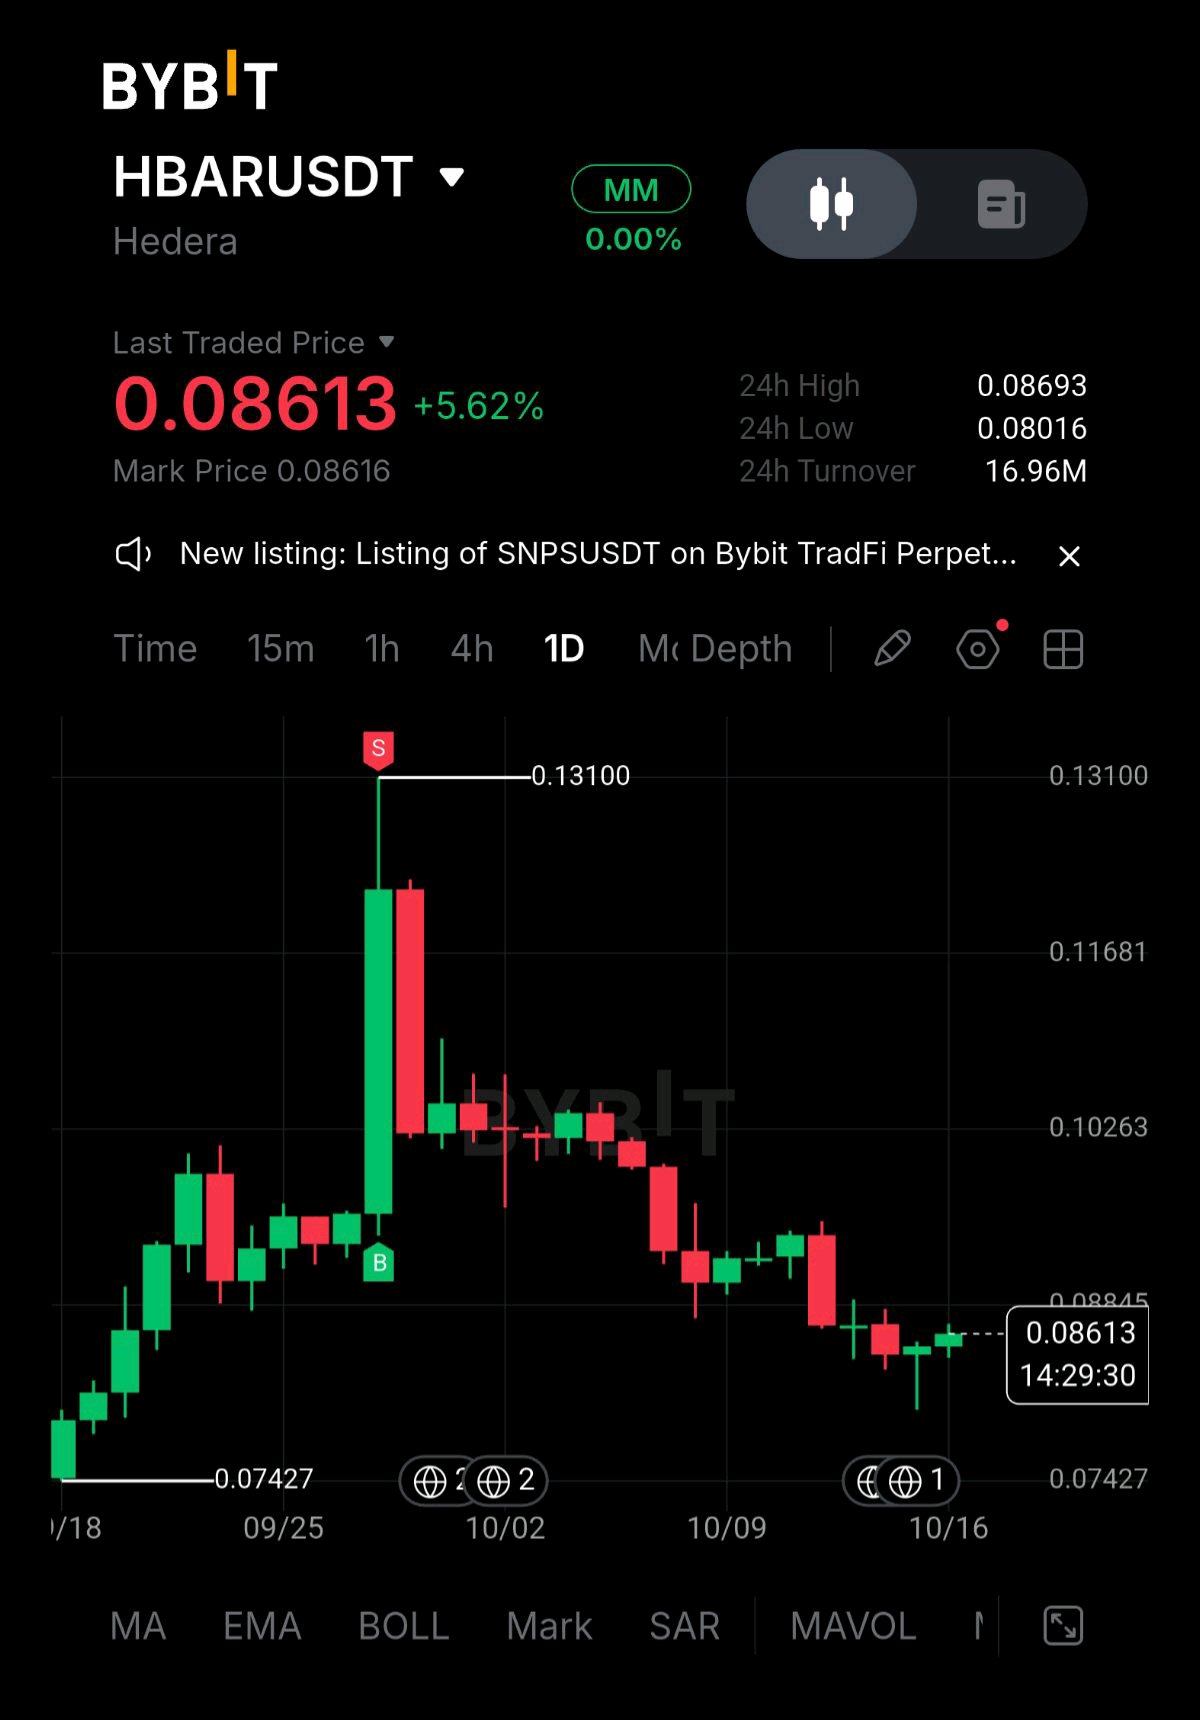
HBAR is up 5.62% today at $0.08613, and after weeks of straight-line decline, this is the first real bounce worth noting. The move puts a pause, even if a small one, on one of the longer slides this pair has had. Zoom out and the picture is stark. HBAR peaked near $0.131 in late September on an ETF listing catalyst then spent the following weeks giving almost all of it back, falling roughly 24% by early October and continuing lower from there, grinding down toward $0.08 by mid-month. That's a slow sustained bleed rather than a single crash the kind of decline that happens when early buyers from a catalyst spike keep exiting into every bounce. Worth noting too: this slide happened despite genuinely positive fundamental news along the way, including the October 8 launch of Agent Accounts, letting AI agents make controlled on-chain payments and Robinhood bringing tokenized stocks onto Hedera network just days ago. Good news falling price a split that often means the market is more focused on broader crypto sentiment than token-specific developments right now. Today bounce is happening right around the $0.08 zone that's acted as a structural floor the 200-day moving average and lower Bollinger Band converging there. A bounce off a well-defined technical confluence like that carries more weight than one that happens at an arbitrary level. The level that matters is $0.08845-0.09. That's been the first resistance on every bounce attempt through this decline. Clearing it with follow-through would be the first sign this slide is stabilizing rather than just pausing. Fail there again and the broader downtrend stays intact with $0.08 remaining the level to defend. What I'm watching: a break above $0.09 for a real stabilization signal or a fade back toward $0.08 that keeps the slide going $HBARUSDT $HBARUSDC #ByXIMPACT #TSLATookOffLiterally #TSLAtooktothemoon #BybitStocks #FOMCMinutes:Hawkish

Who’s in Singapore 🇸🇬 for Token2049? Let’s connect 🤝
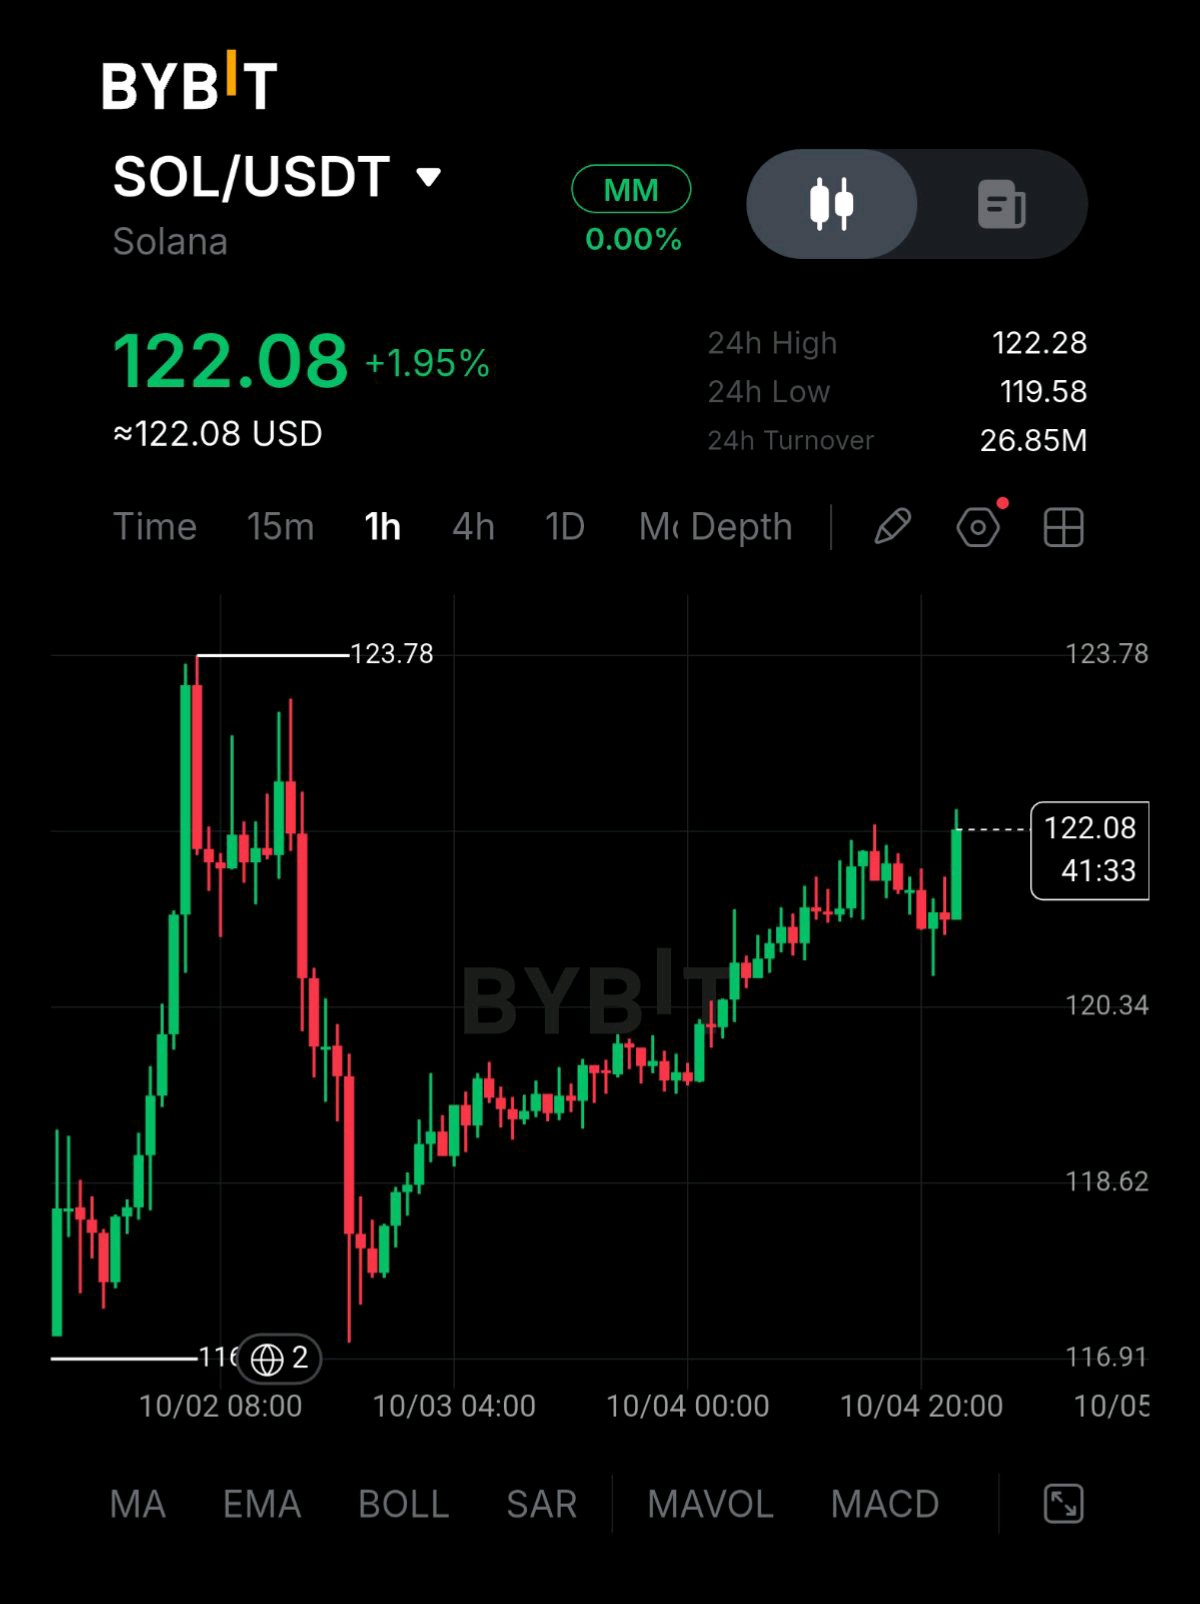
SOL is up 1.95% today at $122.08 and the shape of this chart matches the moment it's happening in. This week marked the first U.S. spot Solana ETFs going live on Nasdaq and the NYSE the same ETF wave that drove the spike in HBAR and SOL chart shows the same initial excitement followed by a cooldown. The spike to $123.78 came fast, straight out of consolidation then rolled over just as quickly dropping sharply to a low near $116-117 in a matter of hours. That kind of spike-and-fade right around a major listing event usually means the initial pop was priced-in excitement meeting profit-taking not a rejection of the underlying news. What's happened since is the more interesting part. Rather than breaking down further SOL found a floor and has spent the better part of a day grinding steadily back up a clean staircase of higher lows through $118 $119, and now pushing back toward $122. That grinding recovery, built in small steps rather than one sharp bounce often reflects real buying returning gradually which fits a backdrop where Solana ETF have reportedly been pulling in consistent inflows since launch rather than a single speculative pop. Turnover at 26.85M is solid for the day showing this recovery has real participation behind it. The level that matters is $122.28-123.78 the zone where the initial spike failed. Clearing it with follow-through would suggest the ETF launch narrative still has room to run once the initial volatility settles. Fail there again and this likely stays range bound between the recent high and the $118-120 support zone that's held through the recovery. What I'm watching: a break above $123.78 to reclaim the spike high or a pullback that tests whether $119-120 holds as the new floor $SOLUSDT $SOLUSDC #ByXIMPACT #ISMManufacturingPMI #USNonfarmPayrolls #MetaMaskSecurityIncidentTriggersValidatorExits #BybitAIBestReplies

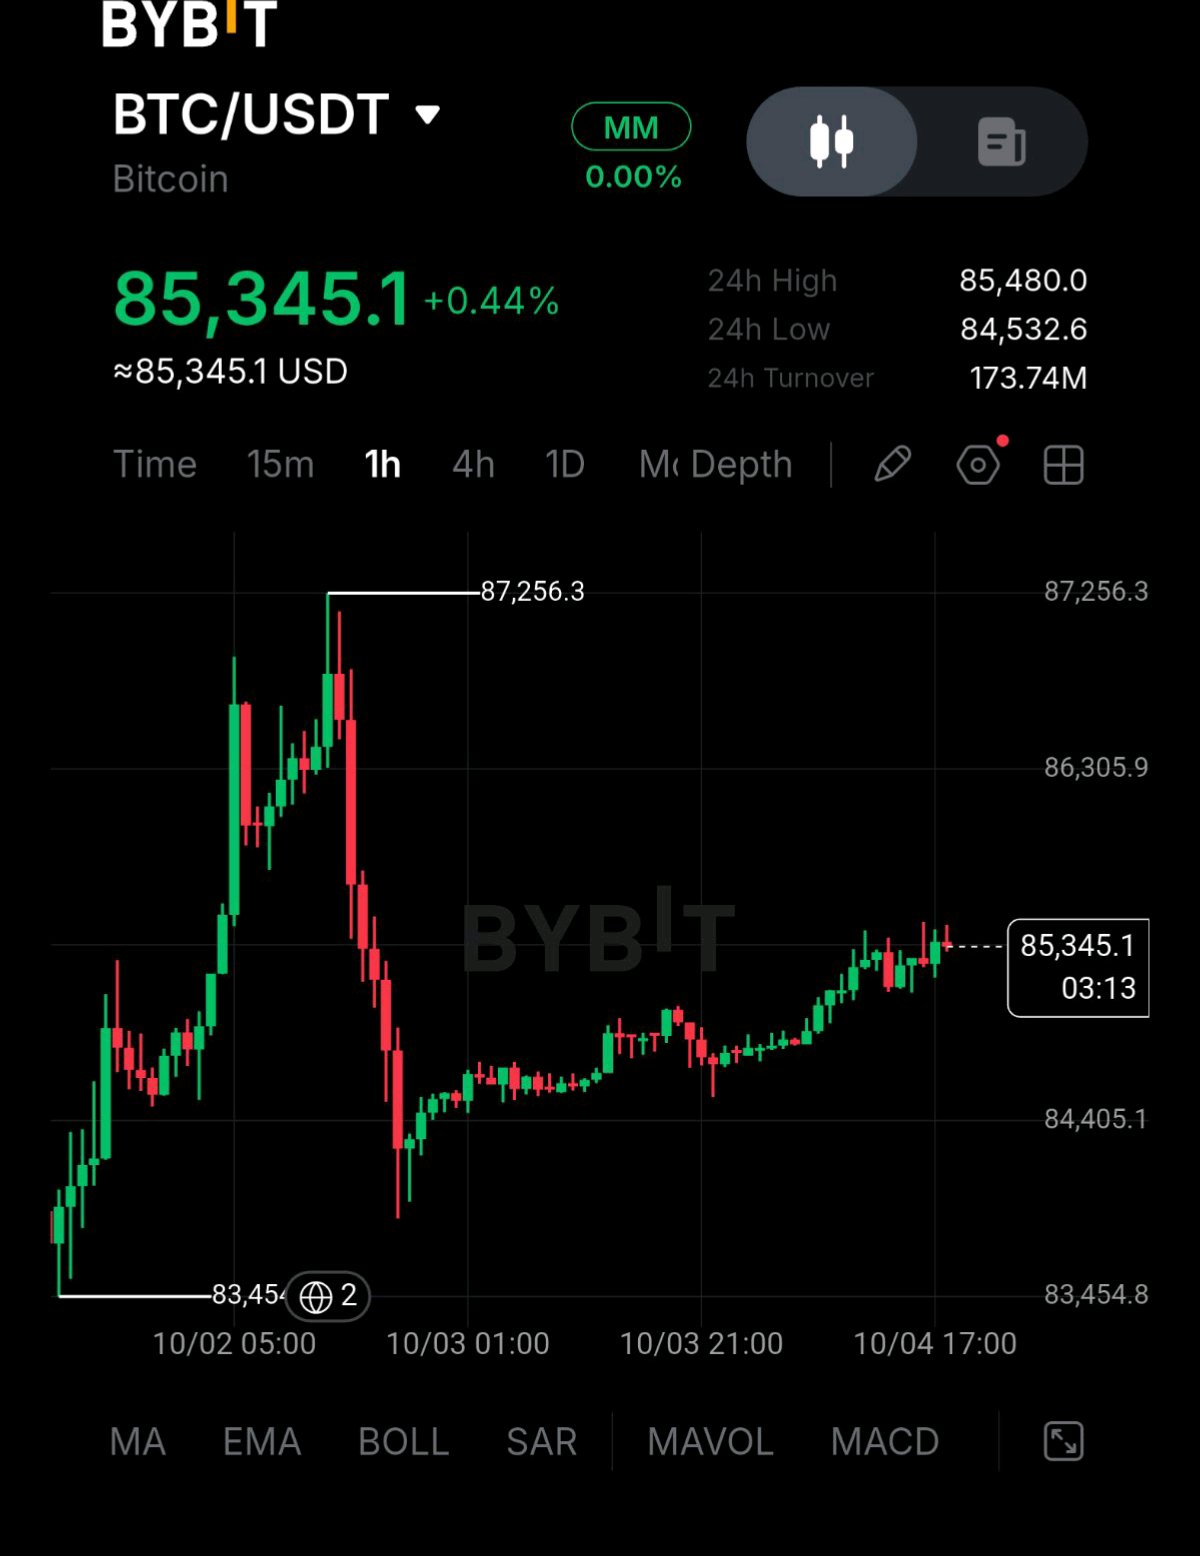
BTC is up a modest 0.44% today at $85,345 but that number badly undersells the shape of the last 72 hours. This chart is a near round trip: a sharp spike to $87,256 a hard reversal back toward $84,000 and now a steady grind back up to retest the highs. The spike happened fast. BTC climbed from a base near $83,454 straight up to $87,256 in a matter of hours then immediately gave most of it back dropping in a sharp single leg down to around $84,000 before stabilizing. That kind of quick spike-and-fade is the signature of a fast catalyst-driven move that ran ahead of itself not a steady accumulation. With Bitcoin entering this stretch trading around $83,000 and the market's attention largely fixed on the Fed late-October meeting as the next real catalyst, a sharp pre-positioning spike like this one looks more like speculative front running than a confirmed trend change. What's happened since the drop is the more constructive part. Rather than continuing to break down price found a floor in the $84,400-84,700 zone and has spent the better part of a day grinding steadily higher retracing the drop in small controlled steps rather than another sharp spike. That grinding character a slow climb instead of a vertical one usually reflects more durable buying than the initial spike did. Turnover at 173.74M is solid, consistent with real participation in both the spike and the recovery. The level that matters now is $86,305-87,256. That's the zone where the original spike failed, and reclaiming it with real follow through would be the first sign this wasn't just a fakeout. Losing the $84,400 floor instead would put the recovery in question and reopen the $83,454 base. What I'm watching: a break above $86,305 that opens a real retest of $87,256, or a slip back below $84,400 that would call this recovery into question. $BTCUSDT $BTCUSDC #ByXIMPACT #ISMManufacturingPMI #USNonfarmPayrolls #MetaMaskSecurityIncidentTriggersValidatorExits #BybitAIBestReplies

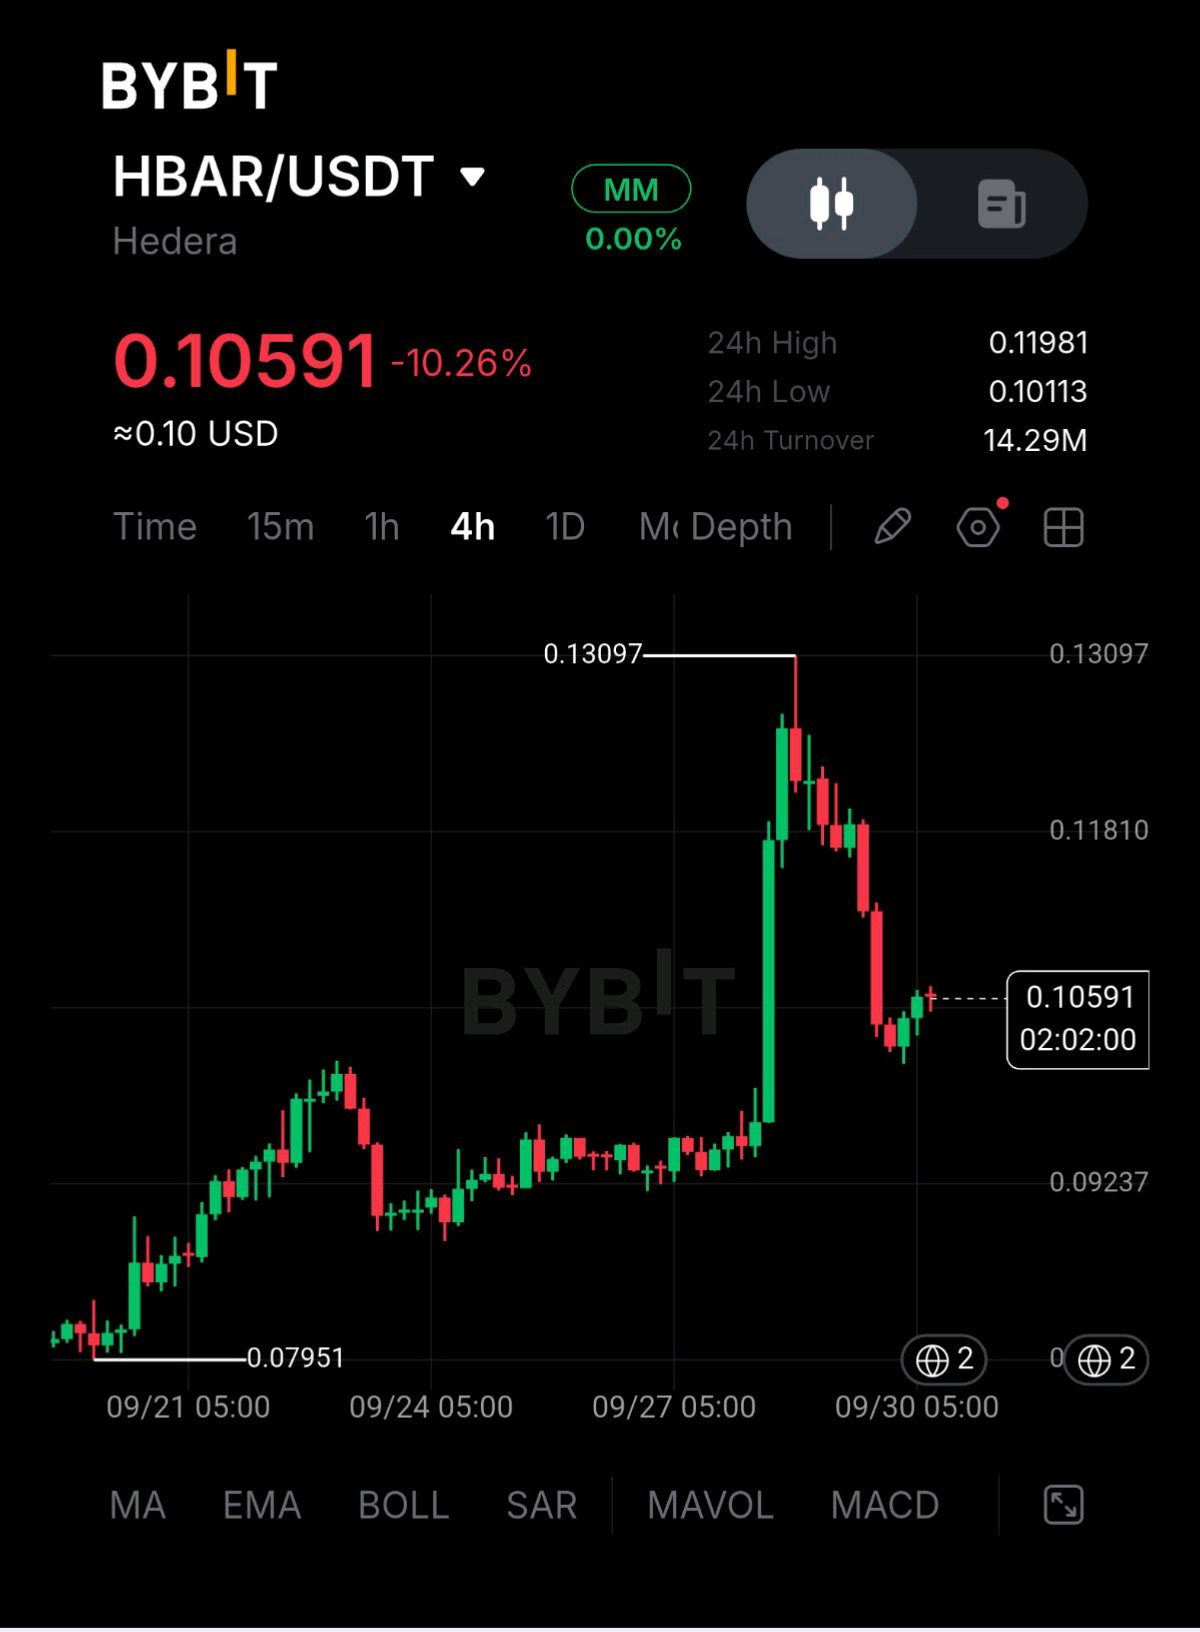
HBAR is down sharply today, off 10.26% at $0.10591, but the real story is the round trip that happened just before this drop. This chart shows a textbook spike-and-fade: a sudden vertical move on a catalyst, followed by the market giving most of it back. The setup makes sense of the shape. HBAR had been grinding quietly for days in a tight $0.09-0.10 range when spot HBAR ETF began listing on NYSE and Nasdaq this week, alongside similar listings for Solana and Litecoin. That kind of headline is exactly the sort of catalyst that produces a chart like this one: price rocketed from around $0.096 straight up to $0.13097 in a matter of hours, a better than 35% move, then reversed just as fast. Since that spike, the decline has been steady rather than chaotic a clean stair-step down through $0.1181, then $0.1113, now to today's low of $0.10113. That's the market repricing the initial excitement rather than panicking, but it's still erased most of the gain from the listing news. Turnover at 14.29M is heavy relative to the calmer days before the spike, confirming this whole move, up and down, has real volume behind it rather than thin, easily-reversed trading. The level that matters is $0.11810, the base the spike launched from before the drop through it. Reclaiming that zone would suggest the ETF listing news still has legs once the initial spike gets fully digested. Staying below it, and the more likely outcome is a slide back toward the pre catalyst range near $0.092-0.096. What I'm watching: a reclaim of $0.1181 to keep the listing catalyst alive, or a slide back toward the pre spike range near $0.092-0.096. $HBARUSDT $HBARUSDC #ByXIMPACT

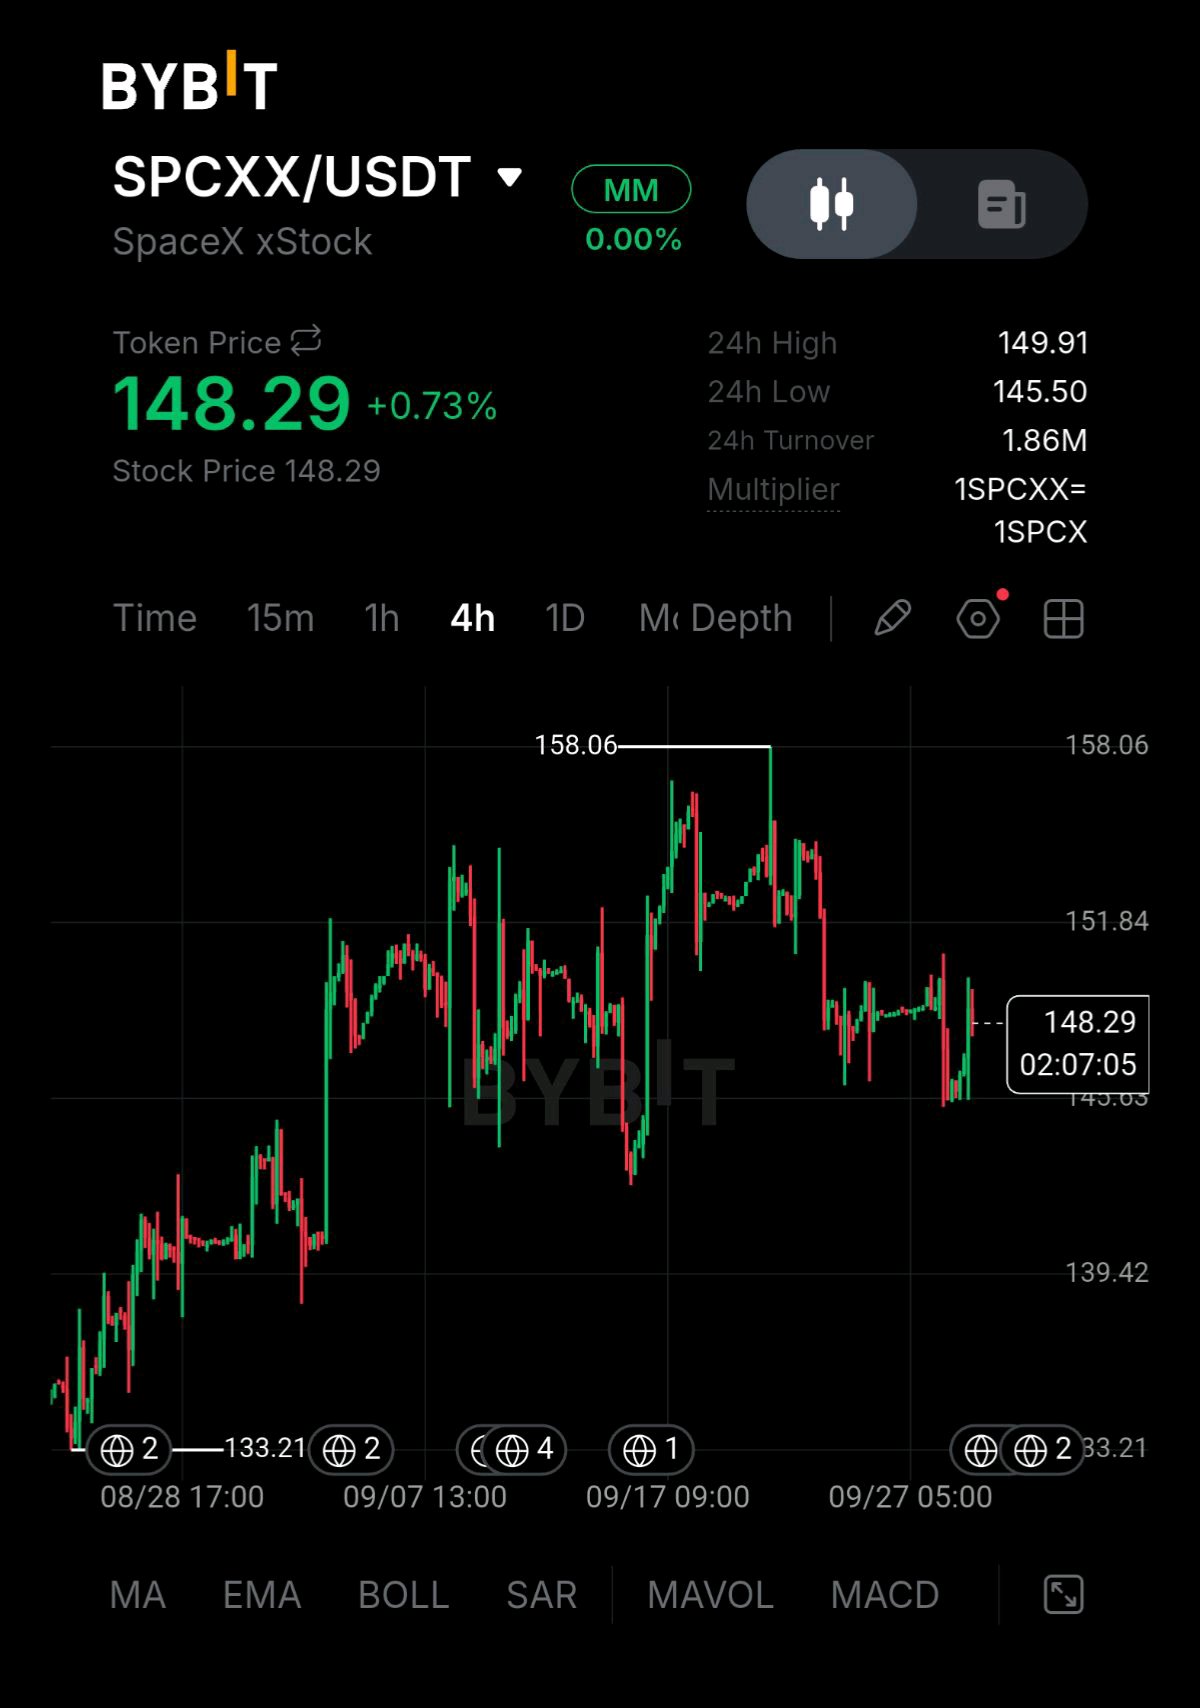
SPCXX is up a modest 0.73% today at $148.29, and this is the first green candle since the breakdown flagged in the last update. Price bottomed near $145.50, just above the prior $145.33 low, and has spent the day building a small recovery rather than making a fresh low. That's a meaningful distinction from the pattern that's dominated this chart for over a week a steady sequence of lower highs after the $158.06 spike failed. Holding above the prior low instead of breaking it is the first sign of a possible floor, even if it's early. The level that decides whether this becomes real is the same one from before: $149.26-151.84. That zone has capped every bounce attempt since the spike failed, and it's exactly where price is now knocking. Reclaim it with follow-through, and this stops looking like a downtrend and starts looking like a base. Fail there again, and it's just another lower high in the same tired sequence. What I'm watching: a break above $151.84 that would be the first real change in character, or another rejection there that keeps the lower high pattern going. $SPCXXUSDT #ByXIMPACT

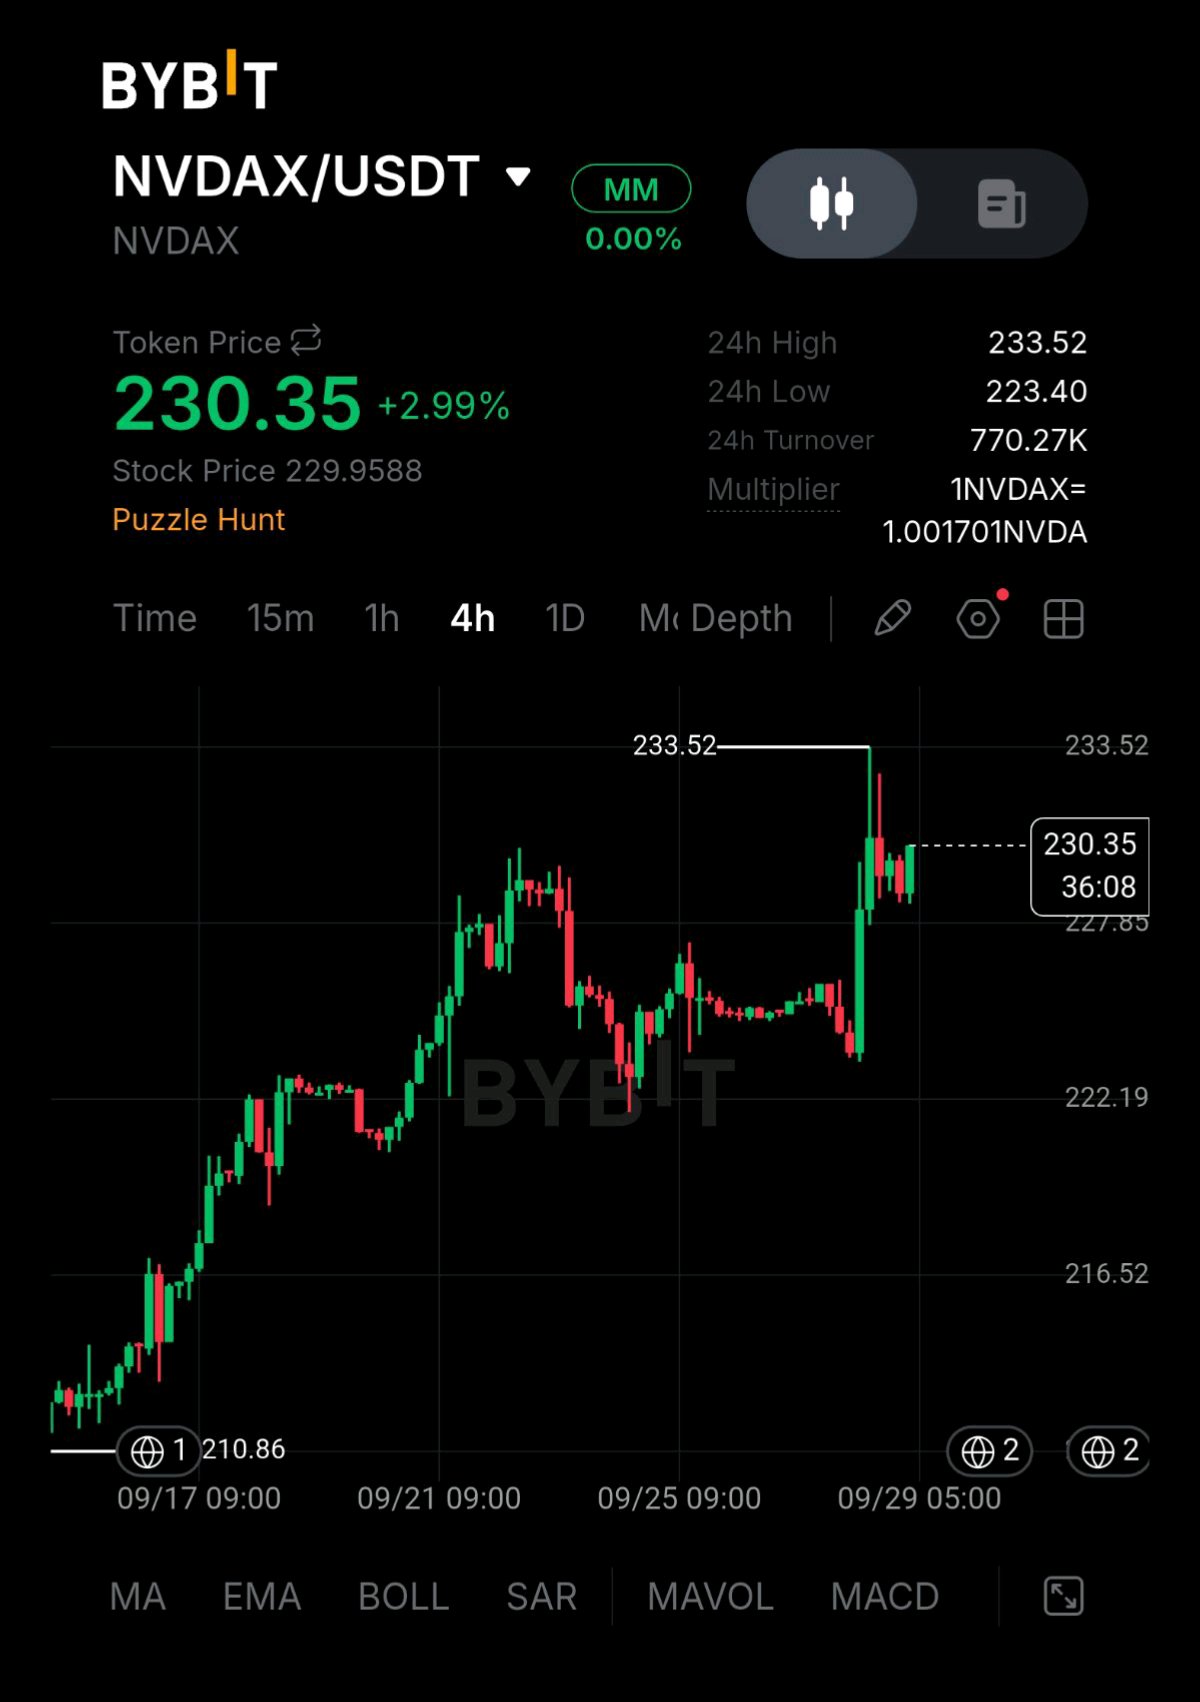
NVDAX is up 2.99% today at $230.35, holding the same ground flagged in the last update. The breakout above $230.28 to a fresh high of $233.52 hasn't given way price pulled back to test the old ceiling, found buyers there, and is holding right at it rather than slipping beneath it. That's the constructive detail here. A breakout that gets retested and defended within a day or two, rather than immediately failing back into the old range, is generally the stronger version of a breakout. Turnover at 770.27K remains heavy, consistent with real participation rather than a fading move. The levels are unchanged from before: $230.28 as the line that needs to hold, $233.52 as the level to reclaim for continuation. Nothing here has shifted the picture, it's simply confirming it. What I'm watching: continued holds above $230.28 to keep the breakout intact, or a slip back under it that would reopen the old range. $NVDAXUSDT #ByXIMPACT

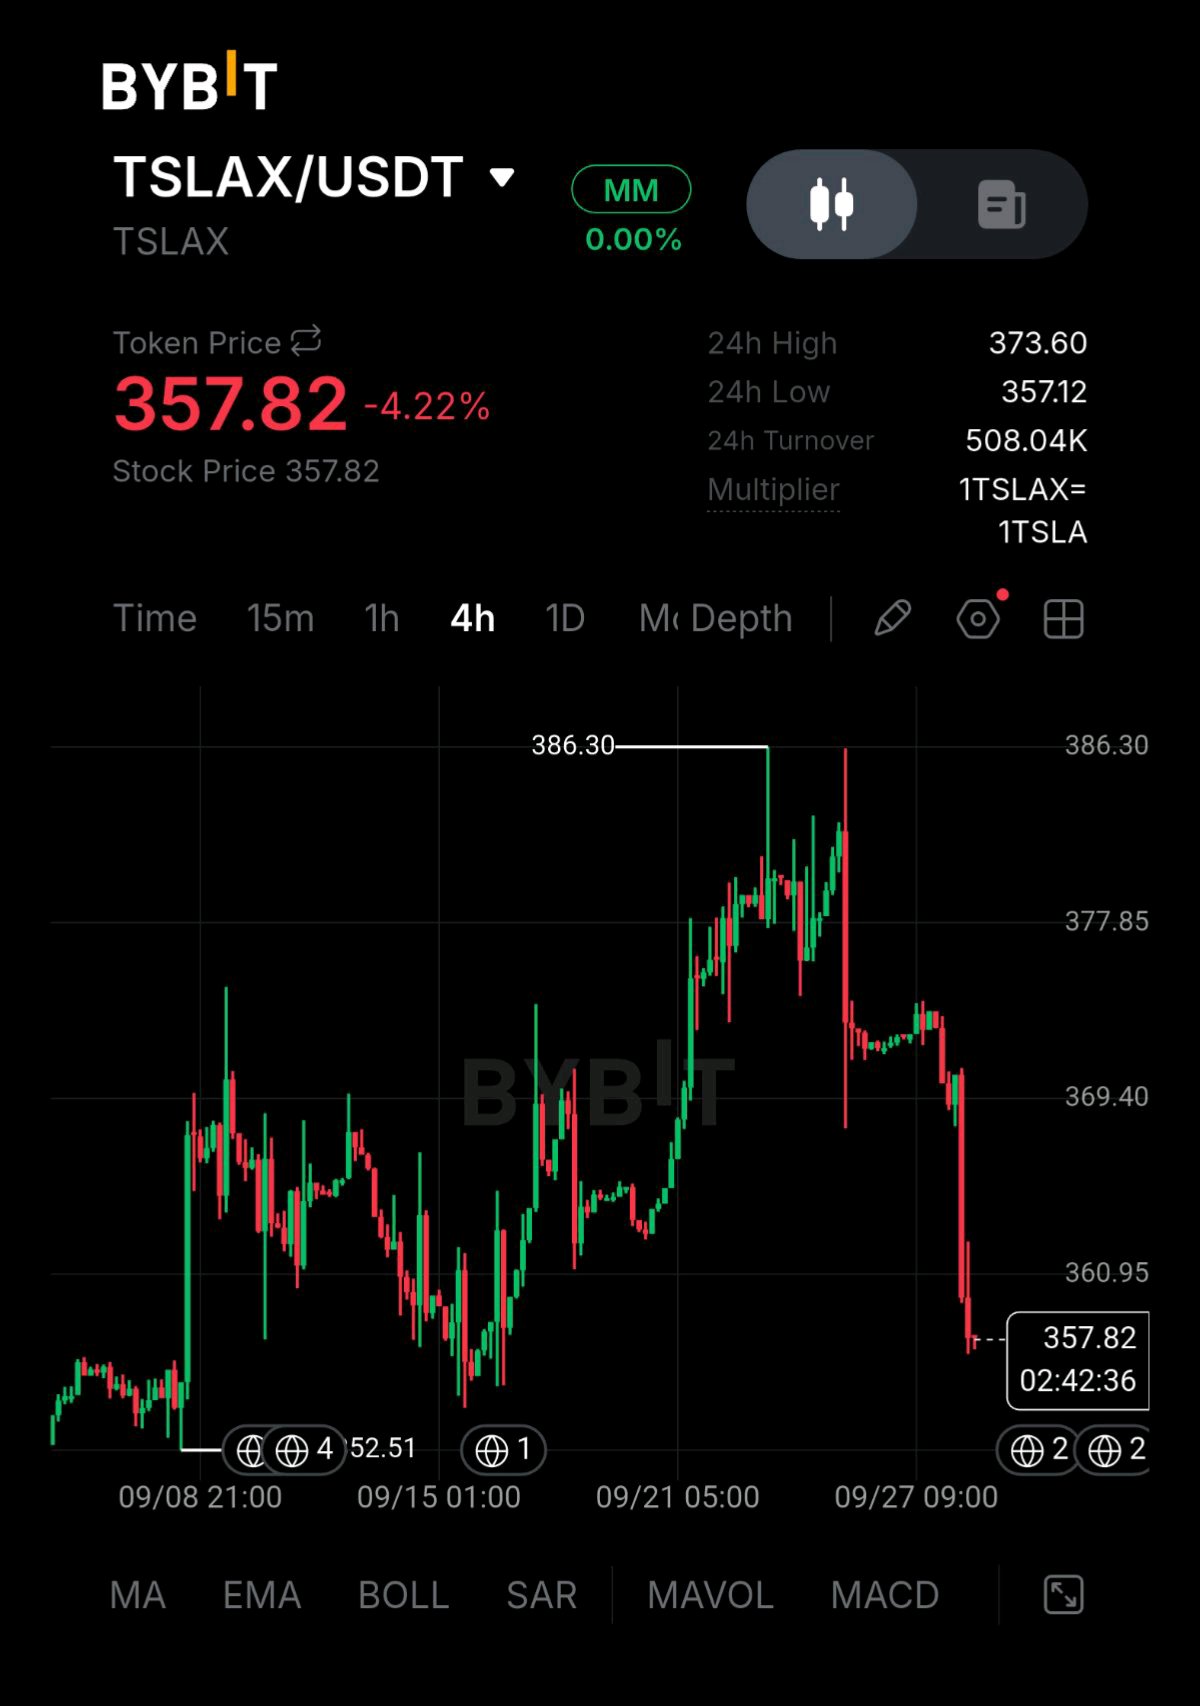
TSLAX is down 4.22% today at $357.82, and this is the follow-through on the crash candle from the last post. Back then, price had stabilized in the $370-374 range after a sharp drop from $386.30, and the read was that this zone would decide whether the damage was repaired or not. It wasn't. The floor gave way. Trace the sequence. Price consolidated calmly in that $369-374 band for about a day, then broke down hard, first slicing through $369 to $360, then continuing lower to today's $357.12 low. Two decisive red legs not one panic candle, which is a different signature than the initial crash. That one looked like a shock. This one looks like a trend confirming itself. Zoom out and the bigger structure is a full round trip. TSLAX ran from a base near $352 all the way to $386.30, and it has now given back almost the entire move, sitting barely above where this run started. Turnover at 508.04K is elevated, in line with the size of the decline, so this drop has real participation behind it rather than drifting on thin liquidity. The level that matters is $360.95, the shelf this decline just broke through. Reclaiming it would be the first sign of stabilization. Below current price, there is not much of a clean floor until the $352.51 area where this whole rally began, which makes that zone the next real level if the selling continues. What I'm watching: a reclaim of $360.95 for any sign of stabilization or a break toward $352.51 that would erase the entire run. $TSLAXUSDT #ByXIMPACT

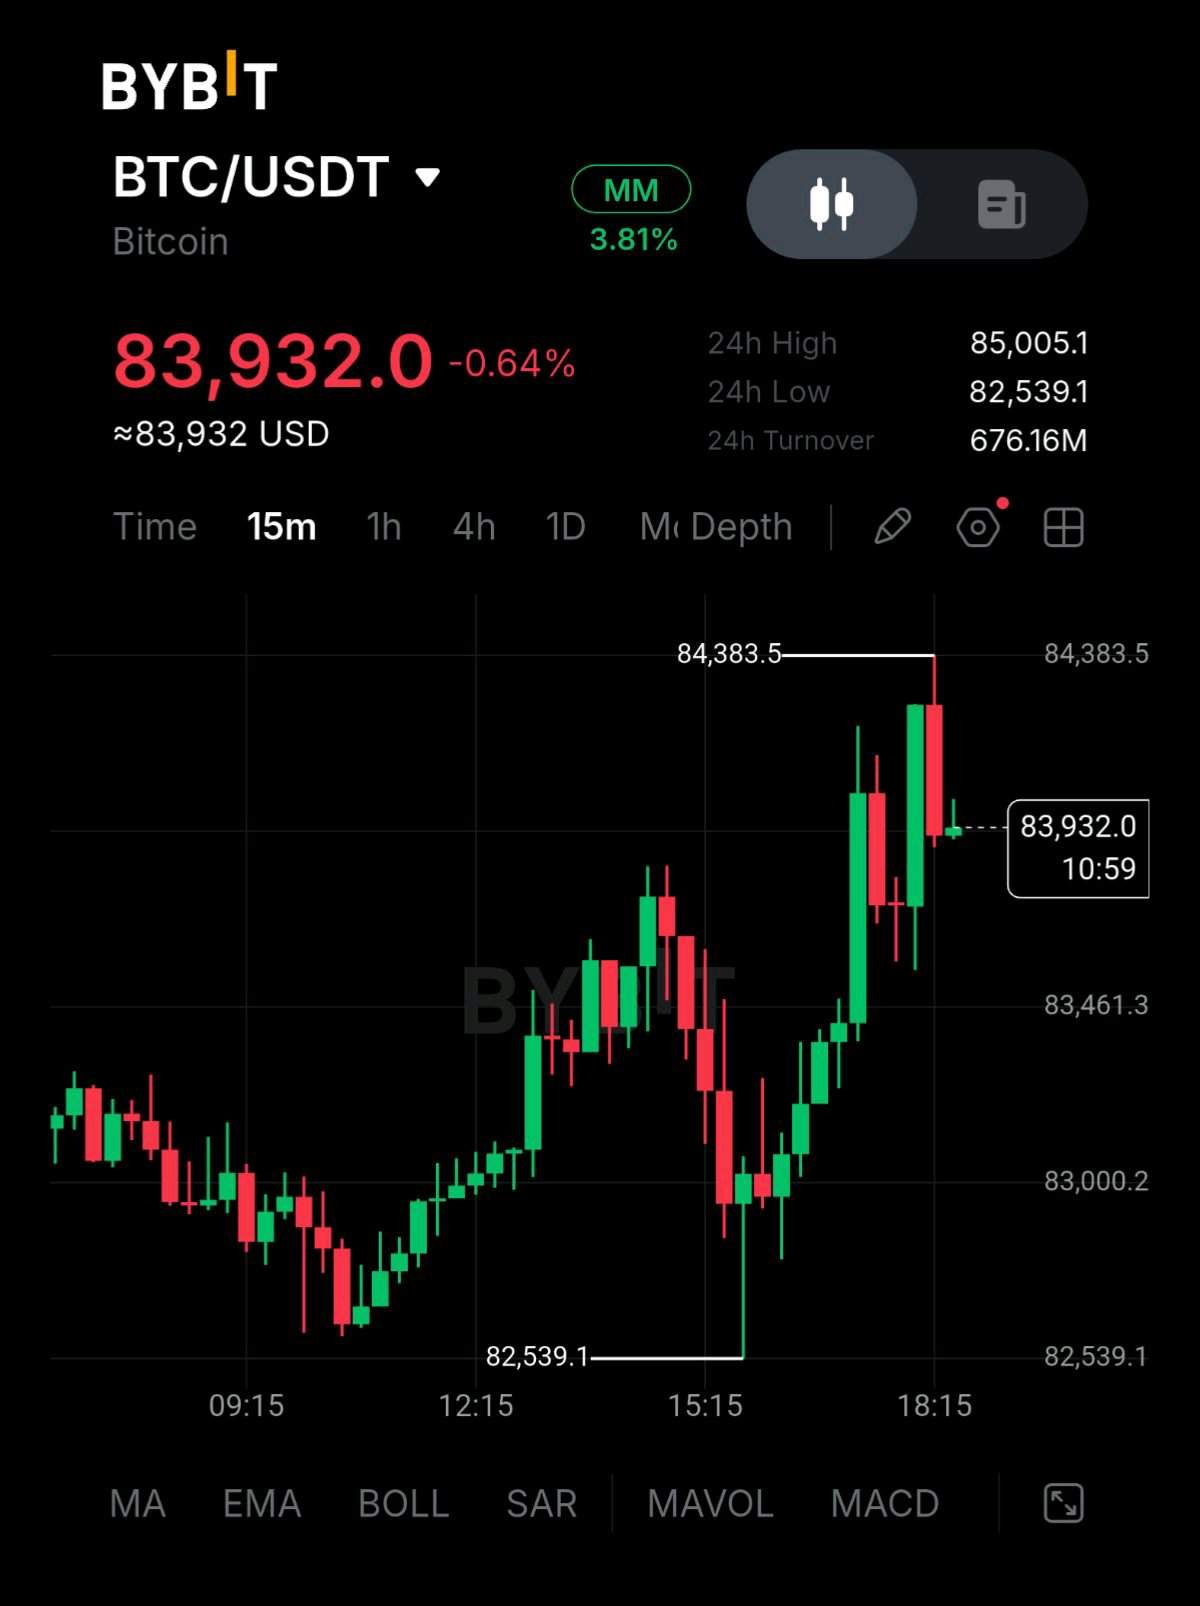
BTC is down 0.64% on the day at $83,932, but on this 15-minute view the day looks anything but red. It's a sharp intraday recovery, and the story is in how it unfolded. The morning was a slow bleed. Price drifted from the low $83,000s down toward $82,539.1, the day's low, in a run of small red candles, and each bounce was weaker than the last. Then it turned. A long wick down to the low was bought immediately, and from there the chart shows a clean staircase of higher lows: a push to $83,461, a shallow dip, then a strong burst that carried price up to $84,383.5. That's a $1,800 move from the low in a few hours. The last few candles are the part to read carefully. After tagging $84,383.5, price gave back roughly $450 in a single red candle and is now sitting near $83,932. That doesn't undo the recovery. It looks like profit taking on a fast move, and the previous dips in this sequence found buyers quickly. Turnover at 676.16M is heavy for the day, which tells you this move has real participation behind it and isn't just thin-liquidity noise. The level that matters is $84,383.5, the intraday high. A clean push through it points toward the 24h high of $85,005.1. On the downside, the $83,461 area is the key floor, since it marks the base of the last burst. Losing it would put the whole recovery in question and reopen the low near $82,539. What I'm watching: a break above $84,383.5 targeting $85,005, or a slip below $83,461 that would call the intraday recovery into question $BTCUSDT $BTCUSDC #ByXIMPACT

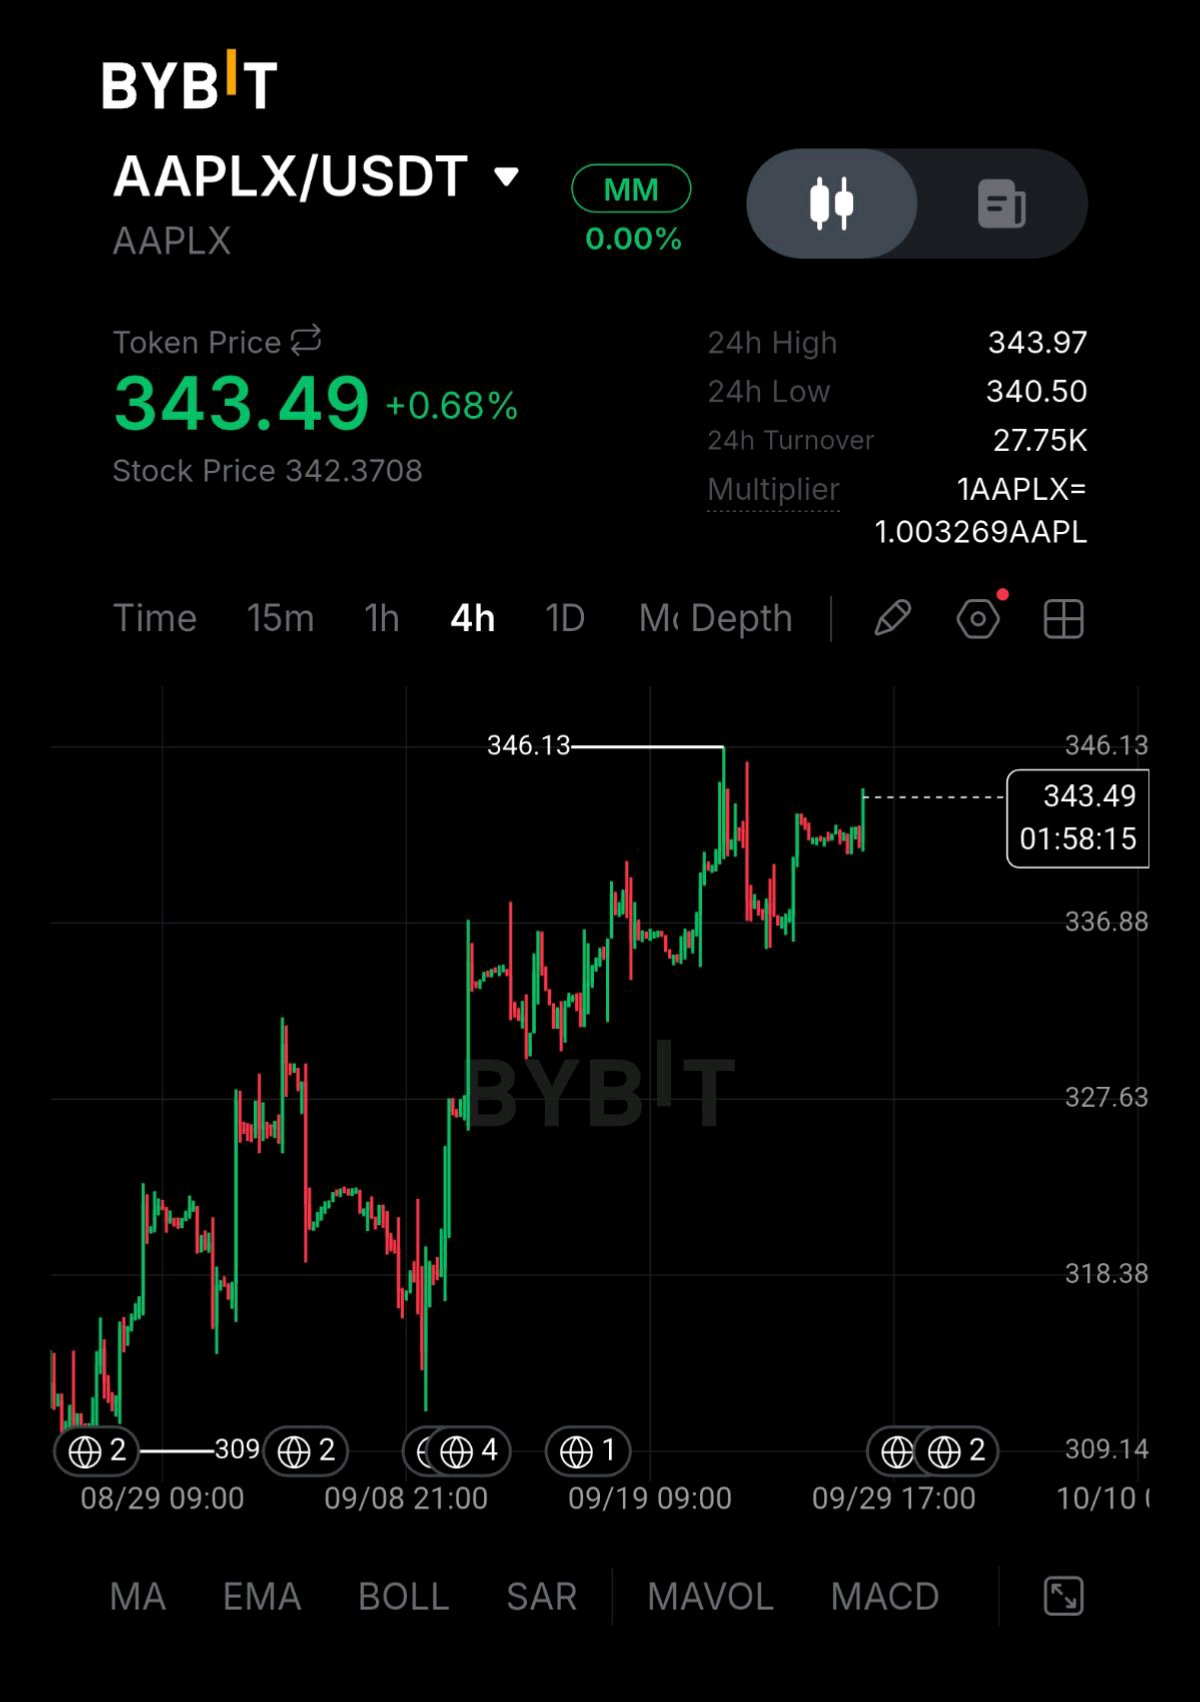
AAPLX is up 0.68% today at $343.49, and the thing worth noticing is where it's happening. After the sharp pullback from $346.13, this chart has quietly rebuilt most of the damage, and price is now pressing right back up against the top of its range. The larger picture hasn't changed. From $309 in late August this pair has climbed in a steady staircase: push up, pull back, push again, with each dip finding buyers at a higher level than the last. The fundamental story behind it is real too. Apple fiscal Q3 revenue grew double digits the CEO handover to John Ternus came right alongside the September iPhone event and the market has had plenty of narrative to work with. What's new is the recovery. The drop from $346.13 down toward $336 looked like the first real crack in the pattern, but it didn't extend. Price stabilized, built a tight base in the $340-341 area and has now stepped back up to $343.49. A pullback that gets fully absorbed in a few sessions is exactly what an intact uptrend looks like. Turnover at 27.75K is light, though, so the recovery is happening without much conviction behind it yet. The level that matters is $346.13. Price has already been rejected there once and this second approach is the real test. A clean close above it on better participation would put the uptrend back in price discovery. Another rejection would make it a double top and that would put the $336.88 zone where the last pullback found its floor, back in play. What I'm watching: a break above $346.13 to confirm the trend, or a second rejection there that turns it into resistance. $AAPLXUSDT #ByXIMPACT

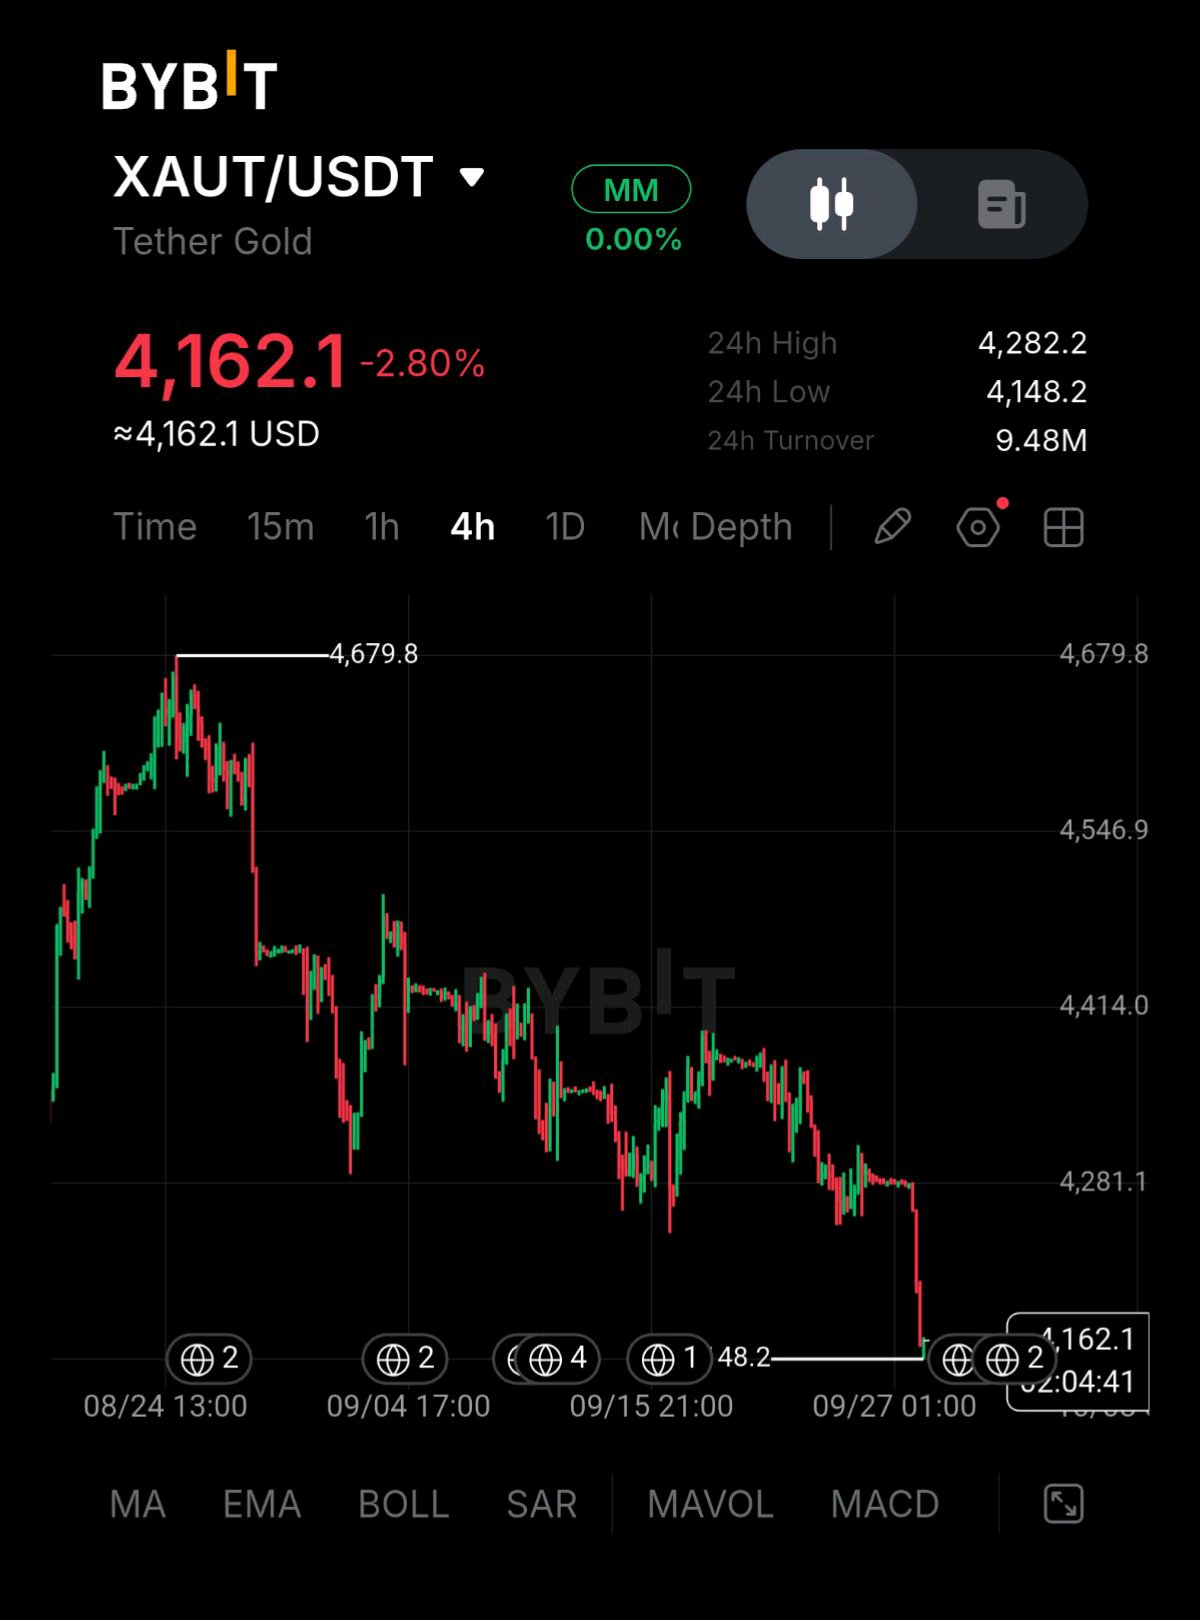
Gold is down 2.80% today at $4,162.1, and this is the move the last few charts were leaning toward. The tight range between $4,249 and $4,286 that held for days has now broken, and it went in one clean drop. Look at how it happened. Price spent the last stretch drifting sideways just under $4,281, going nowhere on light volume. Then a single steep candle carried it straight through the base of that range down to a 24h low of $4,148.2, roughly $130 in one push. After weeks of grinding lower in small steps, this was the first real acceleration since the drop from $4,679.8 back in late August. That matters because a break like this settles the question of the last two posts: the flattening was pause, not base. Range compression usually resolves with force, and this one resolved to the downside. Turnover at 9.48M is in line with recent days, which suggests a sharp air-pocket move through thin support rather than a wave of panic selling. The level that matters now is $4,249, the old floor, which should act as resistance if price retests it from below. Reclaiming it would show the breakdown was a flush that got bought back. Staying below it keeps this a confirmed downtrend, with $4,148.2 the low to defend and no obvious support underneath until that level is tested again. What I'm watching: a bounce that stalls under $4,249, which would confirm it as new resistance, or a reclaim of that level that would call the breakdown a false move. $XAUTUSDT #ByXIMPACT

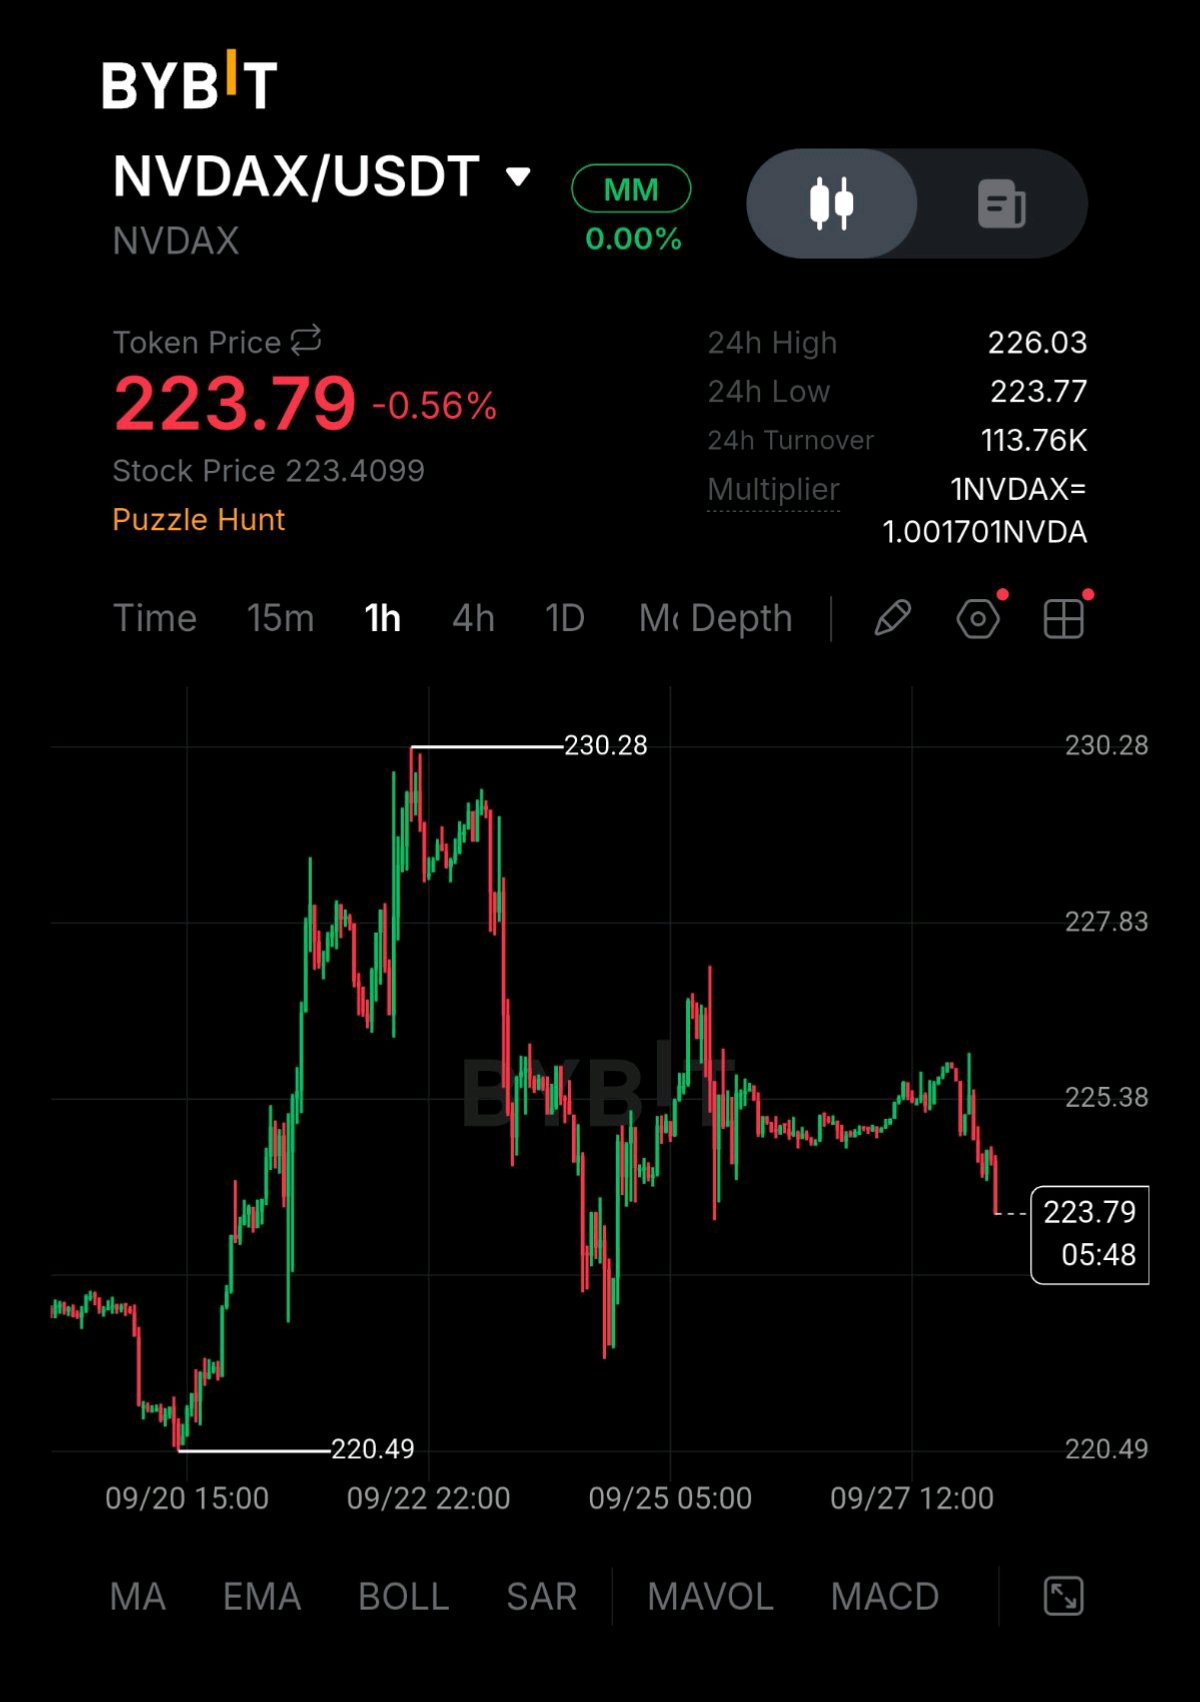
NVDAX is down 0.56% today at $223.79, and it's the quiet kind of red that matters more than it looks. After nearly a week of coiling in a tight range, this is the first candle that starts leaning on the floor of it. Look at how the last few days have played out. After the run from $220.49 up to $230.28, price rolled over, dropped hard to around $221, bounced back to $227, and has spent since then grinding sideways in a narrowing band. A rally into the $226-227 area on the 27th failed to break through, and the last few candles have rolled off it. Each attempt to push higher has topped out a little lower than the one before, a small but real sign that buyers are getting less aggressive. Turnover at 113.76K is the lightest we've seen on this pair in this stretch, which cuts both ways. Light volume during a drift lower means nobody is panic-selling, but it also means nobody is stepping in with conviction to defend the range. The level that matters is $223.77, today's 24h low, sitting right at the current price. A clean break under it puts $220.49 back in play, the base of the entire move, and losing that would erase the whole leg up. To flip the read, price needs to reclaim $225.38 and hold it; until then, the drift favors the downside. What I'm watching: a break below $223.77 opening a retest of $220.49, or a reclaim of $225.38 that puts the range back in buyers' hands $NVDAXUSDT #ByXIMPACT