SABISA
QNT/USDT: Technical Analysis
$QNTUSDT breaks out of a tight range on the 1-hour chart and takes back the moving-average cluster 📈 Direction: LONG 💰 Entry Point (Market): 209.50-211.00 ➕ DCA: 204.00 🎯 Take-profit targets: 215.94 / 224.01 / 230.00 🛑 Stop-loss: 199.50 📊 Deep market analysis and rationale * Price dynamics and trend structure: On the 1-hour timeframe, QNT spiked to the 24h high of 224.01, then faded into a choppy range with a low of 196.75. A single large green candle has now broken out of that range. Price is at 210.82 (+8.22% on the day), roughly 6% above the range lows and about 13 points below the 24h high. The candle left a small upper wick near 212 to 213, a sign that some sellers are still active at that level. * Moving averages and volume: MA7 (202.73), MA14 (203.00) and MA28 (204.08) are bunched within about 1.4 points of each other, and price has jumped well above all three. MA7 is turning up from below. The cluster near 203 to 204 is the first support on a pullback and the basis for the DCA level. Volume on the breakout bar is 1.71K, about 2.5 times its MA5 (693) and well above its MA10 (471). * Risk: The averages are still stacked MA7 below MA14 below MA28, so the larger trend has not turned yet. One candle does not make a trend, and a retest of the 204 area would be a normal pullback. A 1h close below 199.50 would put price back inside the old range and invalidate the setup. The 196.75 low is the deeper support behind it. ⚖️ Risk/Reward (entry midpoint 210.25, stop 199.50, risk about 5.1%) TP1 215.94: +2.7% (0.5 : 1) TP2 224.01: +6.5% (1.3 : 1) TP3 230.00: +9.4% (1.8 : 1) This is market analysis, not financial advice. Only risk what you can afford to lose. #WSOT2026 #IMPACTbyTrade #ByXIMPACT

TREE/USDT: Technical Analysis
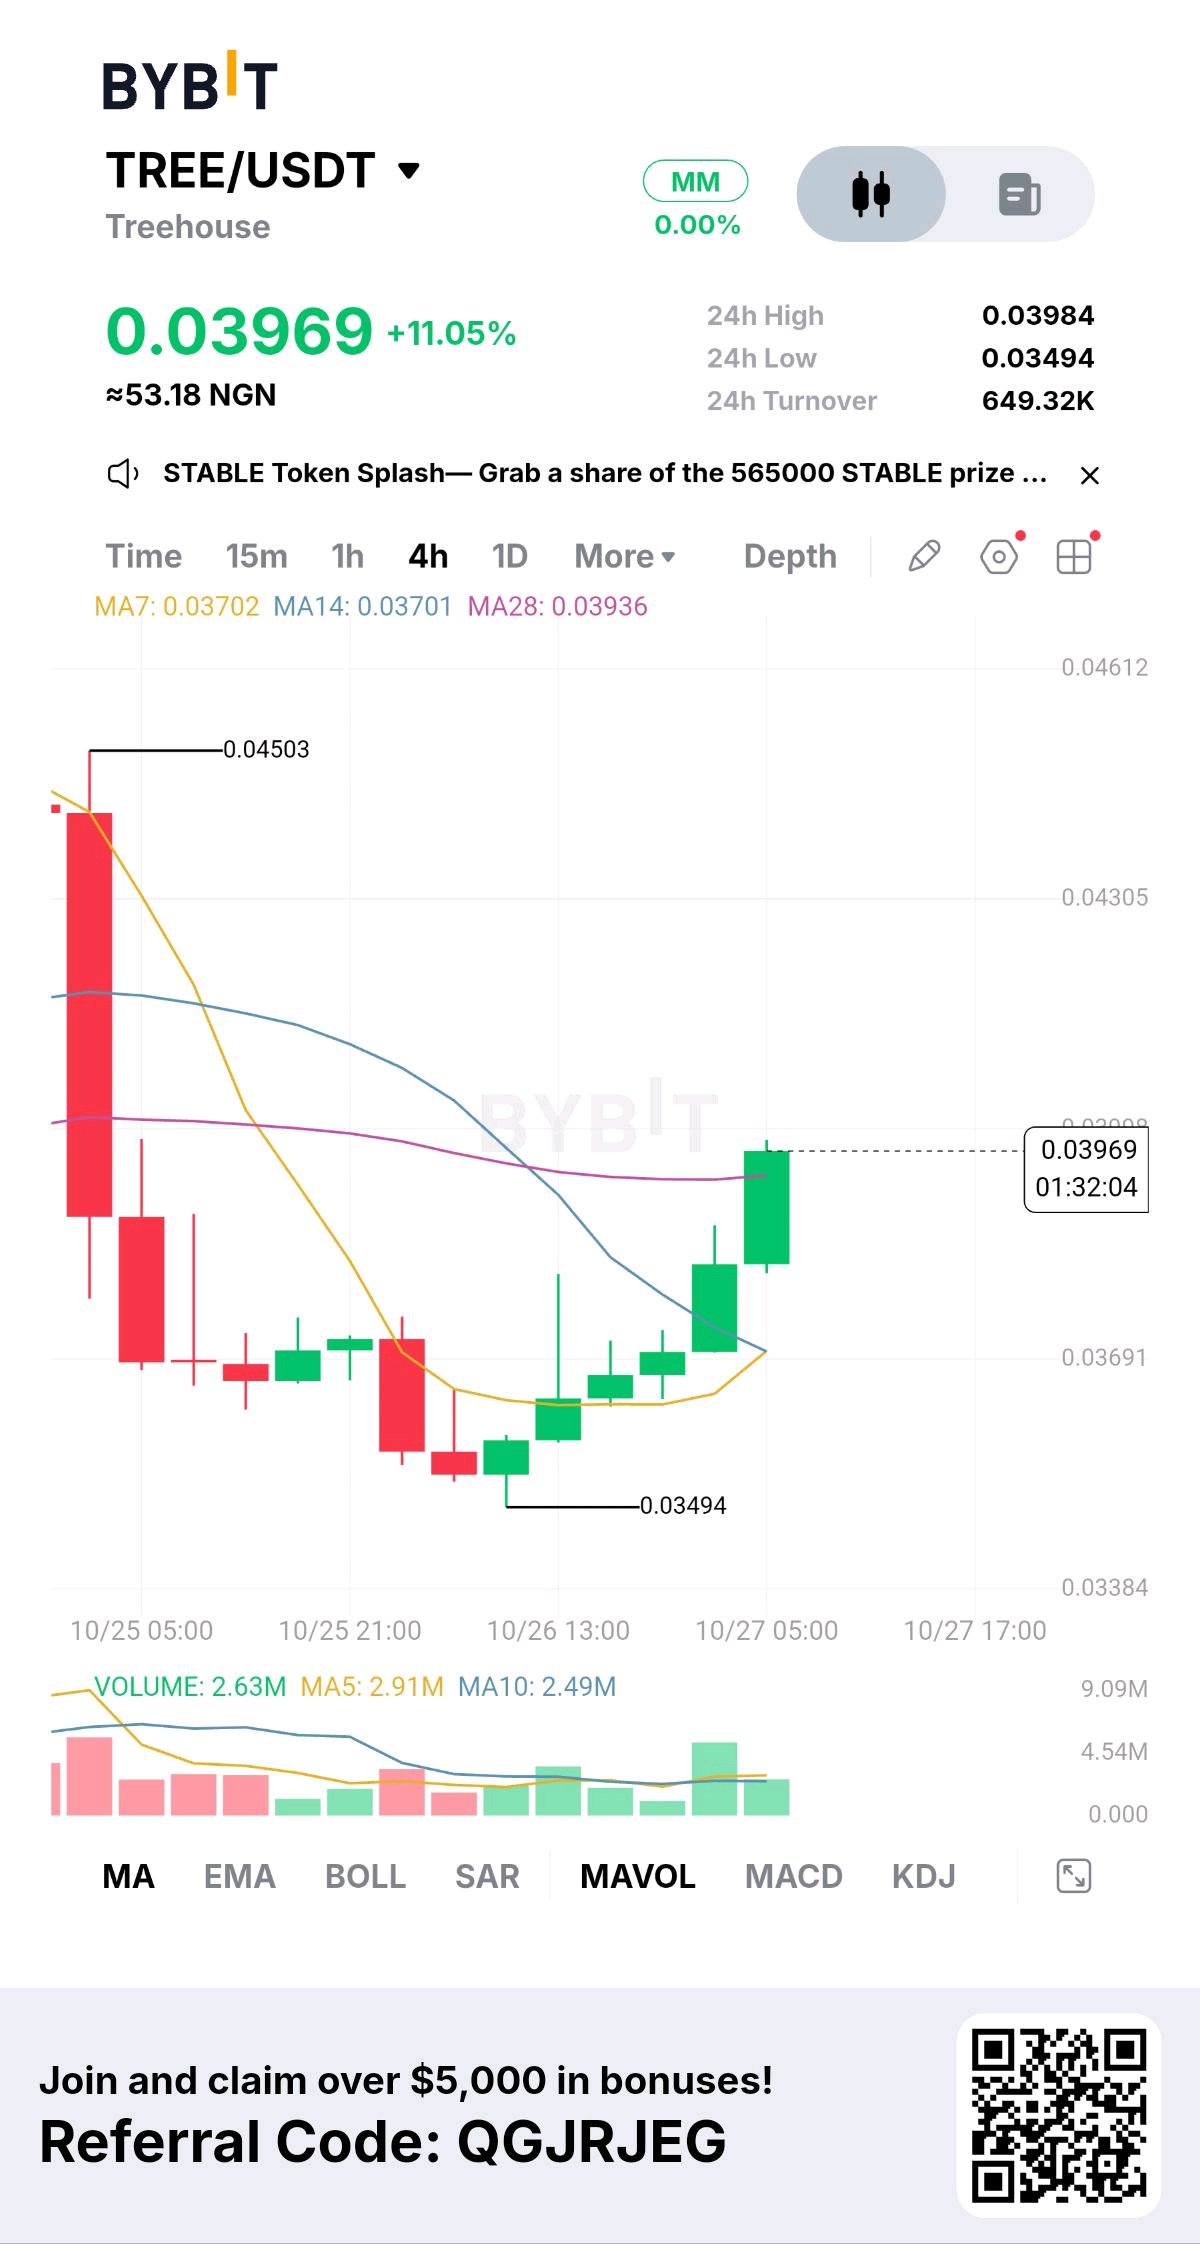
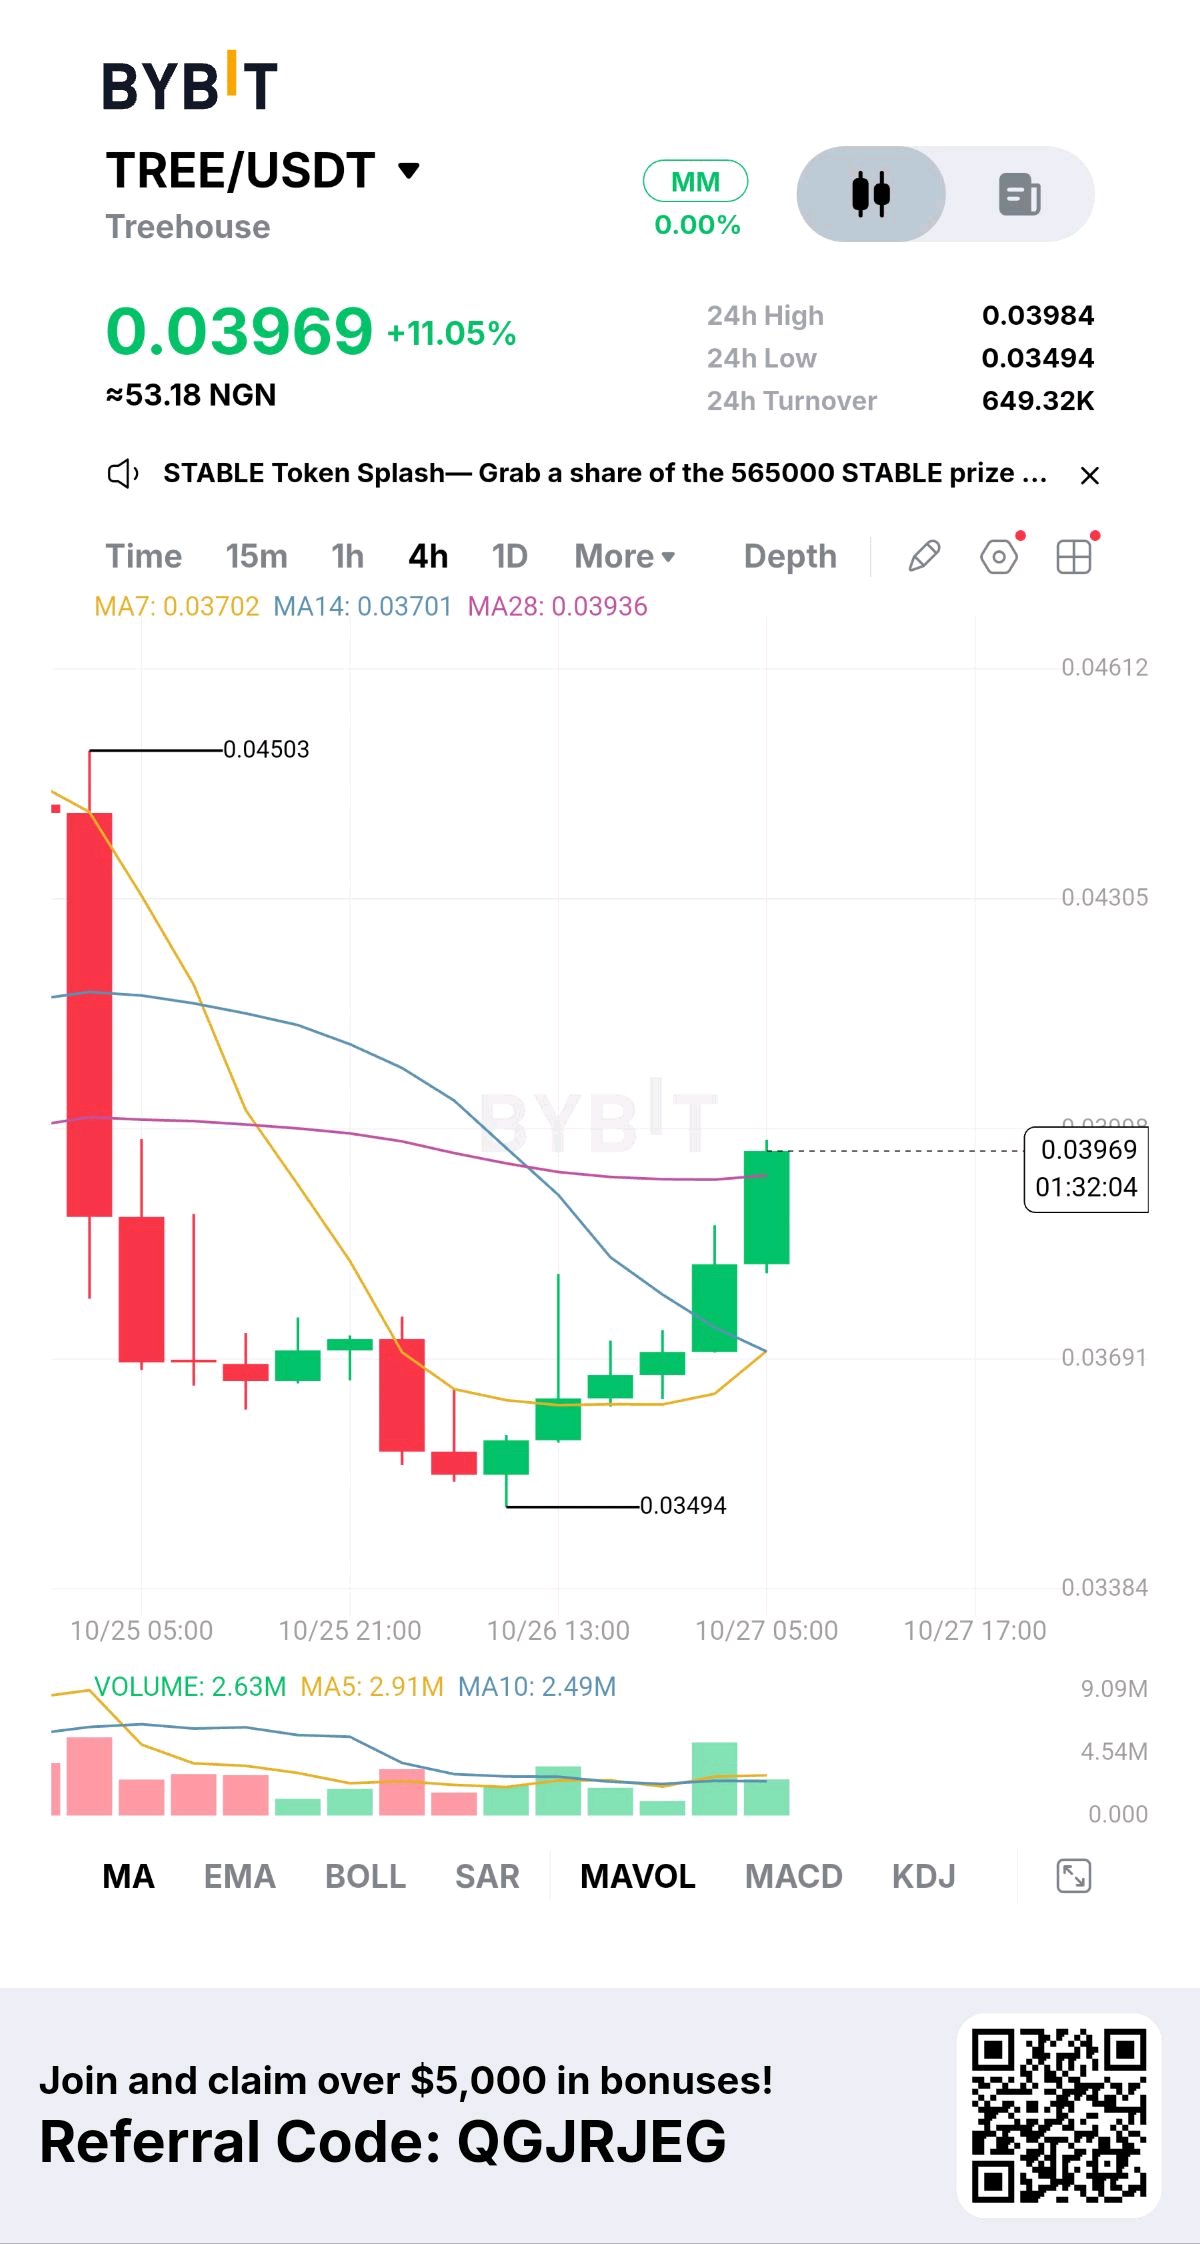
$TREEUSDT is reclaiming its 28-period average after a sharp sell-off, with a recovery leg in play 📈 Direction: LONG 💰 Entry Point (Market): 0.03940-0.03985 ➕ DCA: 0.03700 🎯 Take-profit targets: 0.04305 / 0.04503 / 0.04612 🛑 Stop-loss: 0.03650 📊 Deep market analysis and rationale * Price dynamics and trend structure: On the 4-hour timeframe, TREE sold off hard from the 0.04503 high on 10/25 and bottomed at 0.03494. Since then it has built a base with higher lows and a run of green candles. Price is now 0.03969 (+11.05% on the day), close to the 24h high of 0.03984, and the current candle is still forming. The 0.04503 swing high and the 0.04305 level above it are the natural resistance zones for a recovery. * Moving averages and volume: Price has pushed up to the MA28 (0.03936) and is trading just above it. MA7 (0.03702) and MA14 (0.03701) have flattened together and are turning up from below. That cluster around 0.0370 is the nearest support and the basis for the DCA level. Volume on the latest bar is 2.63M, below its MA5 (2.91M) but above its MA10 (2.49M). The strongest volume came on the previous green candle, so buyers showed up on the breakout leg. * Risk: MA7 and MA14 are still below MA28, so the trend is not confirmed until they cross above it. A move this fast near the 24h high can also pull back, so a retest of 0.0370 is a normal outcome. A 4h close below 0.03650 would break the base and invalidate the setup. The 0.03494 low is the deeper support behind it. ⚖️ Risk/Reward (entry midpoint 0.03963, stop 0.03650, risk about 7.9%) TP1 0.04305: +8.6% (1.1 : 1) TP2 0.04503: +13.6% (1.7 : 1) TP3 0.04612: +16.4% (2.1 : 1) This is market analysis, not financial advice. Only risk what you can afford to lose. #WSOT2026 #IMPACTbyTrade #MyByXTake