LION 🦁
crypto addict, chart reader
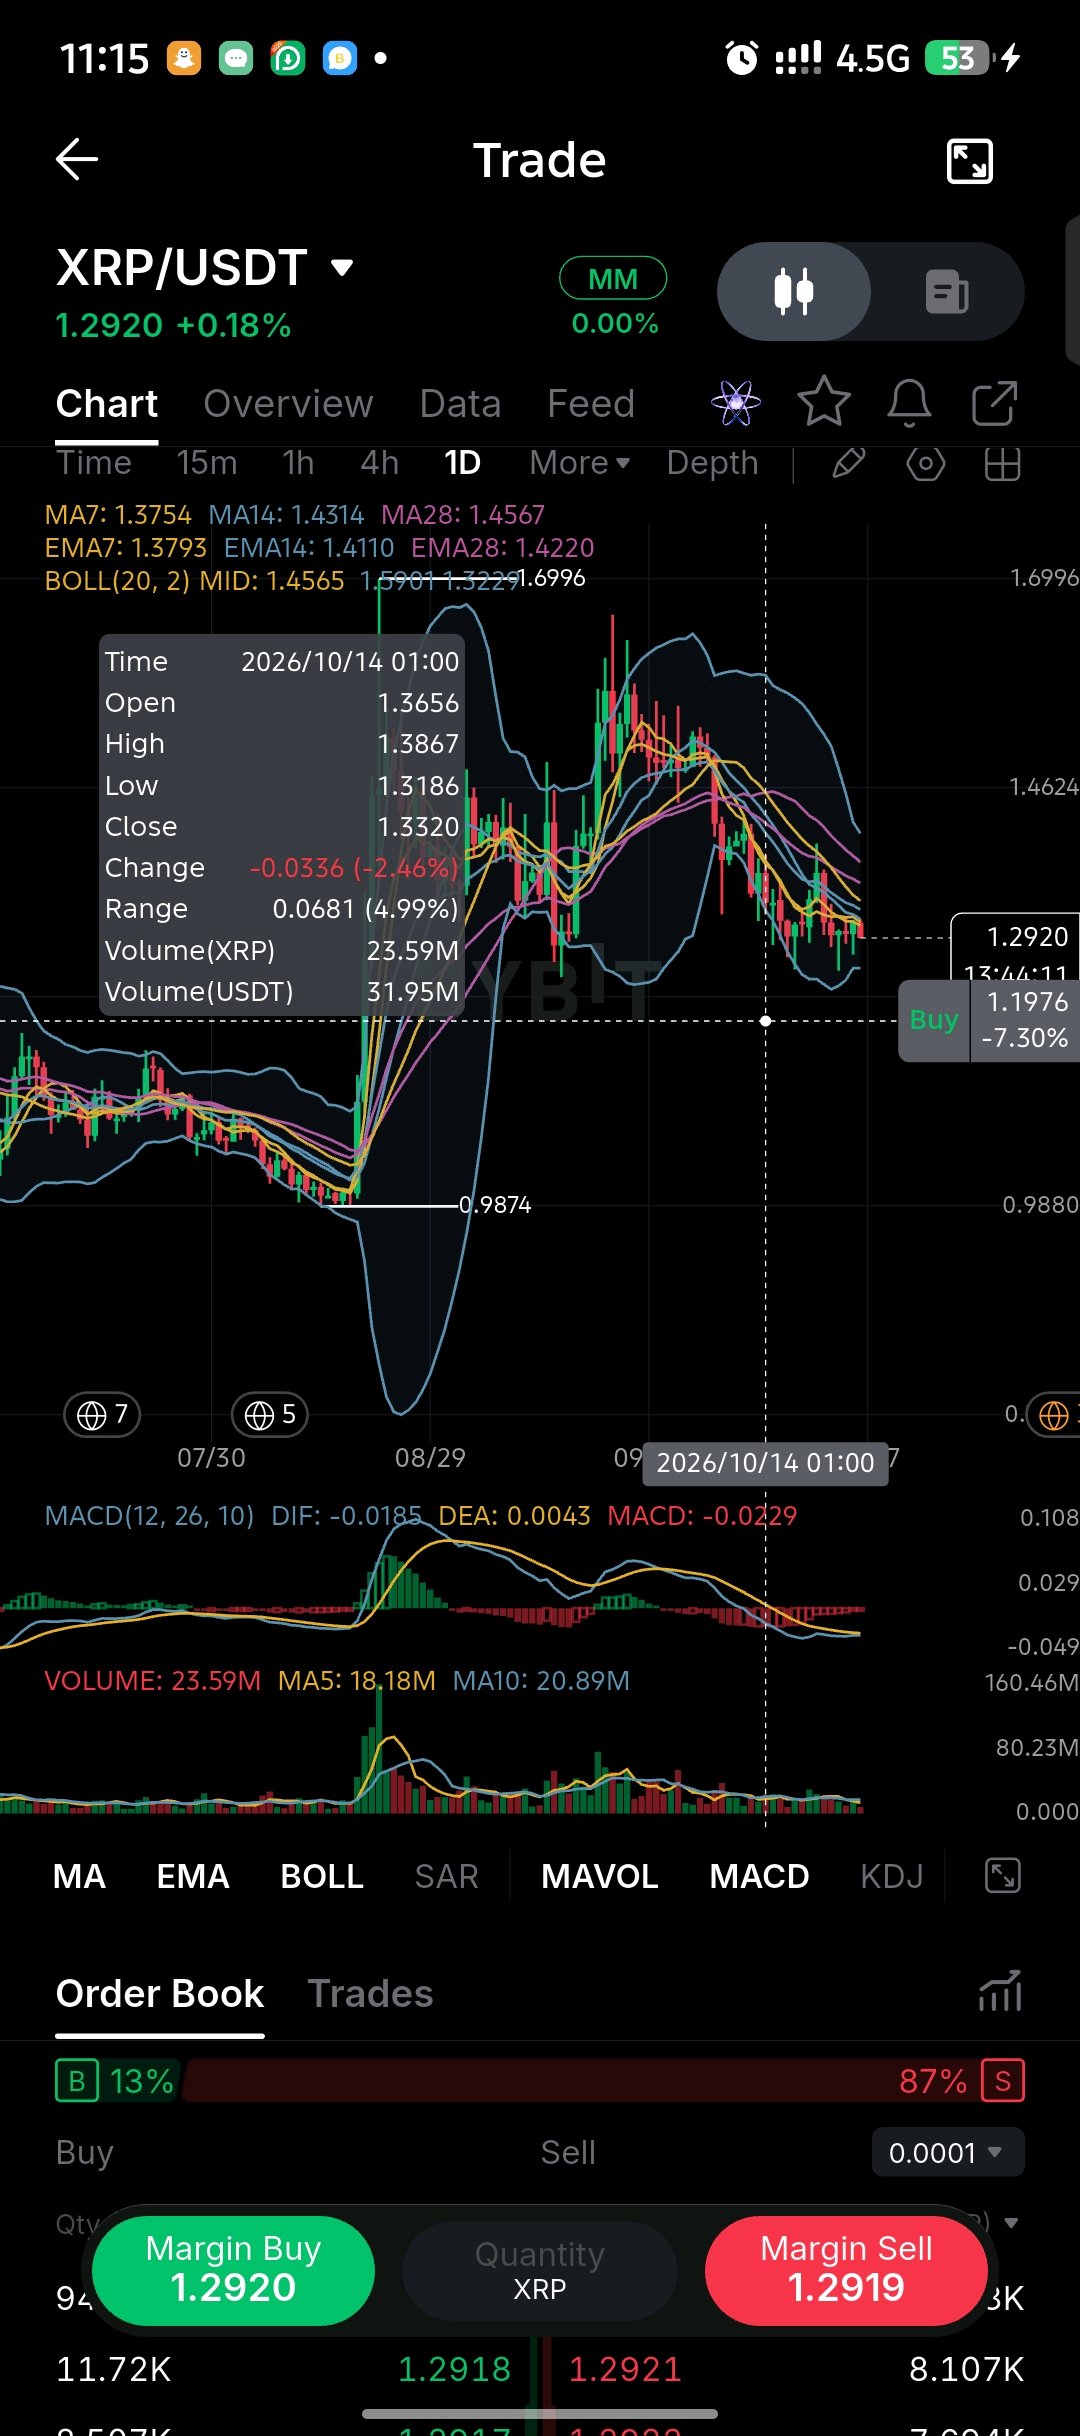
$XRPUSDT is in a short-term downtrend, struggling to bounce back after a big drop from its recent highs. Price is at 1.2920, up a tiny 0.18% today. The daily chart shows the price peaked around 1.60 and has been falling steadily since. Right now, the price is stuck near the bottom of the Bollinger Bands, showing that sellers are still in control. Turnover The tooltip shows a day with heavy volume (23.59M XRP / 31.95M USDT) during a sharp drop. High turnover like this means a lot of traders are actively selling, which explains why the price fell so fast. Volume Current volume is slightly higher than the recent averages (MA5 and MA10). However, this volume is mostly made up of red (selling) candles. There is no big green buying candle to show that buyers are stepping in to stop the drop. Moving Averages MA7: 1.3754 | MA14: 1.4314 | MA28: 1.4567 EMA7: 1.3793 | EMA14: 1.4110 | EMA28: 1.4220 The moving averages are very bearish. Price (1.29) is far below all of them. The lines are pointing down and are stacked above the price, acting like a heavy ceiling. The first big hurdle for the price to climb is the EMA7 at 1.37. Levels to watch · 1.60 — The recent high. · 1.45 — Heavy resistance (MA28). · 1.37 — The first resistance level to beat (EMA7). · 1.2920 — Current price. · 1.1976 — The next support level visible on the chart. Consideration The MACD is deeply negative and the red histogram bars are still there. This means the downward momentum is still strong. Also, look at the Order Book at the bottom: it shows 87% Sell versus only 13% Buy. This means there are way more sellers waiting than buyers, which is a bad sign for a quick bounce. Trade plan · For a bounce: Price needs to close a daily candle above 1.37 (the EMA7). That would be the first sign of strength. · For more downside: If price breaks below the recent low of 1.24, it will likely keep falling toward 1.1976. · Main strategy: Right now, the trend is down. Until the price gets back above the moving averages, it is safer to wait or trade with the trend (sell the bounces). Support and resistance Support: 1.2400 (Recent swing low) → 1.1976 (Next visible support) Resistance: 1.3793 (EMA7) → 1.4110 (EMA14) → 1.4567 (MA28) Invalidation and risk note The downtrend is only "paused" if a daily candle closes above 1.41. The main risk is buying too early. Because the Order Book is 87% sellers, trying to catch the bottom right now is very risky. Wait for buyers to show up first. #XRPUSDT #ByXIMPACT #IMPACTbyTrade
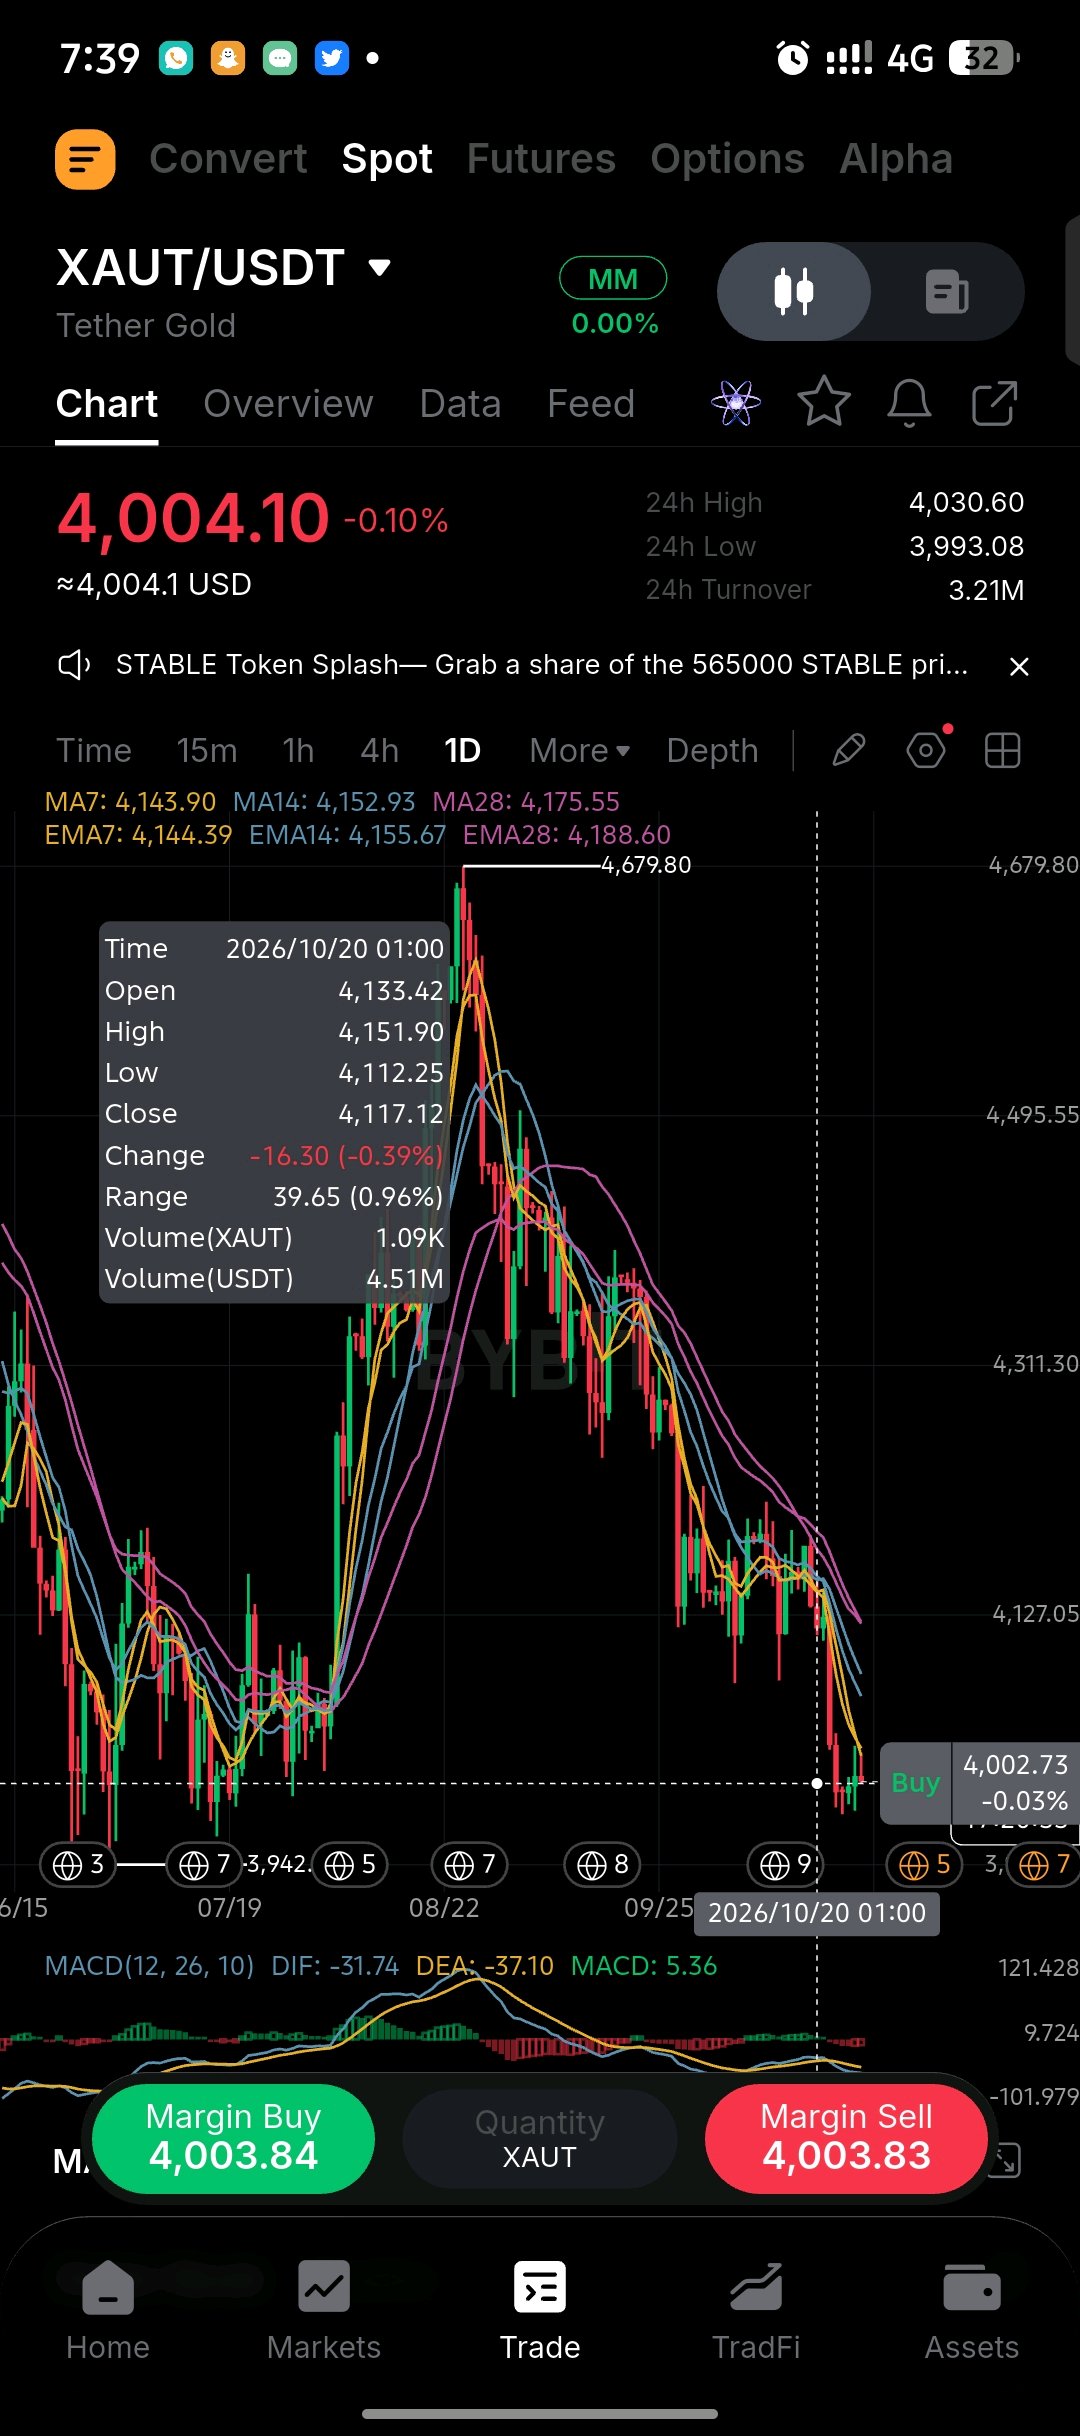
$XAUTUSDT is in a strong downtrend and is falling toward the important 4,000 price level after a big drop from its recent high. Price is at 4,004.10, down 0.10% today. After hitting a high of 4,679.80, the price has been dropping steadily. The daily chart shows the price is stuck at the bottom of the range with no signs that buyers are stepping in to stop the fall. Turnover 24h turnover is 3.21M. A recent 24-hour period showed 4.51M in turnover. This means a lot of money is still trading this asset; it's not quiet. People are actively selling and buying during this downtrend. Volume The current trading volume looks normal, but there is no massive spike in buying. A huge spike in buying is usually what stops a big drop. Because that is missing, sellers are still in control, and the price is likely to keep sliding. Moving Averages MA7: 4,143.90 | MA14: 4,152.93 | MA28: 4,175.55 EMA7: 4,144.39 | EMA14: 4,155.67 | EMA28: 4,188.60 The moving averages are very bearish. Price (4,004) is far below all of them. The lines are pointing down and acting like a heavy ceiling, making it hard for the price to go up. The first big hurdle to clear is the EMA7 at 4,144. Levels to watch · 4,679.80 — The recent high. · 4,188.60 — Heavy resistance above. · 4,144.39 — The first resistance level to beat. · 4,004.10 — Current price. · 4,000.00 — A very important mental support level. · 3,942.00 — The next support level if 4,000 breaks. Consideration The MACD (a trend indicator) is deeply negative but showing tiny green bars. This means the fall is still strong, but maybe slowing down a little. The biggest focus right now is the 4,000 level. If price falls below this big round number, it could cause a fast panic sell. Trade plan · For a bounce: Price must close a daily candle above 4,144 (the EMA7). That is the first real sign of a bounce. · For more downside: If price closes below 4,000, the fall will likely continue toward 3,942. · Main strategy: Until price gets back above the moving averages, the safest play is to sell when the price bounces up near 4,144. Support and resistance Support: 4,000.00 (Big round number) → 3,942.00 (Next historical low) Resistance: 4,144.39 (EMA7) → 4,175.55 (MA28) → 4,188.60 (EMA28) Invalidation and risk note The downtrend is only "paused" if a daily candle closes above 4,155. The main risk right now is losing the 4,000 level. If it breaks below 4,000 with high volume, expect the price to drop very quickly. #XAUTUSDT #ByXIMPACT
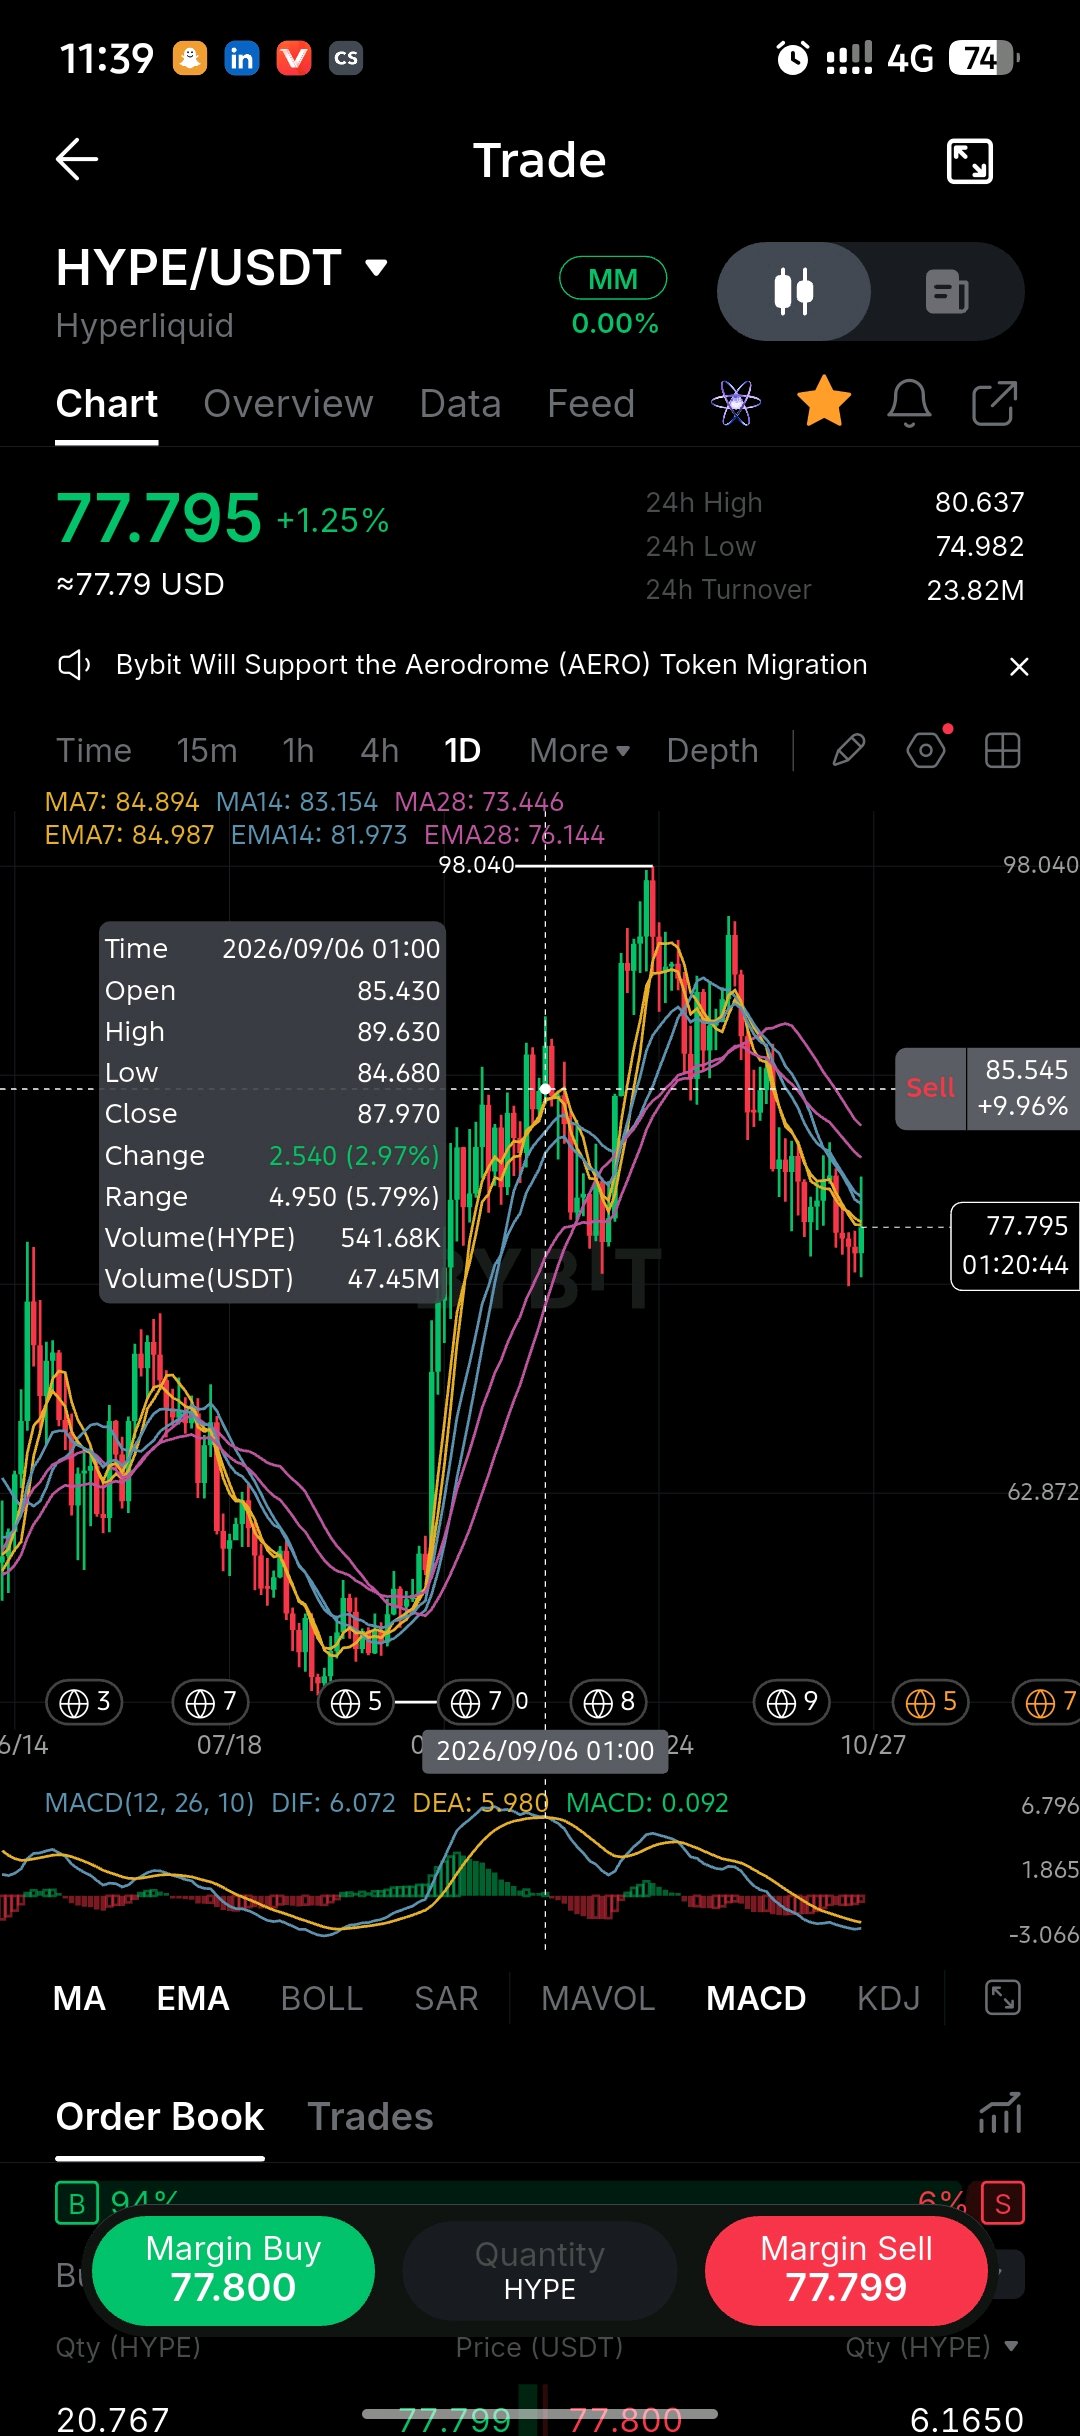
$HYPEUSDT is attempting to find a floor after a steep multi-week correction, but the broader structure remains heavily bearish. Price sits at 77.795, up 1.25% for the session, following a significant drawdown from the 98.040 macro high. The daily chart shows a clear sequence of lower highs and lower lows, with the current minor green candle representing a potential relief bounce rather than a confirmed trend reversal. Turnover 24h turnover is 23.82M. The highlighted tooltip from the 09/06 session shows a daily turnover of 47.45M during the aggressive upward expansion. Current turnover is roughly half of that peak, indicating the market is actively trading the downside but lacking the aggressive capital inflow seen during the previous uptrend. Volume Current volume is subdued compared to the heavy selling volume during the recent drop from the 90s. The lack of a massive capitulation spike on this recent low, combined with the weak bounce, suggests sellers might be running out of steam, but buyers are not yet showing the conviction required to reverse the dominant downtrend. Moving Averages MA7: 84.894 | MA14: 83.154 | MA28: 73.446 EMA7: 84.987 | EMA14: 81.973 | EMA28: 76.144 The moving average structure is distinctly bearish. Price (77.795) is trading well below the short-term MA7, MA14, EMA7, and EMA14, which are all sloping downward and acting as dynamic resistance. Crucially, price is currently hovering just above the longer-term EMA28 (76.144), testing a critical support baseline. Levels to watch · 98.040 — The macro swing high and major long-term ceiling. · 84.987 — EMA7, the first significant overhead resistance. · 81.973 — EMA14, part of the immediate resistance cluster. · 77.795 — Current price. · 76.144 — EMA28, the immediate dynamic support floor. · 73.446 — MA28, the deeper structural support level. Consideration The MACD (DIF: 6.072, DEA: 5.980) is flattening, with the DIF line crossing below the DEA and red histogram bars printing. This confirms that momentum has shifted bearish. The price is currently pinned just above the EMA28. If this support gives way, the sell-off could accelerate toward the MA28. Trade plan · Base-building path: A daily close back above the EMA14 (81.97) would be the first sign of a local bottom, opening the door for a retest of the 85 EMA7 level. · Breakdown path: A daily close below the EMA28 (76.14) would confirm the bears are still in control, likely opening a path toward the 73.44 MA28 level and potentially lower. · Until price reclaims the 82 EMA14 level, the market is in a "sell rallies" environment. Chasing this green candle is risky without a structural break. Support and resistance Support: 76.144 (EMA28) → 73.446 (MA28) Resistance: 81.973 (EMA14) → 84.987 (EMA7) → 98.040 (Macro high) Invalidation and risk note The current stabilization attempt is invalidated if price closes decisively below the 76.14 EMA28 level. A breakdown there would signal a deeper correction is underway. Watch how price reacts at the 82 EMA14 resistance; if it rejects there, the path of least resistance remains down. #HYPEUSDT #ByXIMPACT
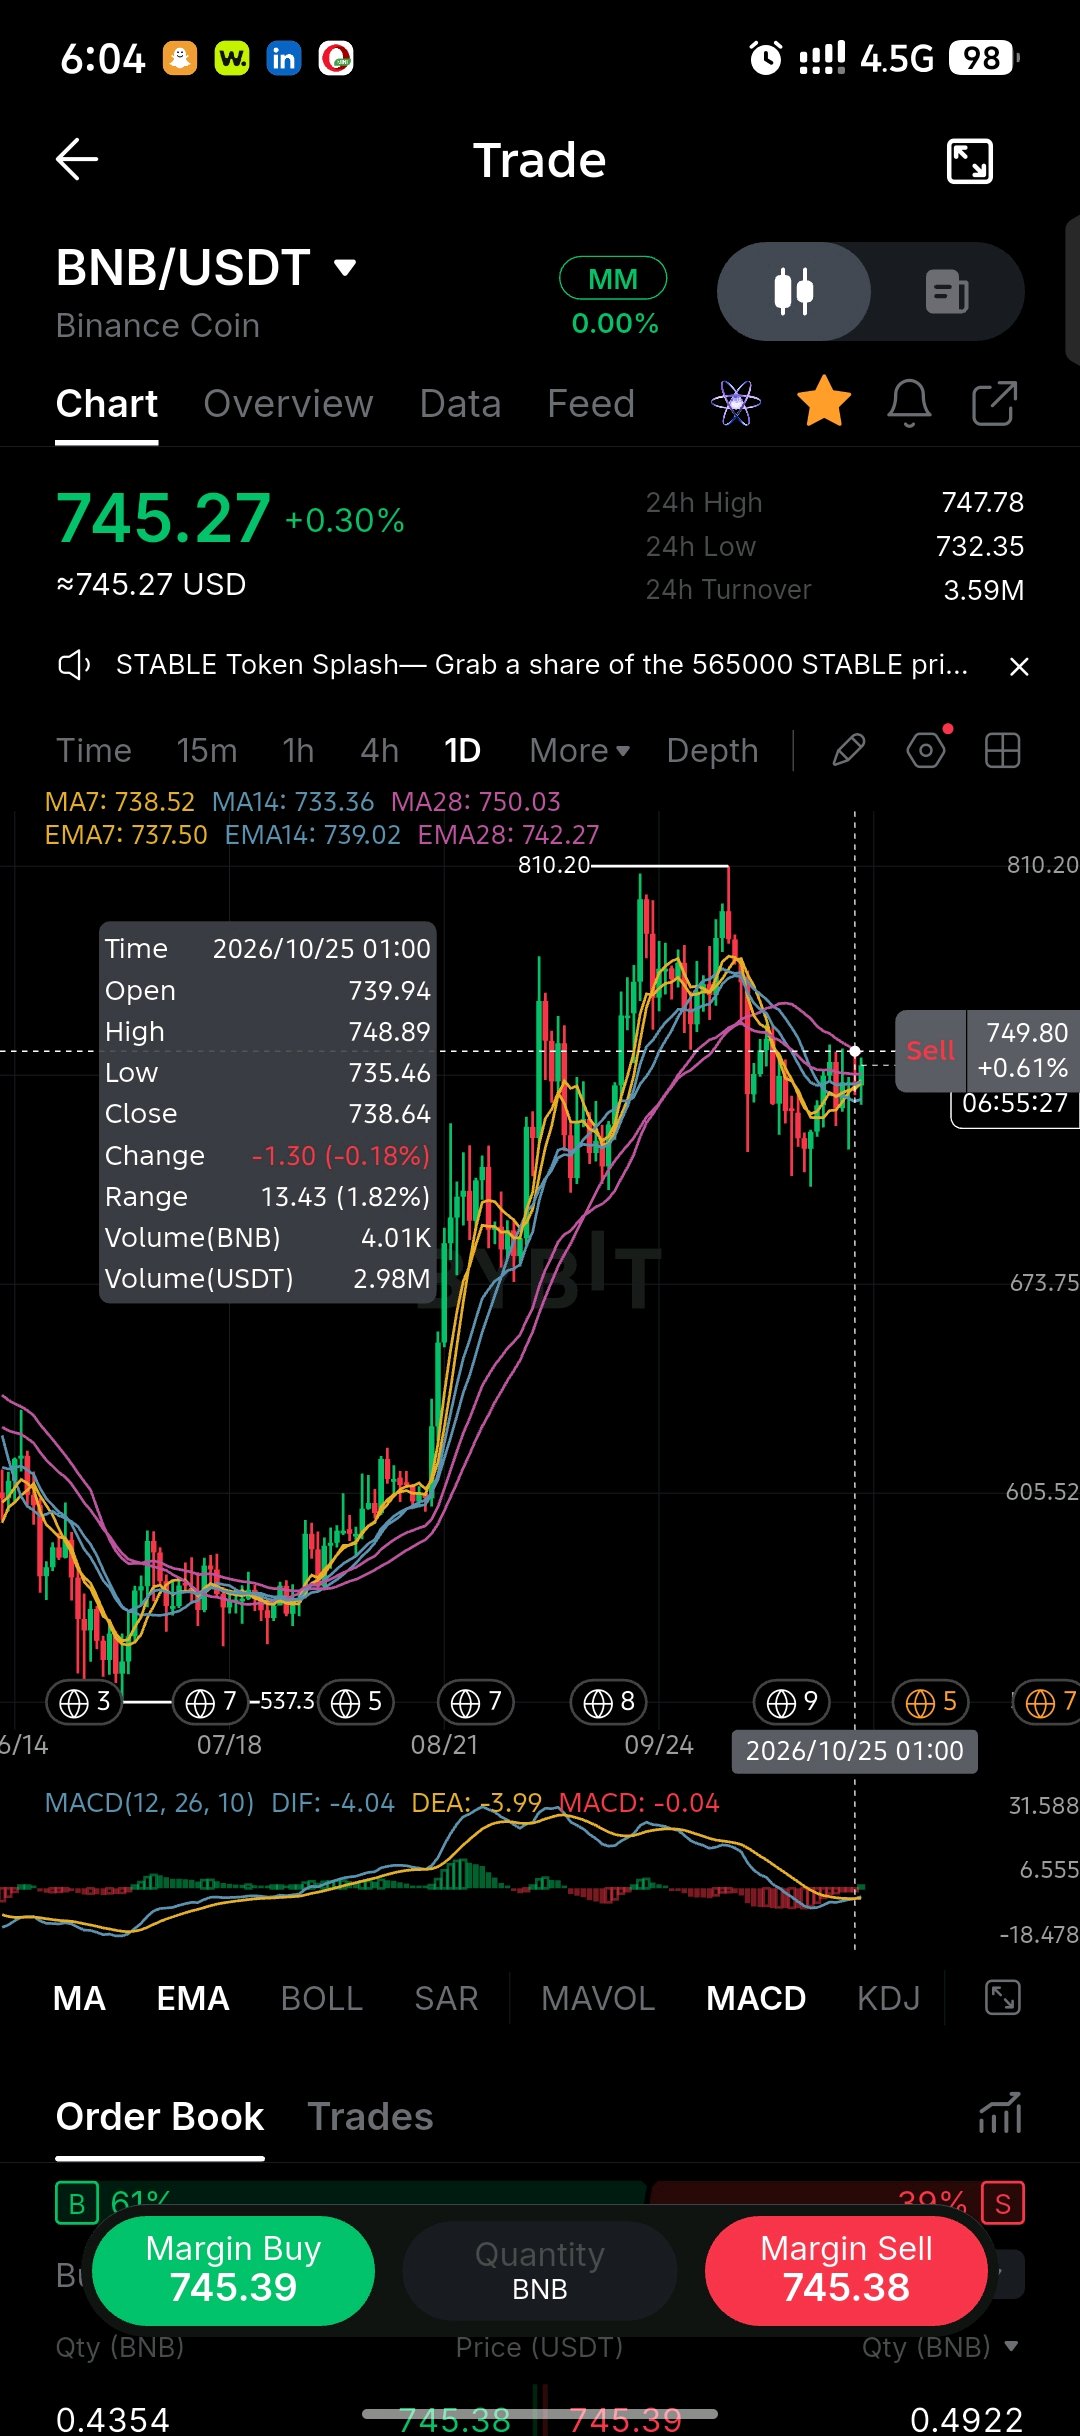
$BNBUSDT is attempting to stabilize after a short-term pullback, but remains capped by a dense cluster of moving average resistance. Price sits at 745.27, up 0.30%, following a steady retracement from the recent macro high of 810.20. The daily chart shows price has broken below the recent ascending trend and is now trapped in a consolidation phase, testing immediate support while overhead averages apply pressure. Turnover 24h turnover is 3.59M. The highlighted tooltip from the 10/25 session shows a daily turnover of 2.98M during a tight range day. Turnover remains consistent, suggesting steady participation, but it lacks the aggressive volume surge typically seen at major trend reversal points. Volume Current volume is relatively subdued compared to the heavy buying volume during the late August and September run-up. The recent pullback candles show contracting volume, indicating that heavy selling pressure has paused. However, the lack of a high-volume bullish breakout candle means buyers have yet to show aggressive conviction. Moving Averages MA7: 738.52 | MA14: 733.36 | MA28: 750.03 EMA7: 737.50 | EMA14: 739.02 | EMA28: 742.27 The moving average structure is compressed and slightly bearish in the short term. Price (745.27) is currently wedged between the short-term MA7/EMA7 below and the longer-term MA28/EMA28 above. The EMA28 (742.27) and MA28 (750.03) are creating a heavy resistance ceiling, while the shorter averages are flattening. Levels to watch · 810.20 — The macro swing high and major long-term ceiling. · 750.03 — MA28, the immediate heavy overhead resistance. · 747.78 — Today's high and local resistance. · 745.27 — Current price. · 742.27 — EMA28, the first dynamic support to hold. · 737.50 — EMA7, deeper short-term support. · 733.36 — MA14, the immediate structural floor. Consideration The MACD (DIF: -4.04, DEA: -3.99) is negative and hovering just below the signal line with flat red histogram bars. This indicates that momentum is currently neutral-to-bearish. The market is in a state of compression; the price is coiling within the moving average cluster and needs a decisive daily close outside this range to establish the next trend. Trade plan · Bullish Continuation: A daily close above the 750 MA28 level, backed by a return in volume, would signal the correction is over and open a path back toward 780+. · Range Play: The market is currently chopping between the 733 MA14 support and the 750 MA28 resistance. Trade the edges defensively. · Breakdown Path: A daily close below the 733 MA14 level would indicate the consolidation has resolved to the downside, opening a deeper retracement toward the 700 psychological level. Support and resistance Support: 742.27 (EMA28) → 737.50 (EMA7) → 733.36 (MA14) Resistance: 747.78 (Today's high) → 750.03 (MA28) → 810.20 (Macro high) Invalidation and risk note The short-term bullish structure is invalidated if price loses the 733 MA14 support on a daily close. Watch the 750 MA28 level closely; a rejection there confirms the current downtrend is still active, while a breakout reclaims the trend. #BNBUSDT #ByXIMPACT
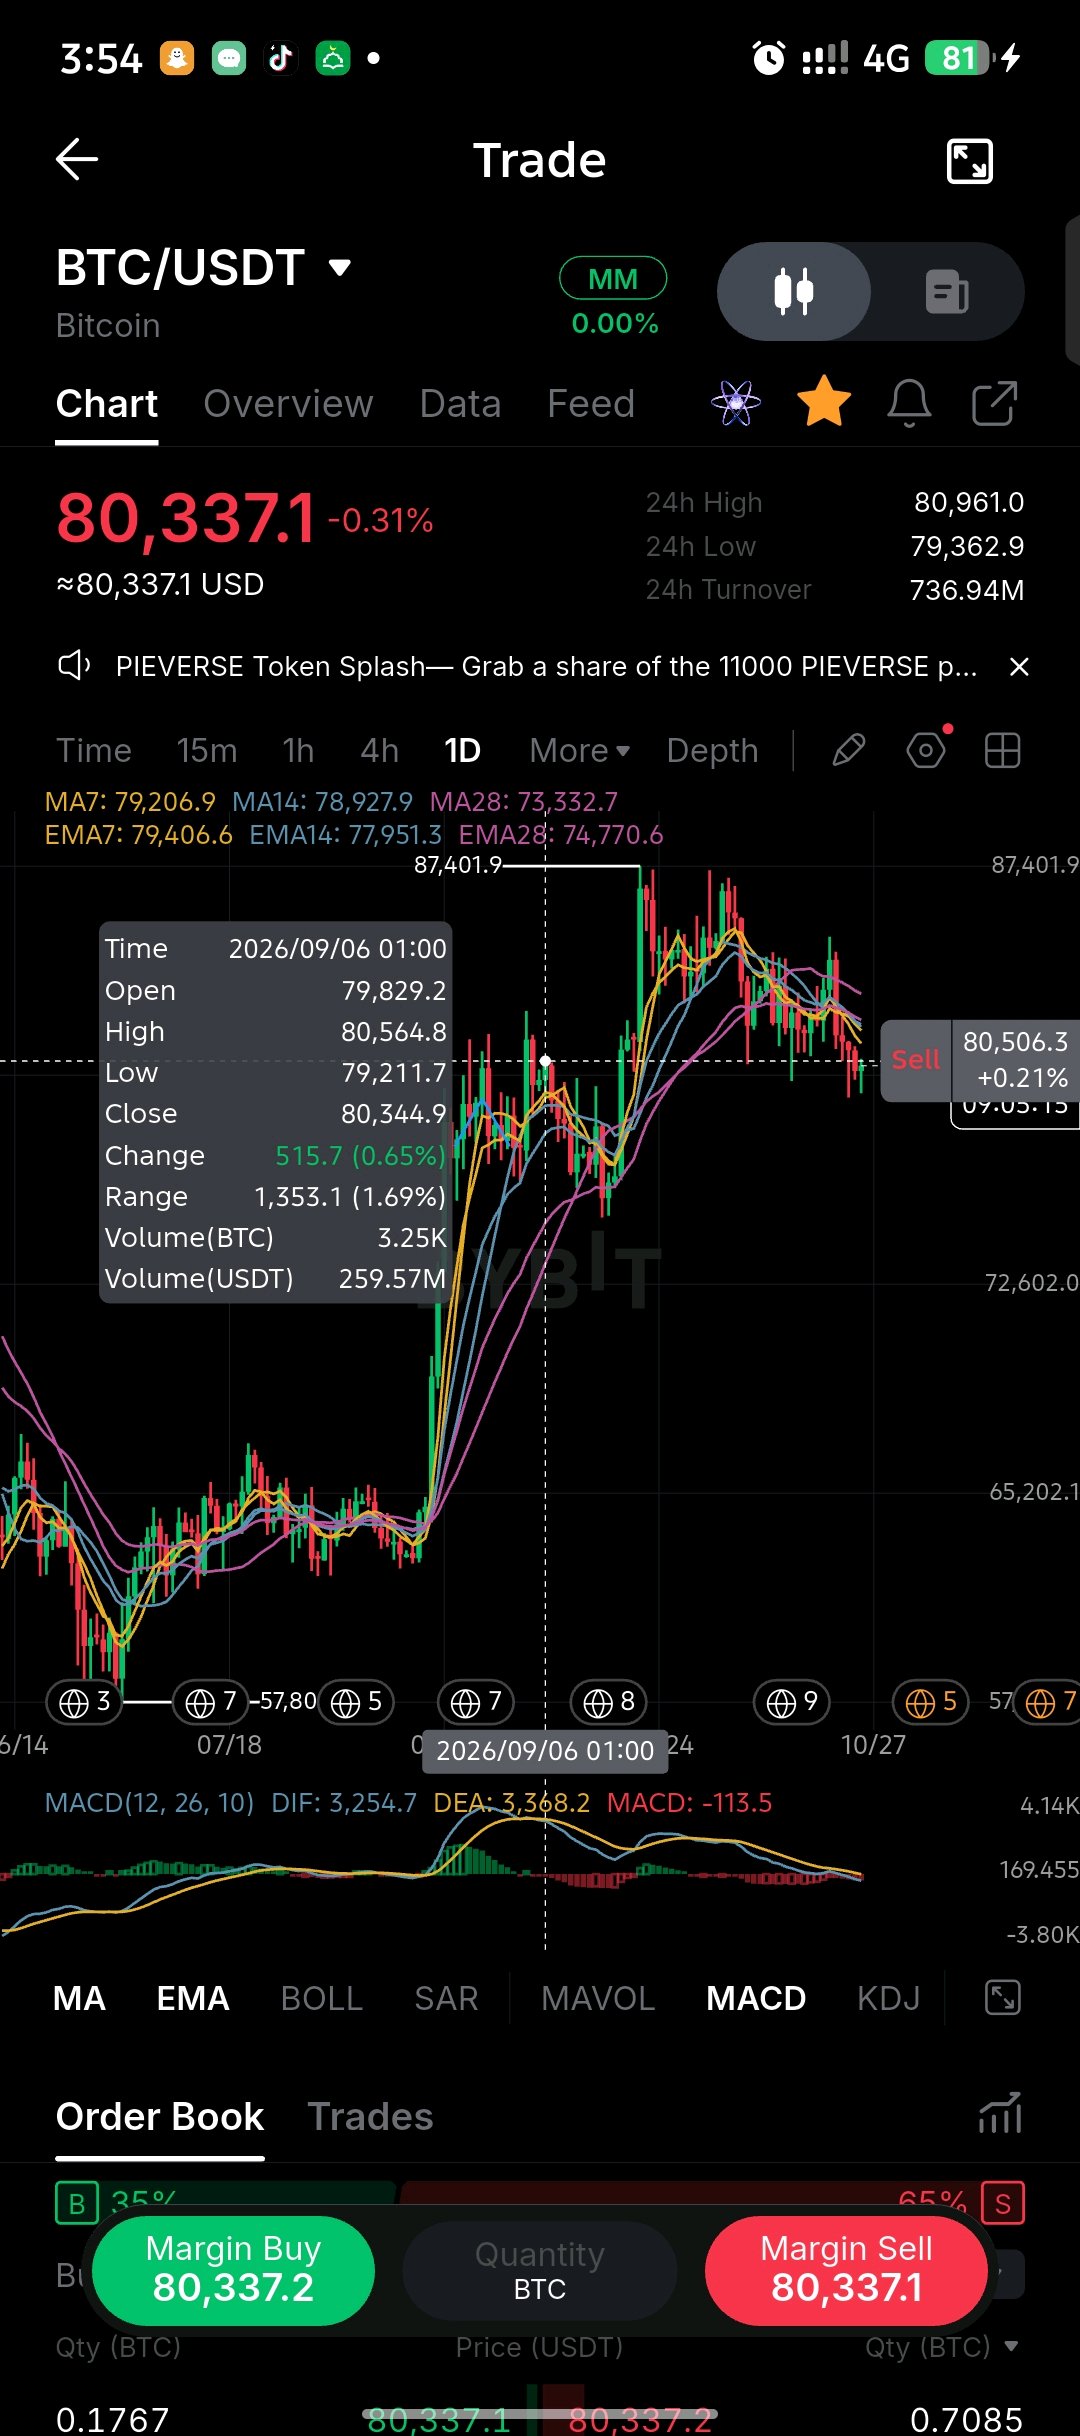
$BTCUSDT is in a corrective phase, attempting to halt a short-term slide just above a major moving average support cluster. Price sits at 80,337.1, down 0.31% for the session, retreating from the recent macro high of 87,401.9. The daily chart shows a clear loss of upward momentum following a massive run, with price currently finding a tentative floor around the 80k psychological level. Turnover 24h turnover is a massive 736.94M. The highlighted tooltip from the 09/06 session shows a daily turnover of 259.57M during the initial breakout phase. Turnover remains exceptionally high, confirming that this is a heavily contested zone where large players are actively repositioning. Volume Current volume is notably lower than the aggressive buying volume seen during the run to 87k. The recent pullback candles show contracting volume, suggesting that while upside momentum has stalled, the market is not experiencing a panic capitulation. Buyers are stepping in around 80k, but lack aggressive conviction to immediately push prices back to the highs. Moving Averages MA7: 79,206.9 | MA14: 78,927.9 | MA28: 73,332.7 EMA7: 79,406.6 | EMA14: 77,951.3 | EMA28: 74,770.6 The moving average structure remains broadly bullish but is showing signs of short-term fatigue. Price is currently entangled with the short-term MA7 and EMA7. Crucially, it remains well above the longer-term MA14/EMA14 and MA28/EMA28 clusters, which are still sloping upward. The EMA7 is flattening out, indicating a loss of immediate upward velocity. Levels to watch · 87,401.9 — The recent macro swing high and major ceiling. · 80,961.0 — Today's high and immediate local resistance. · 80,337.1 — Current price. · 79,406.6 — EMA7, the immediate dynamic support line. · 78,927.9 — MA14, a key structural support level if the EMA7 fails. · 74,770.6 — EMA28, the deeper macro support baseline. Consideration The MACD (DIF: 3,254.7, DEA: 3,368.2) shows the DIF crossing below the DEA, with red histogram bars expanding. This confirms that the short-term momentum is bearish, despite the longer-term uptrend. The price is currently in a holding pattern; the market is digesting the massive move from the 60k region. Trade plan · Bullish Continuation: A strong daily close back above 80,961, followed by a push through 82k, would signal the correction is over and the market is ready to challenge the highs. · Consolidation Path: Continued sideways chop between 79k and 81k, allowing the short-term moving averages to catch up with the longer-term ones. · Breakdown Path: A daily close below the MA14 (78,927) would signal a deeper correction, likely opening a path toward the 75k EMA28 zone. Support and resistance Support: 79,406.6 (EMA7) → 78,927.9 (MA14) → 74,770.6 (EMA28) Resistance: 80,961.0 (Today's high) → 87,401.9 (Macro high) Invalidation and risk note The short-term bullish structure is invalidated if price closes decisively below the 78,900 MA14 level. Watch the 79.4k EMA7 closely; a breach there likely signals a flush to the deeper 75k support. The market is in a decision phaseavoid over-leveraging until direction is confirmed. #BTCUSDT #BybitAI #BybitOdds #ByXIMPACT
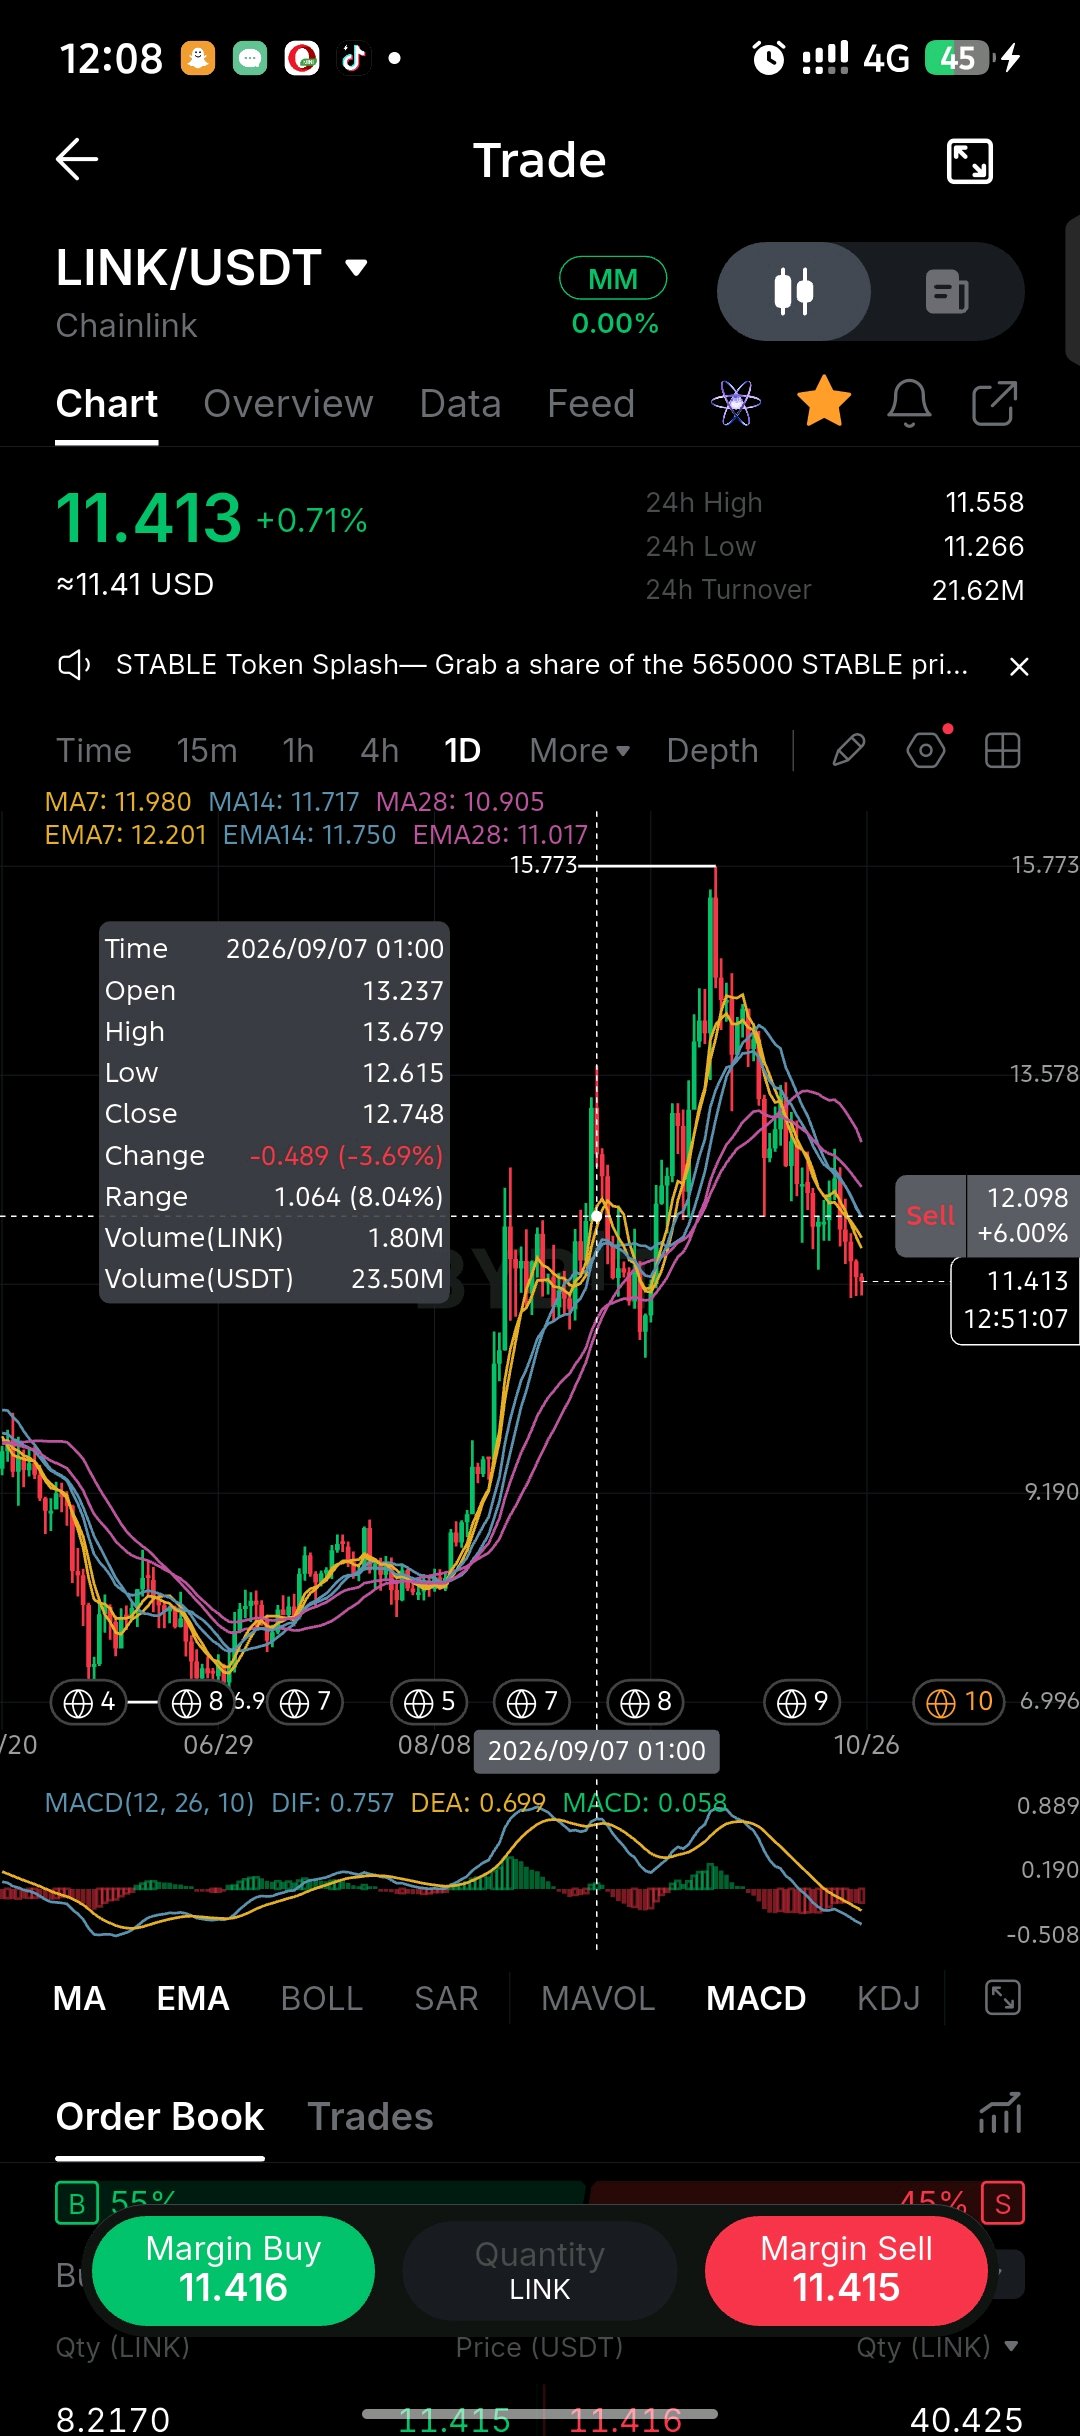
$LINKUSDT is attempting to find a floor after a sharp multi-week retracement from its recent highs, but remains trapped below overhead moving average resistance. Price sits at 11.413, up 0.71%, following a heavy sell-off that dragged the asset down from the 15.773 macro high. The daily chart shows a clear loss of upward momentum since late September, with the current minor green candle representing a tentative pause in the downtrend rather than a confirmed reversal. Turnover 24h turnover is 21.62M. The highlighted tooltip from the 09/07 session shows a daily turnover of 23.50M during a volatile swing. Turnover remains steady near these lower levels, indicating the market is actively participating and watching this support zone closely, rather than drifting on low liquidity. Volume Current volume is relatively subdued compared to the aggressive selling volume seen during the drop from the highs. The lack of a massive capitulation volume spike on this recent low, combined with the weak bounce, suggests sellers might be exhausted, but buyers are not yet showing the conviction required to reverse the trend. Moving Averages MA7: 11.980 | MA14: 11.717 | MA28: 10.905 EMA7: 12.201 | EMA14: 11.750 | EMA28: 11.017 The moving average structure remains bearish. Price (11.413) is trading below the short-term MA7, MA14, EMA7, and EMA14. However, it is currently holding just above the longer-term MA28 and EMA28. The shorter averages are curling downward, applying immediate dynamic resistance above the current price. Levels to watch · 15.773 — The macro swing high and major long-term ceiling. · 12.201 — EMA7, the first significant dynamic resistance to reclaim. · 11.750 — EMA14, part of the immediate overhead resistance cluster. · 11.413 — Current price. · 11.017 — EMA28, the immediate dynamic support floor. · 10.905 — MA28, the deeper structural support level. Consideration The MACD (DIF: 0.757, DEA: 0.693) shows the DIF line crossing below the DEA, with red histogram bars expanding. This confirms that short-term momentum has shifted bearish. The price is currently pinned between the falling short-term moving averages above and the rising long-term averages below, creating a compression zone. Trade plan · Base-building path: A daily close back above the EMA7 (12.20) would be the first sign of a local bottom, opening the door for a retest of the 13.50 range. · Breakdown path: A daily close below the EMA28 (11.01) would confirm the bears are still in control, likely opening a path toward the 9.19 support level. · Until price reclaims the 11.75 EMA14 level, the market is in a "wait and see" mode. Support and resistance Support: 11.017 (EMA28) → 10.905 (MA28) → 9.19 (Historical support) Resistance: 11.750 (EMA14) → 12.201 (EMA7) → 13.578 (Local swing high) Invalidation and risk note The current stabilization attempt is invalidated if price closes decisively below the 11.01 EMA28 level. A breakdown there would signal a deeper correction is underway. Watch how price reacts at the 11.75 resistance; if it rejects there, the path of least resistance remains down. #LINKUSDT #ByXIMPACT
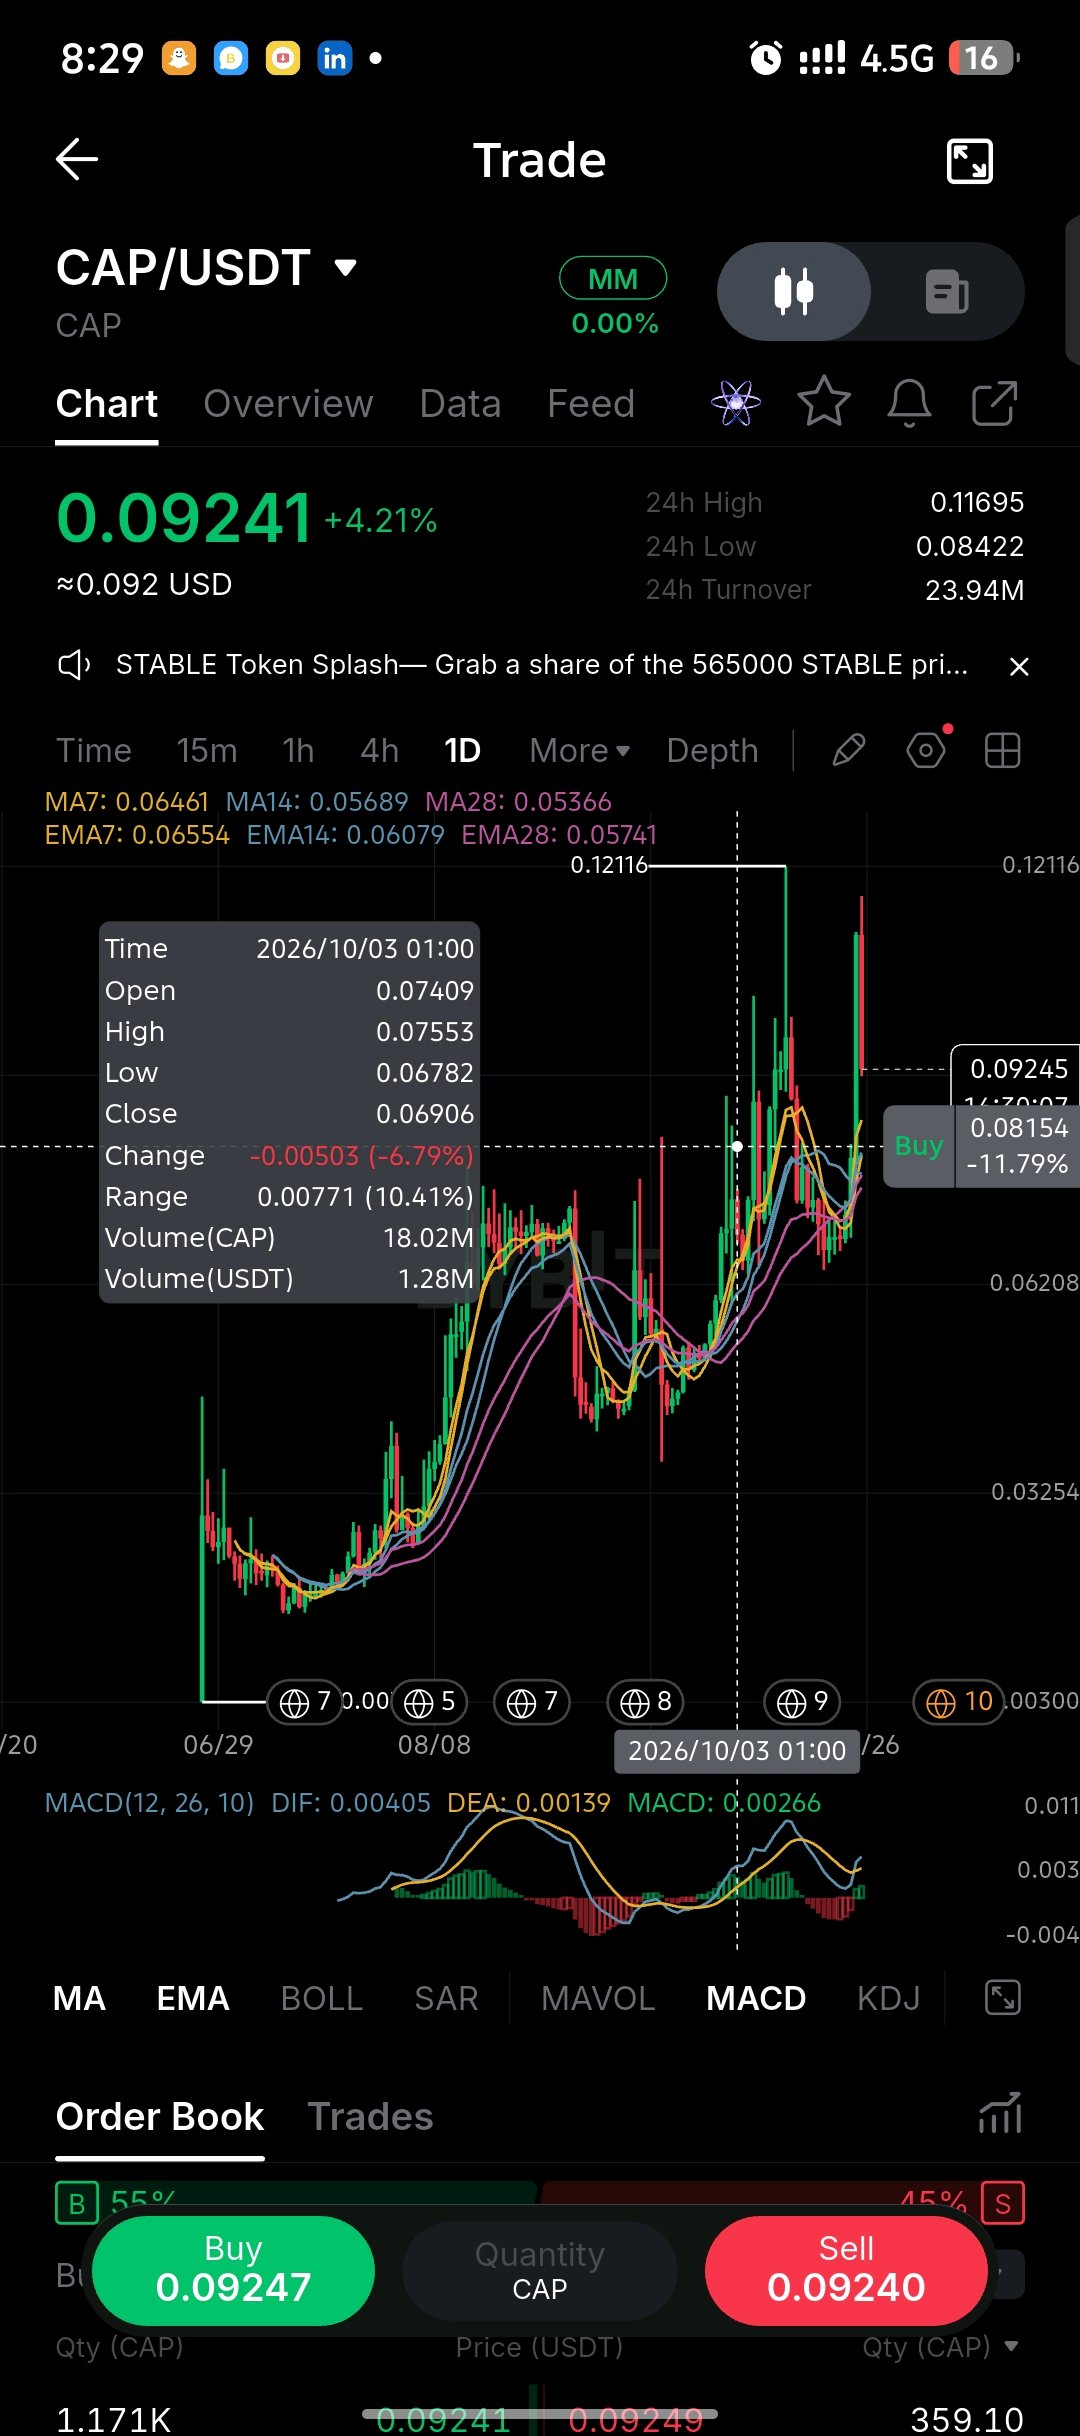
$CAPUSDT is experiencing extreme volatility, attempting to stabilize after a massive rejection from its recent local highs. Price sits at 0.09241, up 4.21%, following a wild 24-hour session that saw a swing from a 0.08422 low up to a 0.11695 high. The daily chart shows a significant, high-volume rejection wick at the top, indicating heavy profit-taking, though buyers are currently stepping back in to defend the current level. Turnover 24h turnover is a substantial 23.94M. This high level of activity confirms that this asset is currently a battleground. The market is highly engaged, and the elevated turnover explains the massive intraday ranges and long wicks seen on the recent candles. Volume The highlighted tooltip from the 10/03 session shows a volume spike of 18.02M CAP during a red day. Looking at the recent price action, volume has remained elevated during this massive expansion phase. The recent red candles carry significant volume, suggesting that the recent pullback involved real selling pressure, not just thin-market drift. Moving Averages MA7: 0.06461 | MA14: 0.05689 | MA28: 0.05366 EMA7: 0.06554 | EMA14: 0.06079 | EMA28: 0.05741 The moving average structure is wildly bullish, but heavily lagging the current price. Price is trading nearly 50% above the 7-period moving averages. This extreme deviation from the baseline often precedes mean reversion or extended consolidation. The averages are fanned out aggressively, confirming the underlying trend is up, but the price is severely overextended. Levels to watch · 0.12116 — The recent macro high and the major ceiling. · 0.11695 — Today's high and immediate local resistance. · 0.09245 — Current price/visible chart level. · 0.08154 — The visible "Buy" order book support level. · 0.06782 — The low from the highlighted 10/03 tooltip session, a deeper structural support. Consideration The MACD (DIF: 0.00405, DEA: 0.00139) is positive but the histogram is beginning to flatten or tick down. The most notable feature of this chart is the massive upper wick on the recent candle. Price ran up to 0.116+, but sellers aggressively pushed it all the way back down to the 0.09s. This is a classic sign of exhaustion and a local top formation. Trade plan · Bullish Continuation: A daily close that reclaims the 0.10 psychological level and pushes back toward today's high would show the market is absorbing the selling pressure. · Breakdown/Consolidation Path: A daily close below the 0.0815 order book support would confirm the local top is in, opening the door for a deeper retracement toward the moving average baseline. · With price this extended from the MAs, chasing the green candle here is highly risky. Trading the range between the high and the visible support is the safer play. Support and resistance Support: 0.08154 (Visible support) → 0.06782 (Structural low) → 0.06554 (EMA7) Resistance: 0.11695 (Today's high) → 0.12116 (Macro high) Invalidation and risk note The bullish structure is severely damaged if price closes below the 0.0815 level, as it would confirm the massive upper wick was a blow-off top. The risk here is the extreme volatility; use tight stops as daily swings are currently exceeding 10%. #CAPUSDT #ByXIMPACT
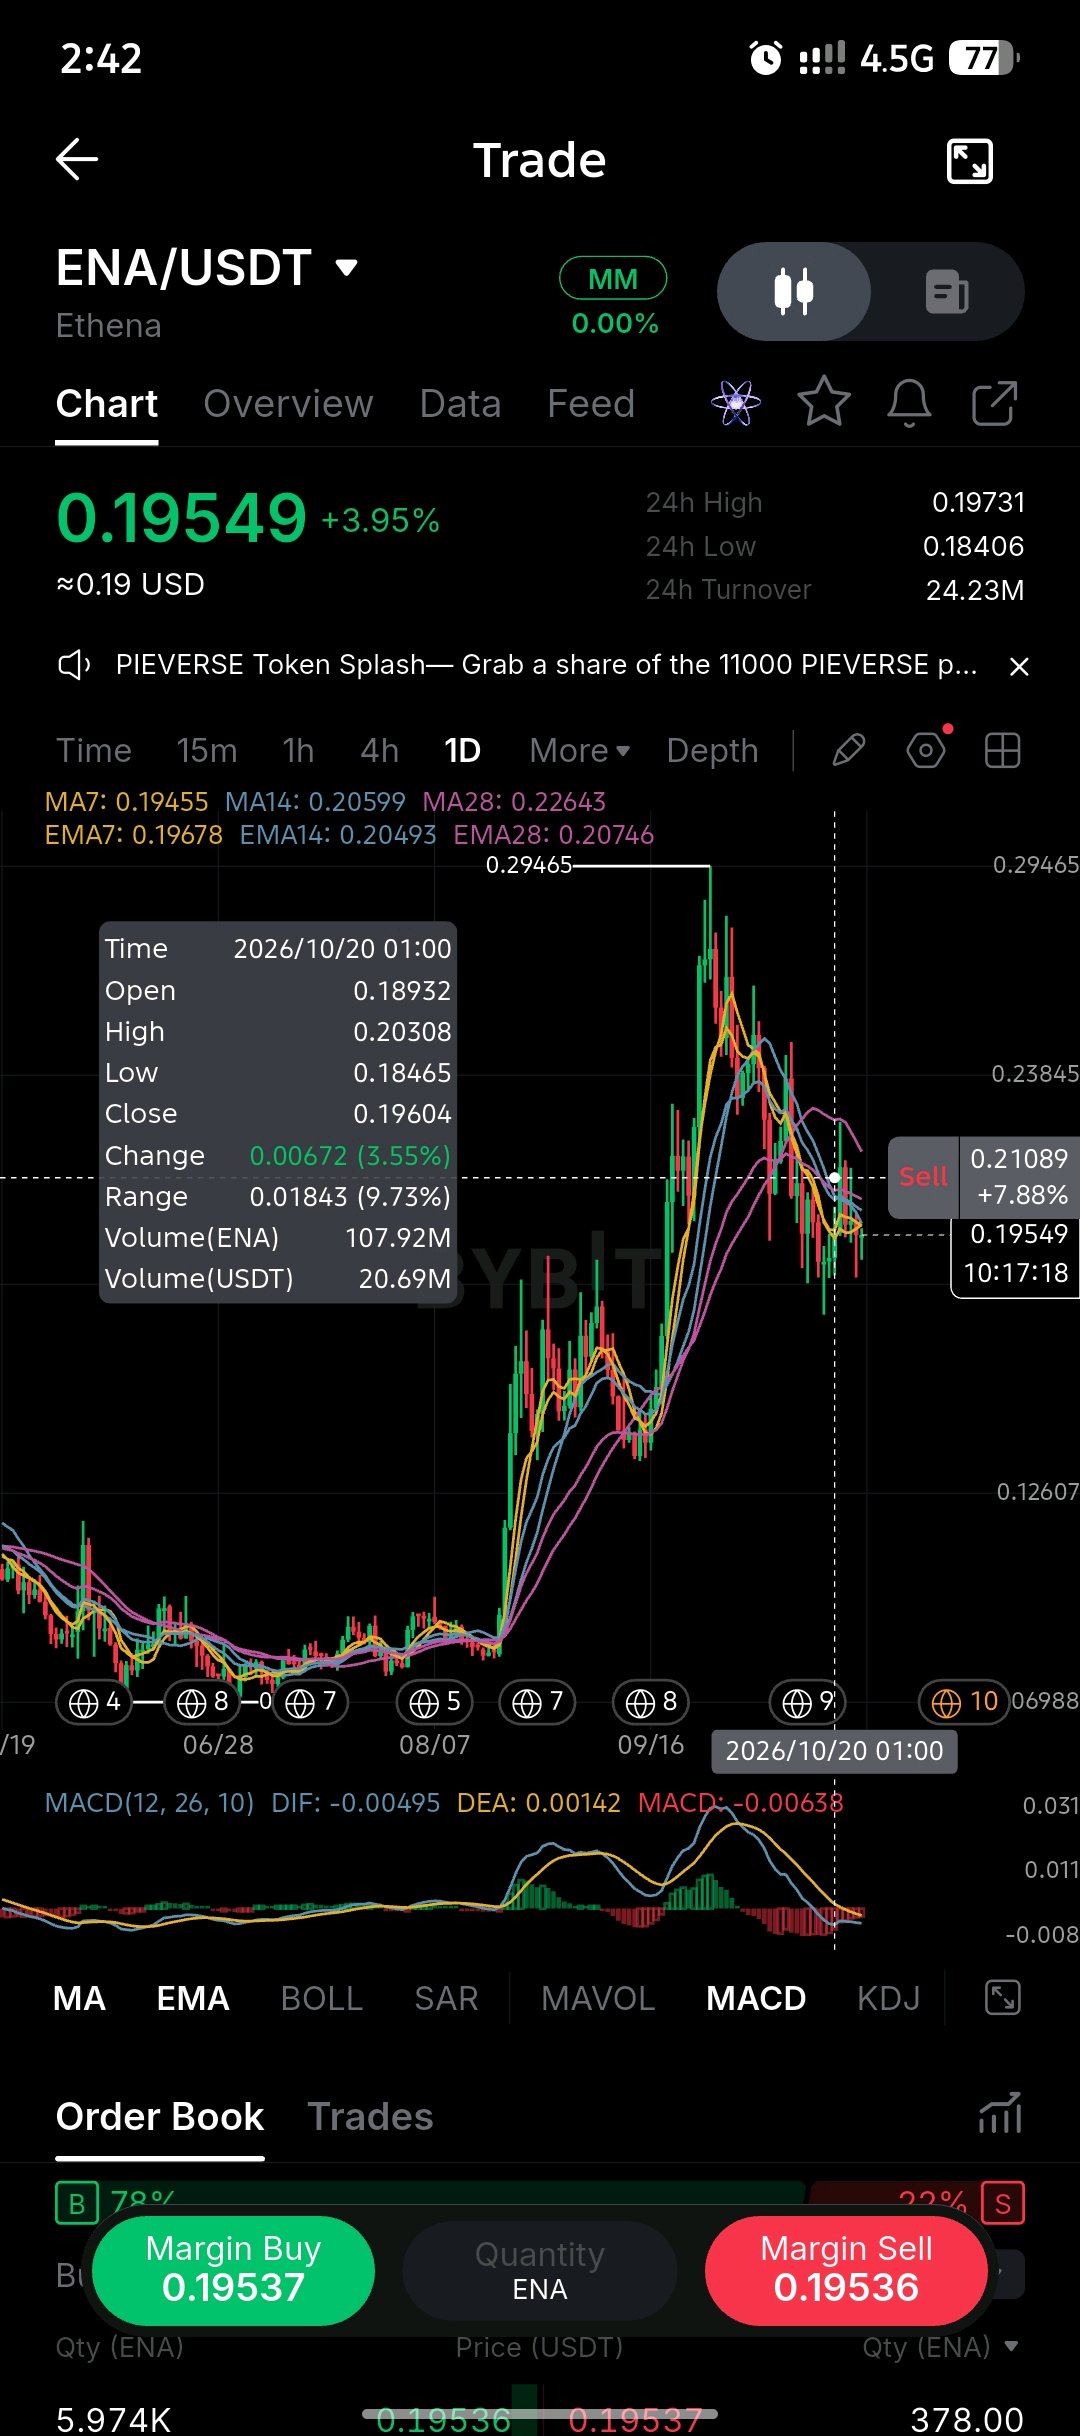
$ENAUSDT is staging a relief bounce after a sharp correction, but remains capped by overhead moving average resistance. Price sits at 0.19549, up 3.95%, attempting to halt a steep multi-week retracement from the 0.29465 high. While the current daily candle is green, price is still trading firmly below the majority of the moving average stack, keeping the broader downtrend intact. Turnover 24h turnover is 24.23M, maintaining elevated activity. This shows the market is actively defending this lower zone rather than drifting quietly, though it lacks the aggressive volume spike needed to confirm a true trend reversal. Volume Volume is steady but unremarkable. Buyers are stepping in to stop the bleeding, but without a significant surge in buy-side volume to absorb overhead supply, the current move looks more like a relief bounce than a structural shift. Moving Averages MA7: 0.19455 | MA14: 0.20599 | MA28: 0.22643 EMA7: 0.19678 | EMA14: 0.20493 | EMA28: 0.20746 The structure remains bearish. Price is squeezed just above the short-term MA7/EMA7, but the longer averages are sloping downward and forming a heavy resistance stack above. The EMA7 (0.19678) is the immediate hurdle. Levels to watch · 0.29465 — Macro swing high and major ceiling. · 0.22643 — MA28, heavy overhead resistance. · 0.20746 — EMA28, part of the immediate resistance cluster. · 0.19678 — EMA7, the first hurdle to clear for short-term momentum. · 0.19549 — Current price. · 0.18406 — Today's low and immediate structural support. Consideration The MACD remains deeply negative below the signal line, with red histogram bars still printing. Momentum is still downward despite today's bounce. The relief rally is exactly that—a bounce—until price proves it has the strength to push through the 0.205 zone. Trade plan · Base-building path: A daily close above the EMA7 (0.19678) and a push through 0.205 would be the first genuine sign of a local bottom, opening a test of 0.226. · Breakdown path: A close below 0.18406 confirms the bounce failed, opening the path for further capitulation. · Until the MACD crosses bullish and price reclaims 0.205, trade defensively. Support and resistance Support: 0.18406 (Today's low) → 0.12607 (Distant historical support) Resistance: 0.19678 (EMA7) → 0.20493–0.20599 (EMA14/MA14 cluster) → 0.22643 (MA28) Invalidation and risk note The recovery attempt is invalidated if price loses 0.18406 on a daily close. Watch price behavior exactly at the EMA7 and MA14; if the market stalls there, it is likely preparing for another leg down. #ENAUSDT #ByXIMPACT
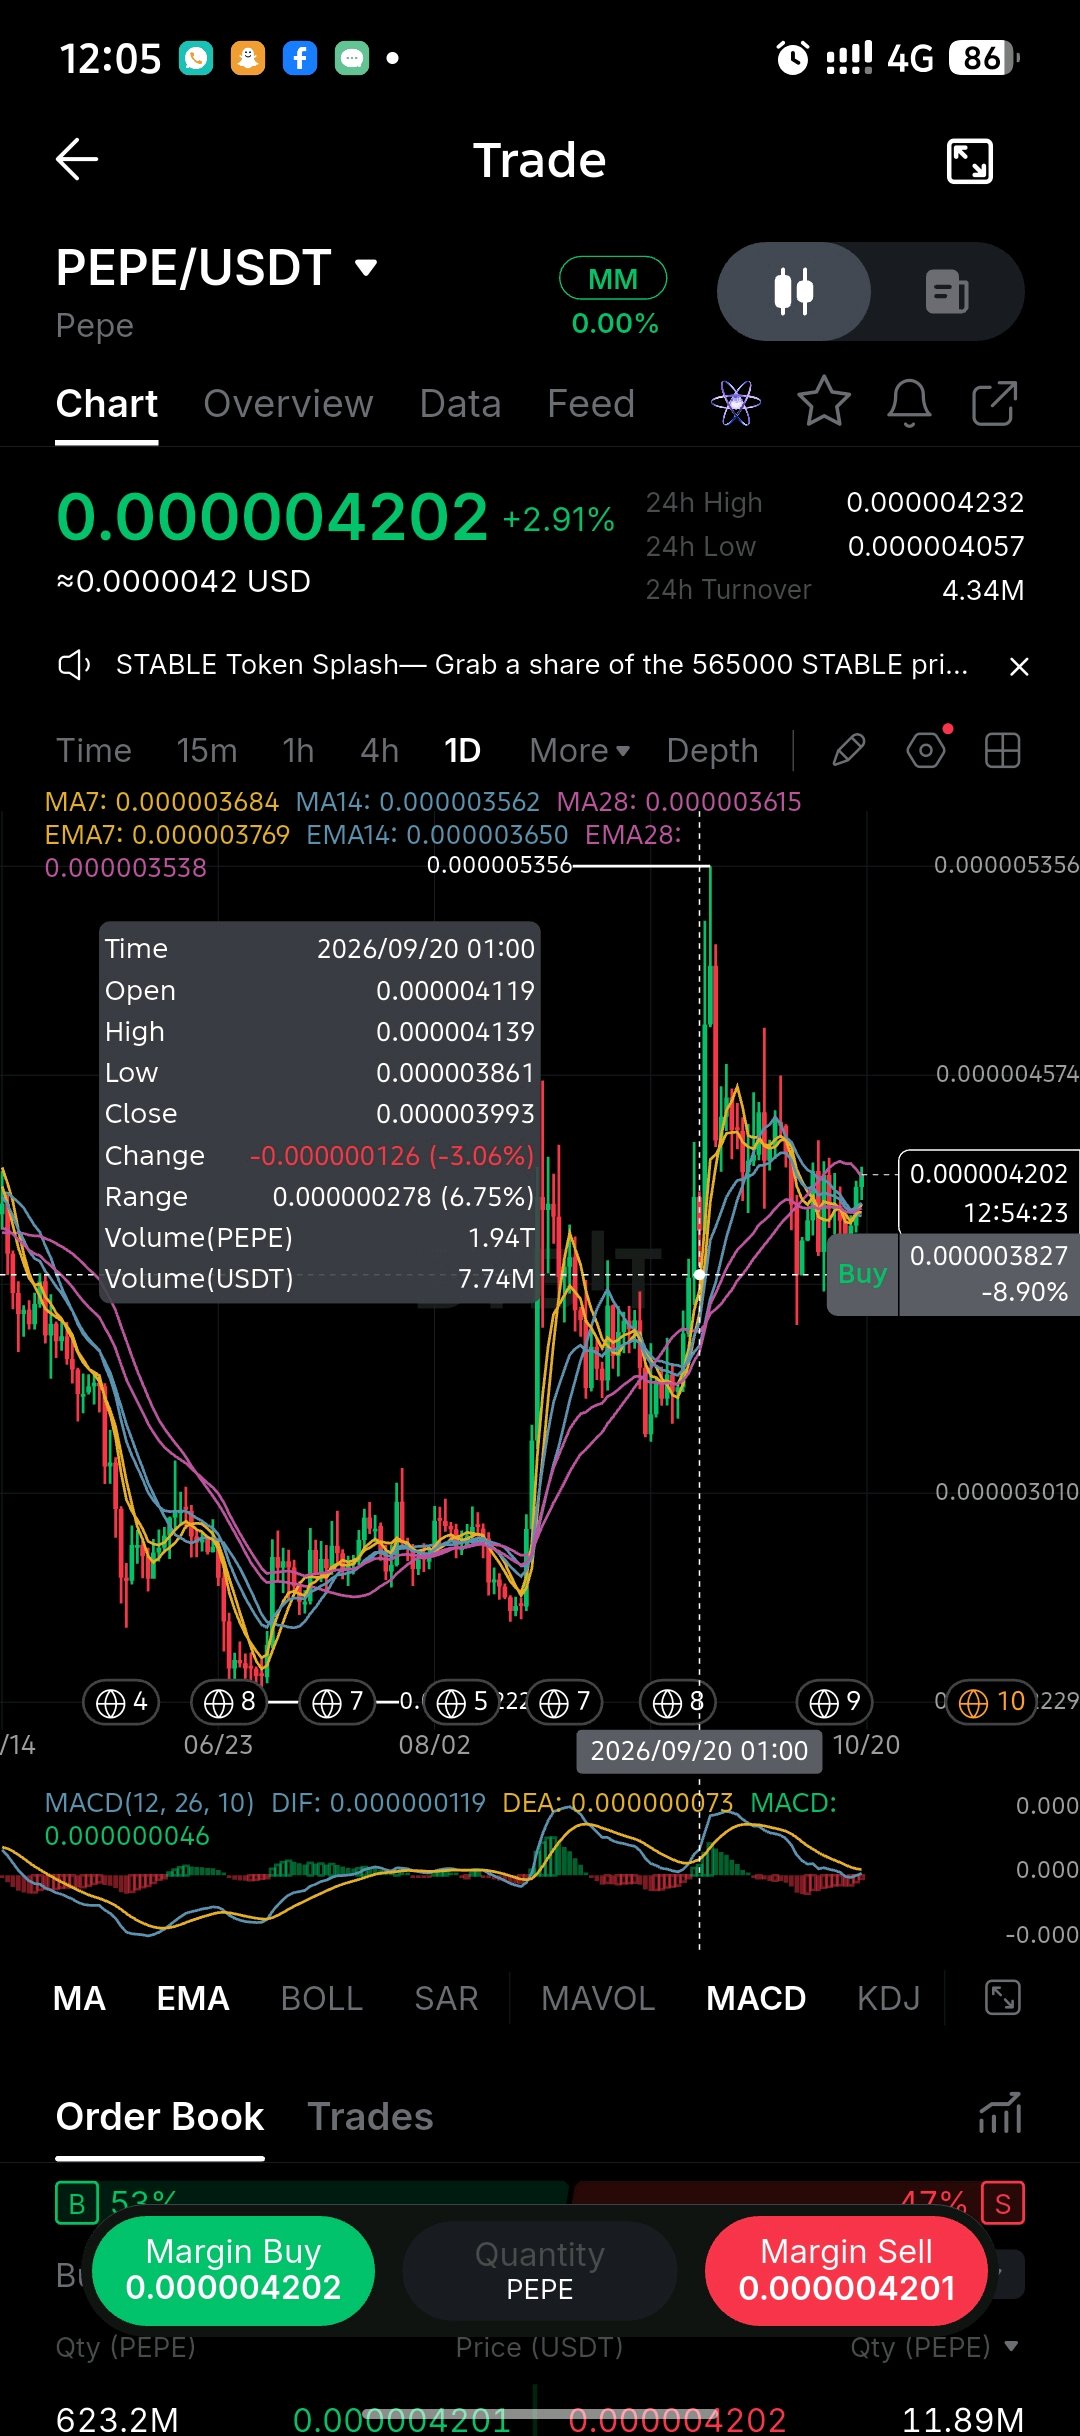
$PEPEUSDT $PEPEUSDT is testing a critical structural pivot after a sharp rejection from recent highs. Price sits at 0.000004202, up 2.91% on the day, currently attempting to stabilize following a volatile swing. The daily chart shows a massive impulsive move that topped out at 0.000005356, followed by a heavy retracement. The current candle is printing a mild bounce, but price remains tightly wound within the moving average cluster. Turnover 24h turnover is 4.34M. This elevated activity level fits with a market that is actively defending a key support zone. Traders are engaged here; the high turnover relative to the tight price range suggests a battleground where buyers and sellers are fighting for control of the current trend direction. Volume The highlighted tooltip from the 09/20 session shows a volume spike of 1.94T PEPE (7.74M USDT) during a sharp down day. Compare that to the current price action: volume has contracted significantly as price consolidates. This is a classic post-volatility cooldown. The lack of heavy sell volume right now suggests the immediate panic from the pullback has subsided, but it also means buyers lack the aggressive conviction needed to immediately reclaim the highs. Moving Averages MA7: 0.000003684 | MA14: 0.000003562 | MA28: 0.000003615 EMA7: 0.000003769 | EMA14: 0.000003650 | EMA28: 0.000003538 The moving average structure is currently tangled, signaling a loss of clear short-term trend momentum. After the massive run-up, the averages are converging. Crucially, price (0.000004202) is sitting well above all displayed moving averages, but the EMA7 (0.000003769) is beginning to curl downward. This compression indicates the market is coiling and preparing for its next expansion phase. Levels to watch · 0.000005356 — The recent swing high. The major ceiling that needs reclaiming to resume the macro uptrend. · 0.000004574 — Local resistance from the recent lower high. · 0.000004232 — Today's high and the immediate ceiling to break for short-term bullish continuation. · 0.000004202 — Current price. · 0.000003827 — The visible order book "Buy" wall/structural support level. · 0.000003769 — EMA7, the first dynamic support below current price. Consideration The chart is currently in a "wait and see" mode. PEPE had its explosive move and is now digesting those gains. The real tell will be how the daily candle closes. Holding above the 0.0000040 psychological level keeps the bulls in the game, but the MACD (DIF 0.000000119, DEA 0.000000073) is starting to flatten out, suggesting the aggressive upside momentum is cooling. Trade plan · Bullish Continuation: A strong daily close above 0.000004232, backed by a return in volume, would signal that the consolidation is over and the market is ready to challenge the 0.000004574 level again. · Range Play: Fading the extremes is the current environment. Buying the lower moving average cluster (0.0000037-0.0000038 area) on dips and taking profit near the 0.0000045 local resistance. · Breakdown Risk: A daily close below the EMA7 and the 0.0000038 order book support would indicate weakening structure, opening the door for a deeper retracement toward the 0.0000035 MA28 level. Support and resistance Support: 0.000003827 (Visible order book bid) → 0.000003769 (EMA7) → 0.000003615 (MA28) Resistance: 0.000004232 (Today's high) → 0.000004574 (Local swing high) → 0.000005356 (Major structural high) Invalidation and risk note The bullish thesis is invalidated if price closes decisively below the EMA28 near 0.000003538. Until the MACD prints a fresh bullish crossover and price clears 0.000004232, the market is ranging. Watch the volume closely; without a spike in buying pressure, the recent 2.91% bounce is just noise within a larger consolidation. #BybitAIBestReplies #ByXIMPACT
$TSLAXUSDT is retreating from recent highs and testing a critical moving average cluster. Price sits at 350.20, down 0.74% for the session, after a period of volatility that saw it peak dramatically before pulling back. The daily chart shows price has slipped below the shorter-term moving averages, currently finding itself squeezed right into the longer-term MA/EMA support zone. Turnover 24h turnover is 269.73K. Without a direct prior-session comparison visible on the chart, this turnover level suggests moderate activity. It is enough to keep the market moving, but not indicative of a massive capitulation or breakout at this exact moment, fitting for a market currently pausing to decide its next move at a key technical juncture. Volume The current volume profile is notably subdued compared to the heavy activity seen during the massive July rally and subsequent recovery. The most recent candles are printing lower volume bars relative to the moving average baseline. This drying up of volume during the current pullback suggests a lack of aggressive selling pressure, but it also means buyers aren't stepping in with conviction just yet. Moving Averages MA7: 361.91 | MA14: 362.25 | MA28: 358.92 EMA7: 363.11 | EMA14: 361.77 | EMA28: 358.45 The structure shows a short-term bearish tilt. Price (350.20) is currently trading below the MA7, MA14, EMA7, and EMA14. Crucially, it is sitting directly on top of the longer-term averages: MA28 (358.92) and EMA28 (358.45). The shorter averages are beginning to roll over and cross below the longer ones, indicating that the immediate upward momentum has stalled. Levels to watch · 365.42 — Recent local high (from the highlighted tooltip), showing where the last leg up failed. · 363.11 — EMA7, the first line of resistance that needs to be reclaimed to shift short-term momentum. · 358.45–358.92 — MA28/EMA28 cluster, the immediate support shelf currently being tested. · 350.20 — Current price. · 333.87 — Previous structural support visible on the chart, the next major downside target if the current shelf breaks. Consideration The daily chart tells a story of a massive recovery followed by a current cooldown. The real tell here is the MA28/EMA28 cluster around 358.5. If this level holds on a daily close, it validates it as strong support and the pullback is just a healthy retracement. If price closes decisively below it, the structure shifts, and the market will likely look to retest the lower 330s. Trade plan · Base-building path: A daily close that holds above 358.5, followed by a volume-backed push back through the EMA7 near 363, would indicate the pullback is over and the broader uptrend is resuming. · Breakdown path: A close below the 358 support cluster, especially accompanied by an uptick in volume, would open the door for a deeper correction toward the 333.87 level. · Until the EMA7/MA7 cluster is reclaimed, this is a market balancing on a ledge; trade cautiously rather than committing heavily to a direction. Support and resistance Support: 358.45–358.92 (MA28/EMA28 cluster) → 350.20 (current price) → 333.87 (structural support) Resistance: 363.11 (EMA7) → 365.42 (recent local high) → 379.89 (visible order book resistance/previous structural zone) Invalidation and risk note The short-term trend is weakening below the 363 EMA7 level. A failure to hold the 358 MA28/EMA28 cluster would be a significant bearish signal, confirming that the recent upward momentum is entirely exhausted. Watch how price behaves specifically at 358.5; that is the immediate line between "healthy pullback" and "deeper correction." $TSLAXUSDT #TSLAtooktothemoon #ByXIMPACT

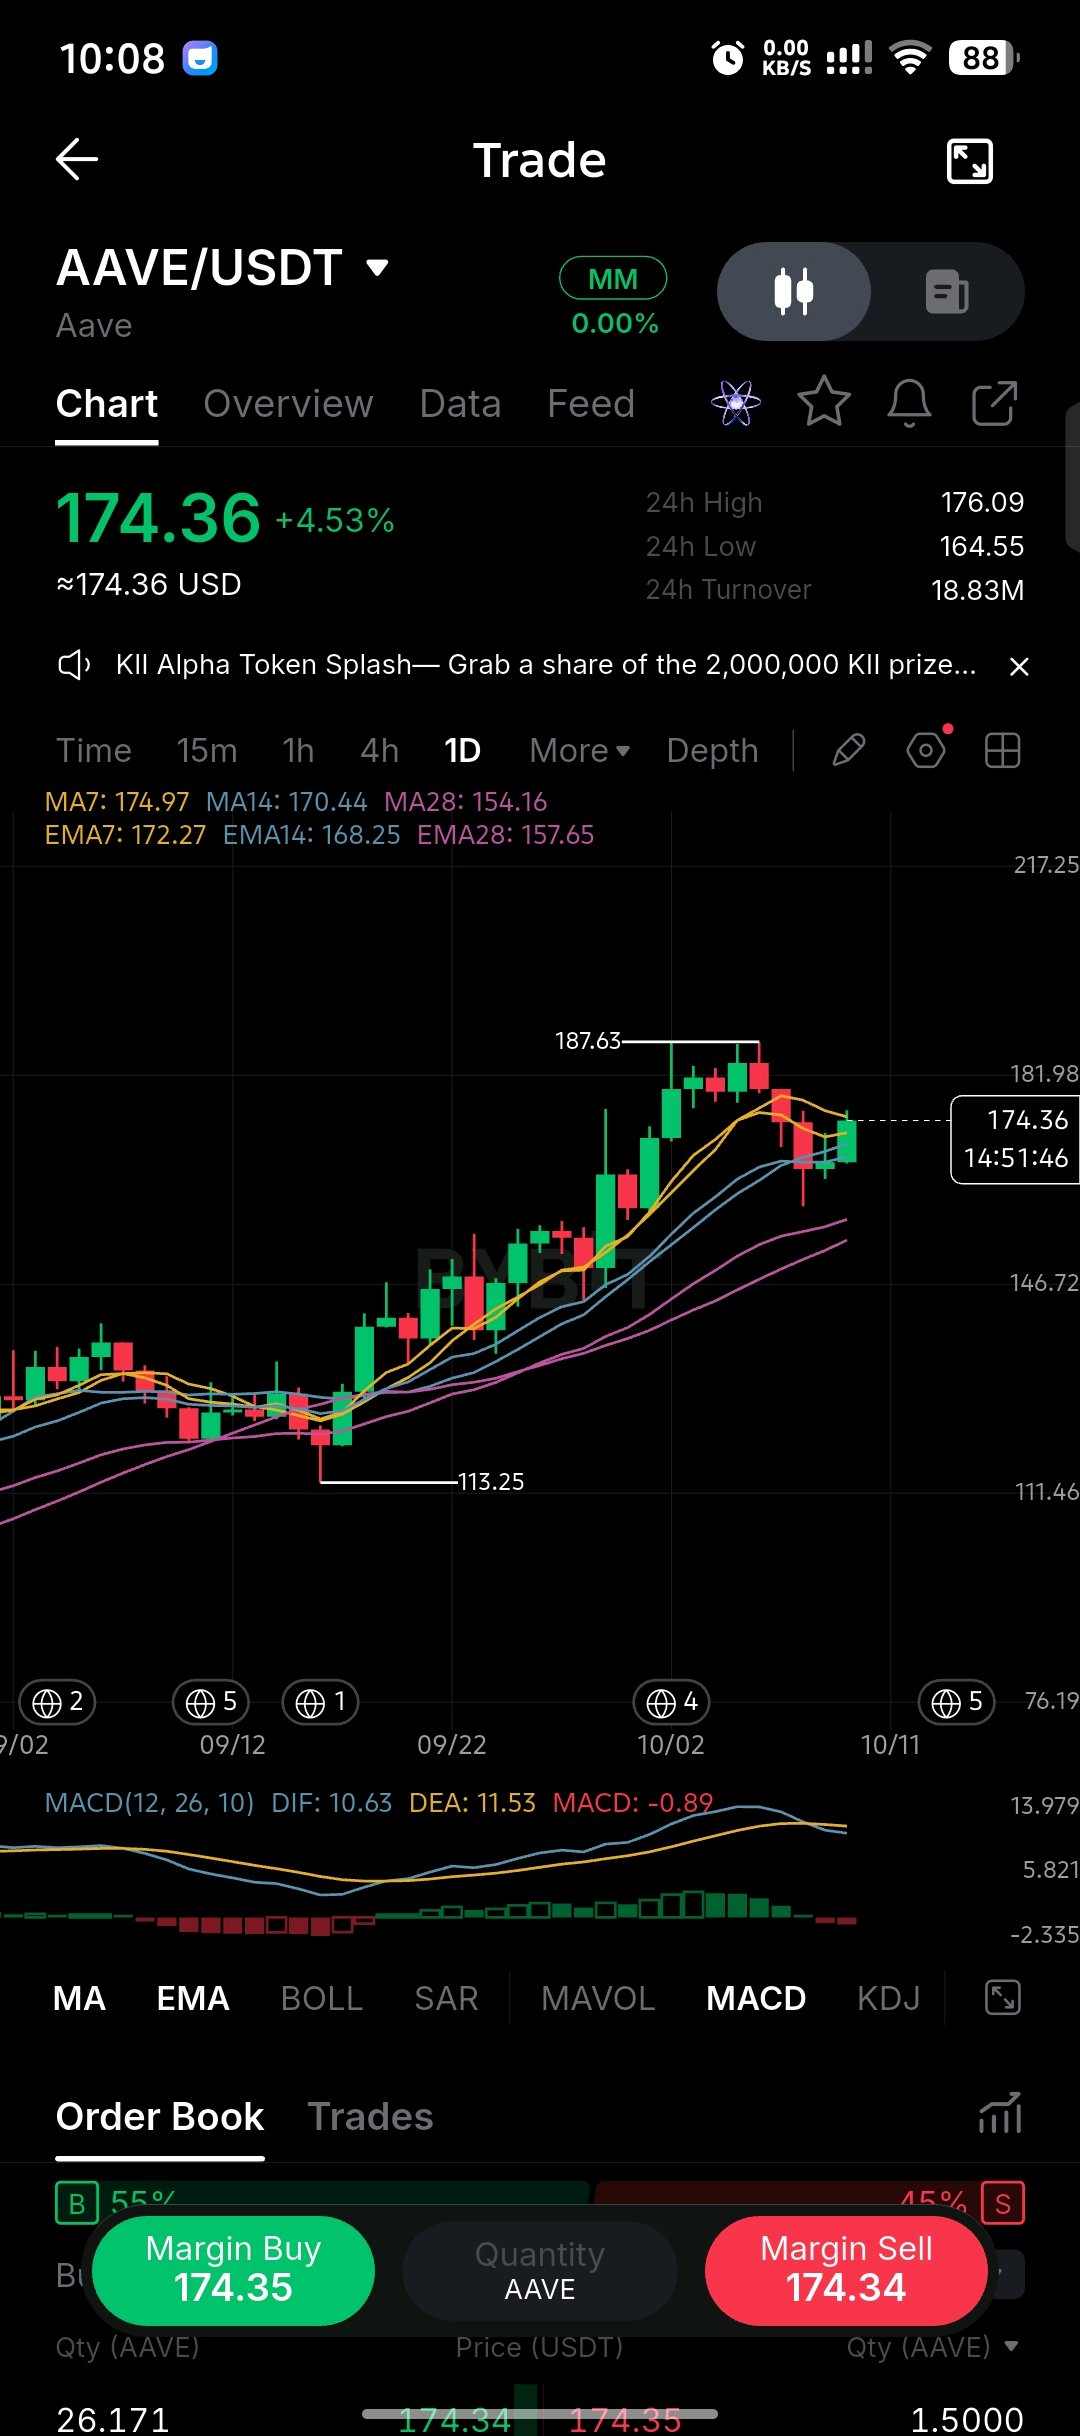
$AAVEUSDT bounced from the 164.55 low and is trading at 174.36 #ByXIMPACT , up 4.53% on the session. 24h turnover sits at 18.83M after the recent pullback from the 187.63 high. Context: AAVE has been in a sustained uptrend since the September base. Price pushed into the high 180s, corrected back toward the short-term averages, and is now attempting to stabilize around the MA7. The broader structure of higher highs and higher lows remains intact, but short-term momentum has cooled. Turnover at 18.83M is moderate. Participation is present but not at the peak levels seen during the strongest expansion sessions. Volume supported the bounce off 164.55, though it has not yet expanded enough to signal a full resumption of the prior leg. The MA structure remains bullish:** - MA7: 174.97 (price sitting just below) - MA14: 170.44 - MA28: 154.16 - EMA7: 172.27 - EMA14: 168.25 - EMA28: 157.65 Price is compressed against the MA7/EMA7 cluster. The wider averages are still rising and correctly ordered. MACD: DIF 10.63, DEA 11.53, histogram -0.89. Momentum has crossed slightly negative. This is the first clear cooling signal after the push into the 180s. Support and Resistance: - Resistance: 176.09 (24h high) is the immediate ceiling. Above that the next supply sits near 181–187.63. - Support: 172.27–170.44 (EMA7/MA14) is the first dynamic floor. Below that 164.55 (24h low) and the deeper 157–154 zone. Level to watch: 172.27–174.97. Holding this band keeps the short-term structure intact. A daily close below 170.44 would open a deeper test of the 164–157 area. Consideration: The higher-timeframe trend is still up and the averages remain supportive. However, the mild MACD cross means the path of least resistance in the near term is sideways until the short-term averages are reclaimed with conviction. Chasing the current bounce offers average risk/reward. Trade plan: Two clean setups: 1. Hold of the 172.27–174.97 (EMA7/MA7) zone with declining sell volume → long toward 176–187, stop below 168. 2. Daily close below 170.44 → short toward 164.55 then 157, stop above 176.50. Invalidation and risk note: A daily close above 176.09 with volume expansion would re-accelerate the trend. A daily close below 170.44 breaks the short-term structure and brings the 164–157 zone into play. Main risk is the early momentum loss percentage moves can develop quickly once the short-term averages give way. Prefer confirmation over anticipation. Not a call a structural update. $AAVEUSDT #ByXIMPACT
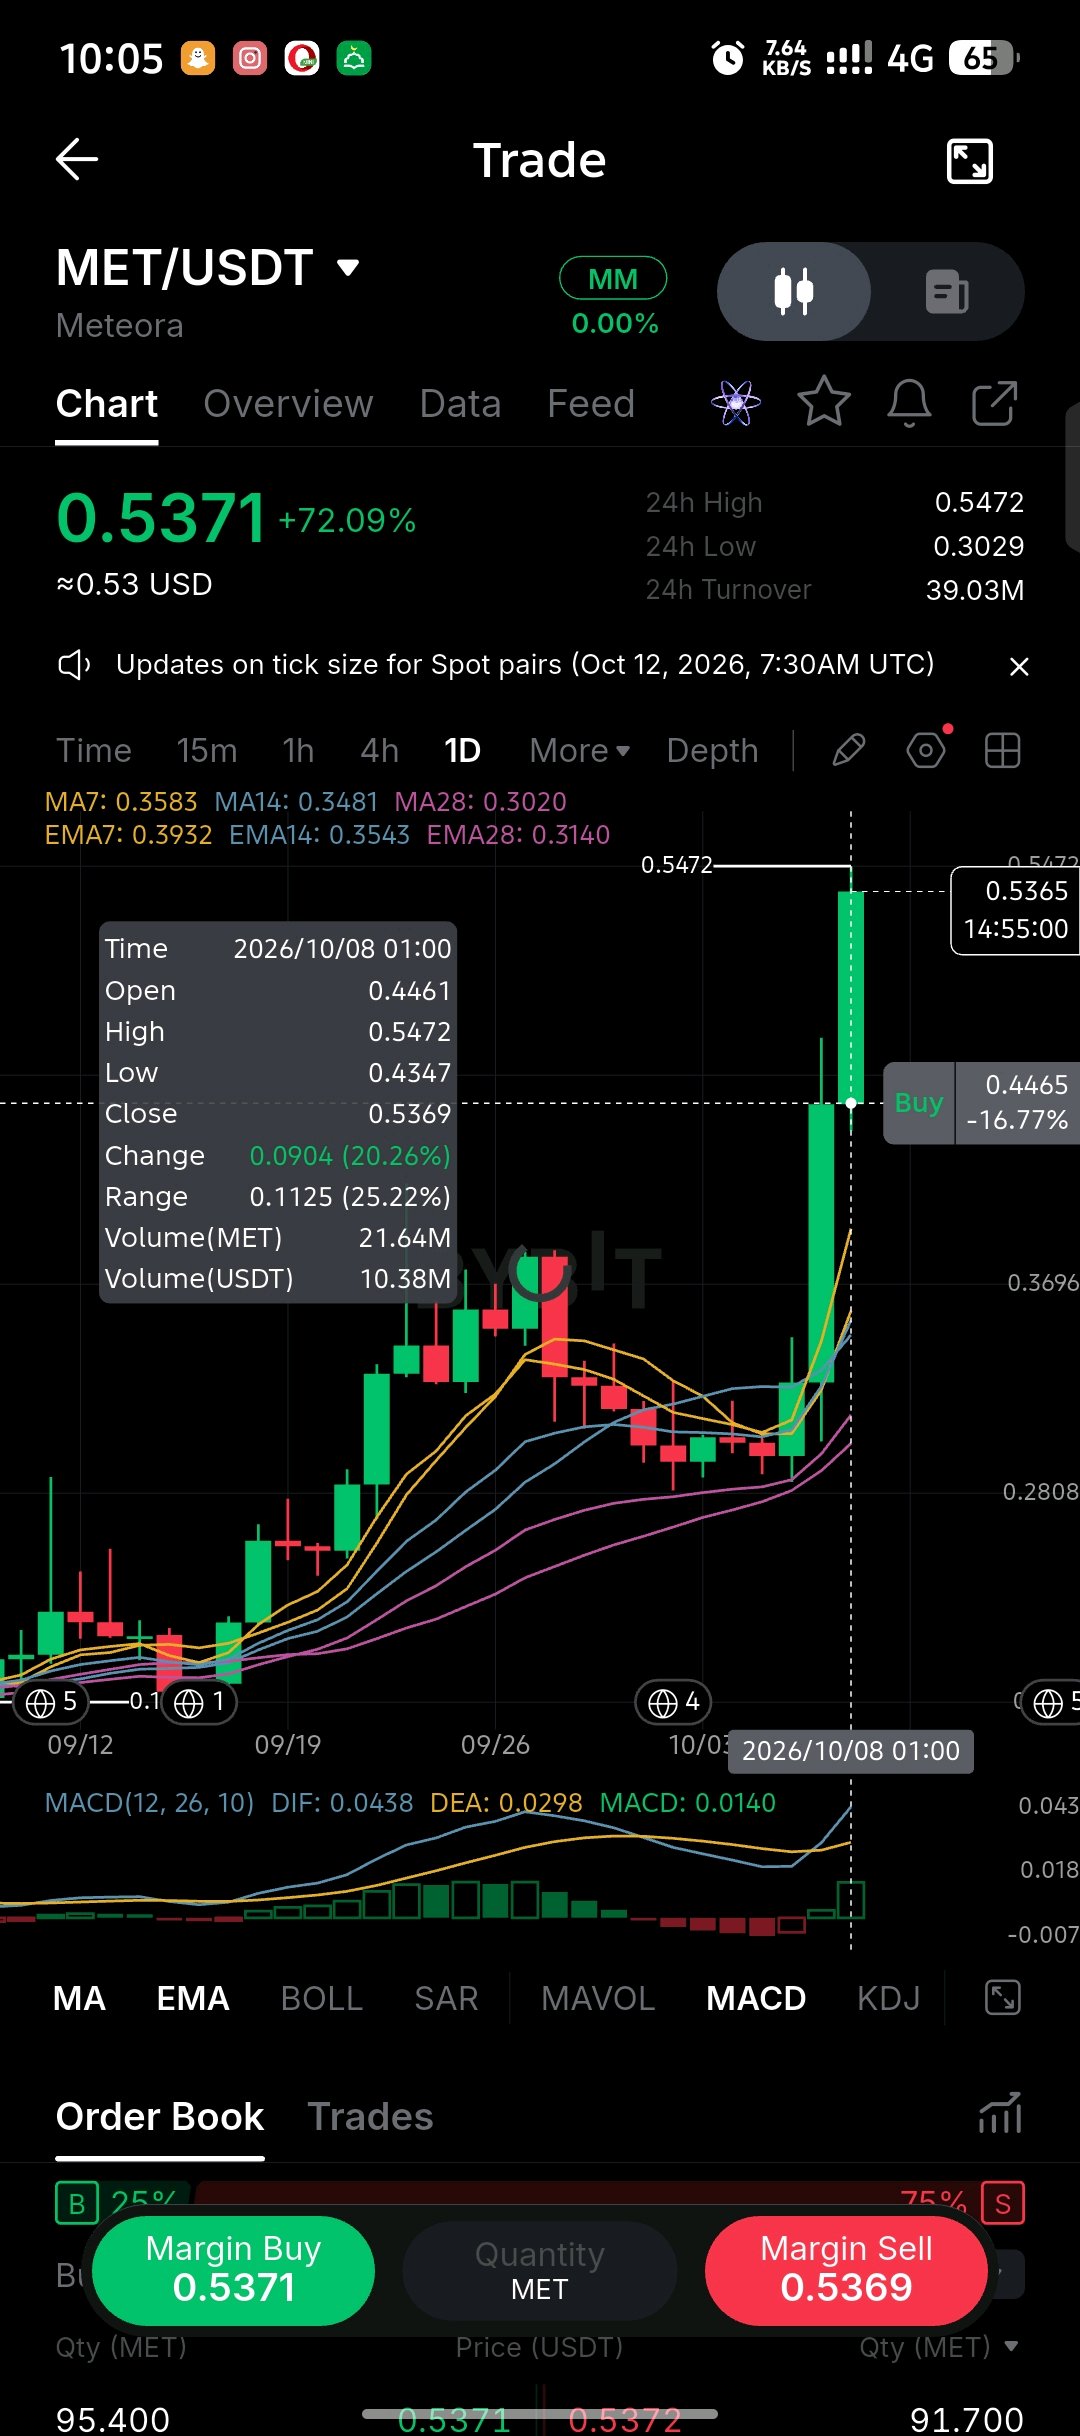
$METUSDT just printed a vertical expansion and is trading at 0.5371, up 72.09% on the day. 24h range runs from 0.3029 to 0.5472 with turnover of 39.03M. Context: MET broke out of a multi-week base and delivered one of the cleanest expansion candles on the board today. The daily opened at 0.4461, ran to 0.5472, and closed near the highs at 0.5369 — a 20%+ body with real volume behind it. This is not a thin wick. This is a momentum event. Turnoverat 39.03M is strong. The move higher was accompanied by genuine participation rather than low-liquidity noise. Volume on the breakout candle printed 21.64M MET (~10.38M USDT). That is meaningful expansion relative to the preceding base and confirms the breakout had real size behind it. **The MA structure is fully bullish and now widely stretched:** - MA7: 0.3583 - MA14: 0.3481 - MA28: 0.3020 - EMA7: 0.3932 - EMA14: 0.3543 - EMA28: 0.3140 Price at 0.5371 is sitting roughly 37–78% above the short-term averages. The stack is rising and correctly ordered the signature of a strong trend but the gap is extreme after a single session. **MACD:** DIF 0.0438, DEA 0.0298, histogram 0.0140. Momentum is positive and still expanding. No roll-over signal has appeared yet. Support and Resistance: - Resistance: 0.5472 (24h and session high) is the immediate ceiling. Above that the chart is in price discovery. - Support: 0.4347–0.4460 (today’s low / open area) is the first crack zone. Below that the rising EMA7 at 0.3932 and MA7 at 0.3583 form the first real dynamic floor. Level to watch: 0.4347–0.4460. Holding this band on any pullback keeps the breakout structure intact. A daily close below it would be the first sign the expansion is losing control and would open a deeper retest of the 0.39–0.35 average cluster. Consideration: The breakout is real, volume confirmed it, and the higher-timeframe structure has shifted bullish. However, a 70%+ day leaves the chart extended, and the order book is currently 75% ask-side. That combination makes chasing the current print unattractive. The highest-quality entry on a move of this size is almost always the first proper retest of the rising short-term averages, not the middle of the vertical candle. Trade plan: I’m not chasing the 72% candle. Two clean setups: 1. Pullback into the 0.393–0.358 (EMA7/MA7) zone that holds with declining sell volume → long toward 0.547–0.60, stop below 0.314. 2. Daily close above 0.5472 with volume expansion → continuation long, tight stop under 0.480. Invalidation and risk note: A daily close below 0.3583 (MA7) breaks the short-term momentum structure and opens 0.35–0.30. A daily close below 0.3020 (MA28) would mark a deeper trend reset. Main risk here is the speed and size of the move vertical advances of this magnitude routinely retrace 30–50% of the daily range once profit-taking appears. Prefer the retest. Not a call a structural update. $METUSDT #ByXIMPACT
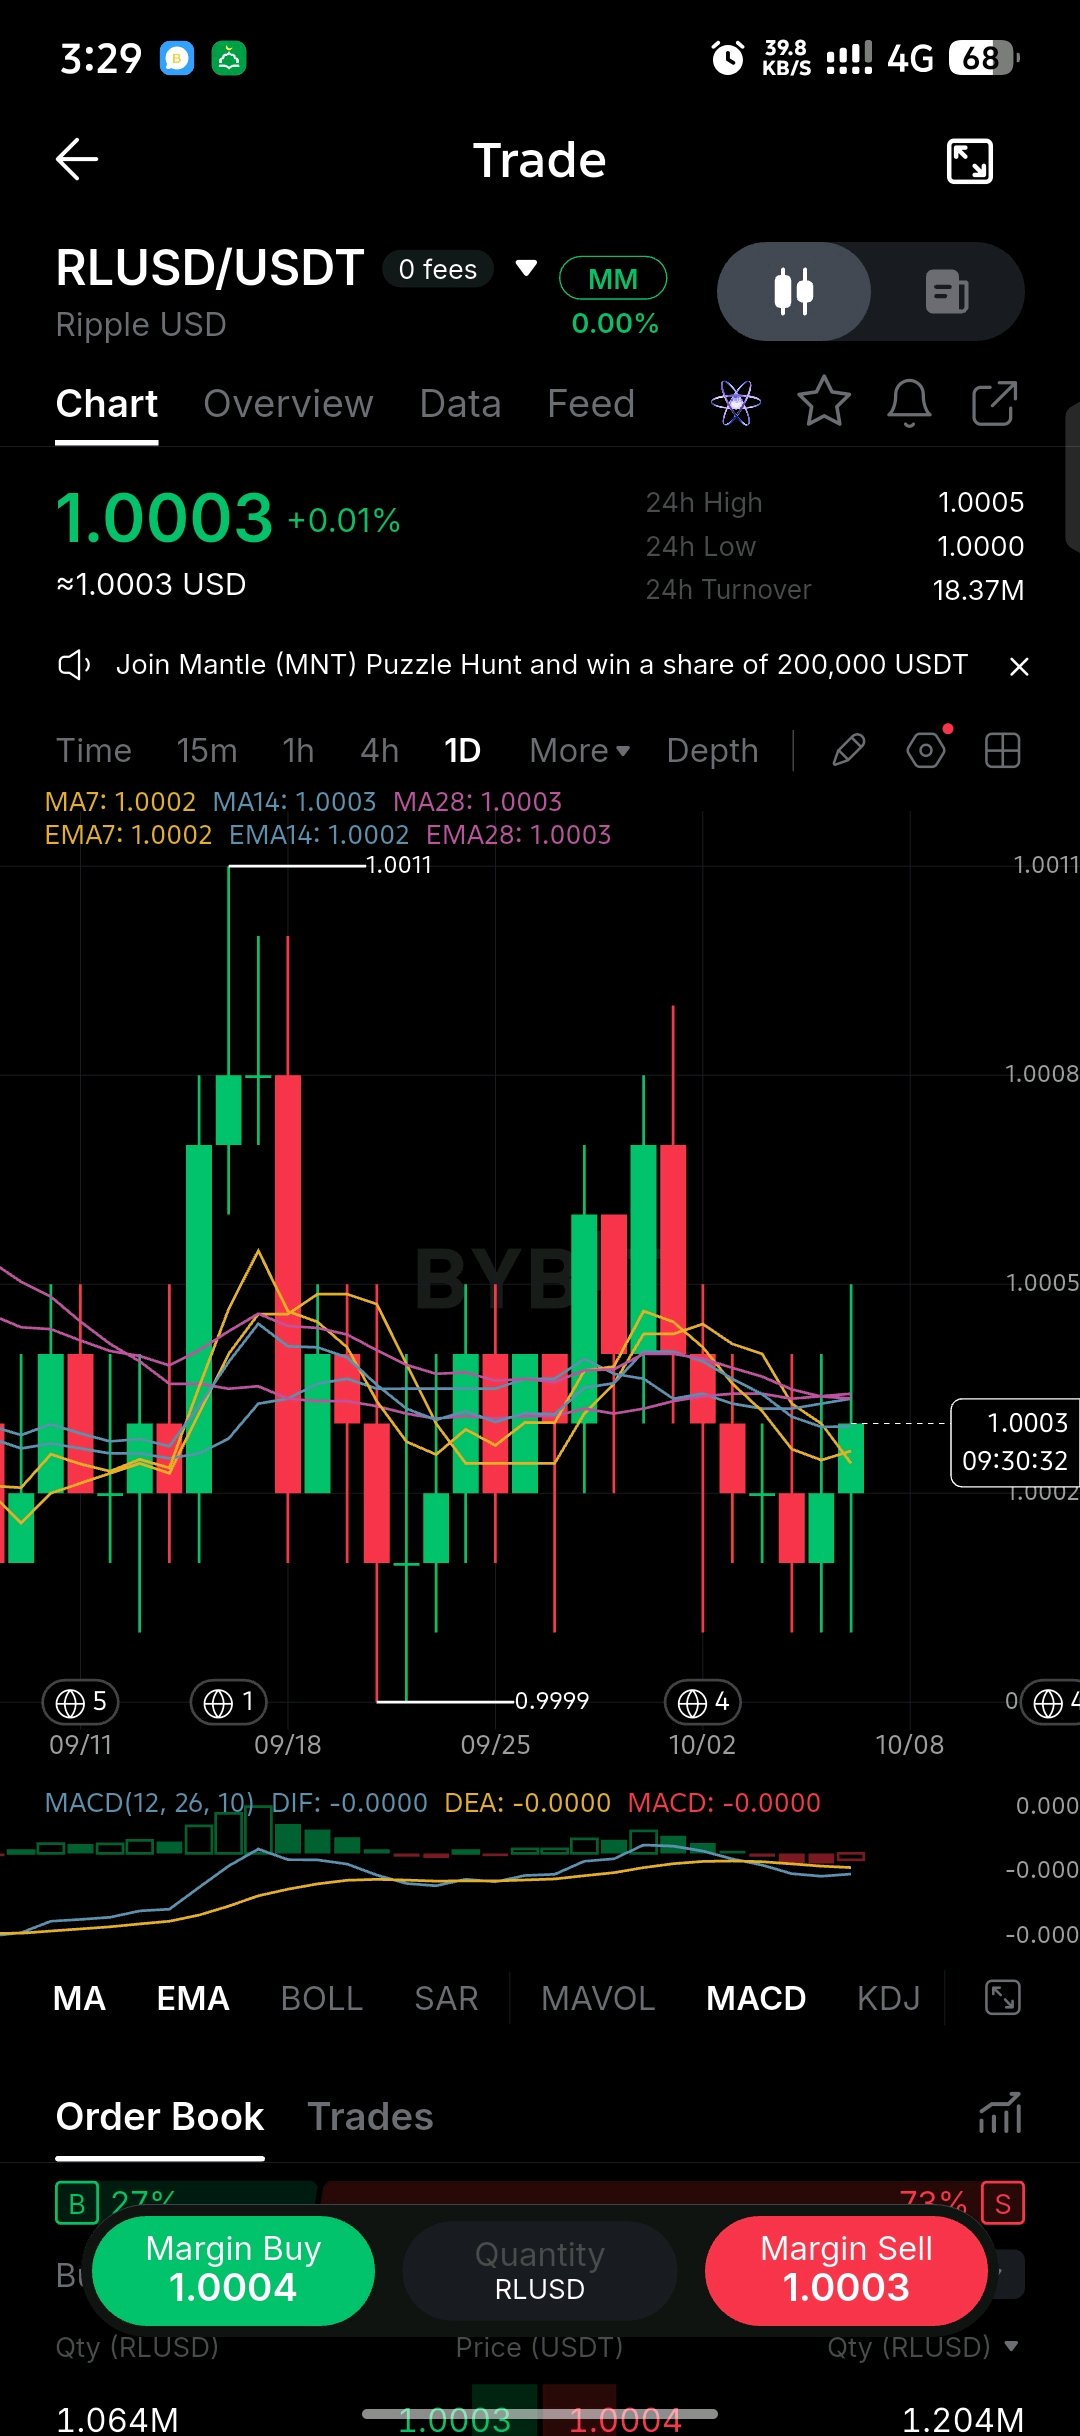
$RLUSDUSDT is holding the peg at 1.0003, up 0.01%, with 24h turnover of 18.37M. Price remains locked in a tight 1.0000–1.0005 range. Macro context: RLUSD is Ripple’s dollar-backed stablecoin. Unlike the pure technical charts we usually cover, the only thing that matters here is peg integrity and the broader regulatory backdrop for compliant stablecoins. The U.S. stablecoin conversation has shifted meaningfully over the past year. Clarity around reserves, attestations, and banking relationships has become the real differentiator. RLUSD sits in the “regulated / institutional” bucket alongside USDC, rather than the more offshore-heavy USDT complex. That positioning is intentional. On the chart the peg is clean. There has been no meaningful depeg pressure, no sustained trading below 1.0000, and turnover remains healthy for a relatively new dollar stablecoin. The moving averages are completely flat and stacked on top of each other exactly what a functioning peg should look like. Order bookis currently 73% ask-side, which is common on stablecoin pairs and does not by itself signal stress. What actually matters from here: - Any sustained break and hold below 1.0000 on rising volume would be the first real warning. - Continued two-way flow above 1.0000 with steady turnover keeps the peg healthy. - Macro catalysts that could affect it: further U.S. stablecoin legislation, banking partner developments, or shifts in overall dollar stablecoin market share. This is not a directional trade. It is a monitoring chart for peg stability and regulatory positioning. Bottom line: Peg is holding. Turnover is adequate. No technical stress visible. The real risk for RLUSD (and every regulated stablecoin) remains regulatory or banking-channel news rather than price action. #ByXIMPACT$RLUSDUSDT
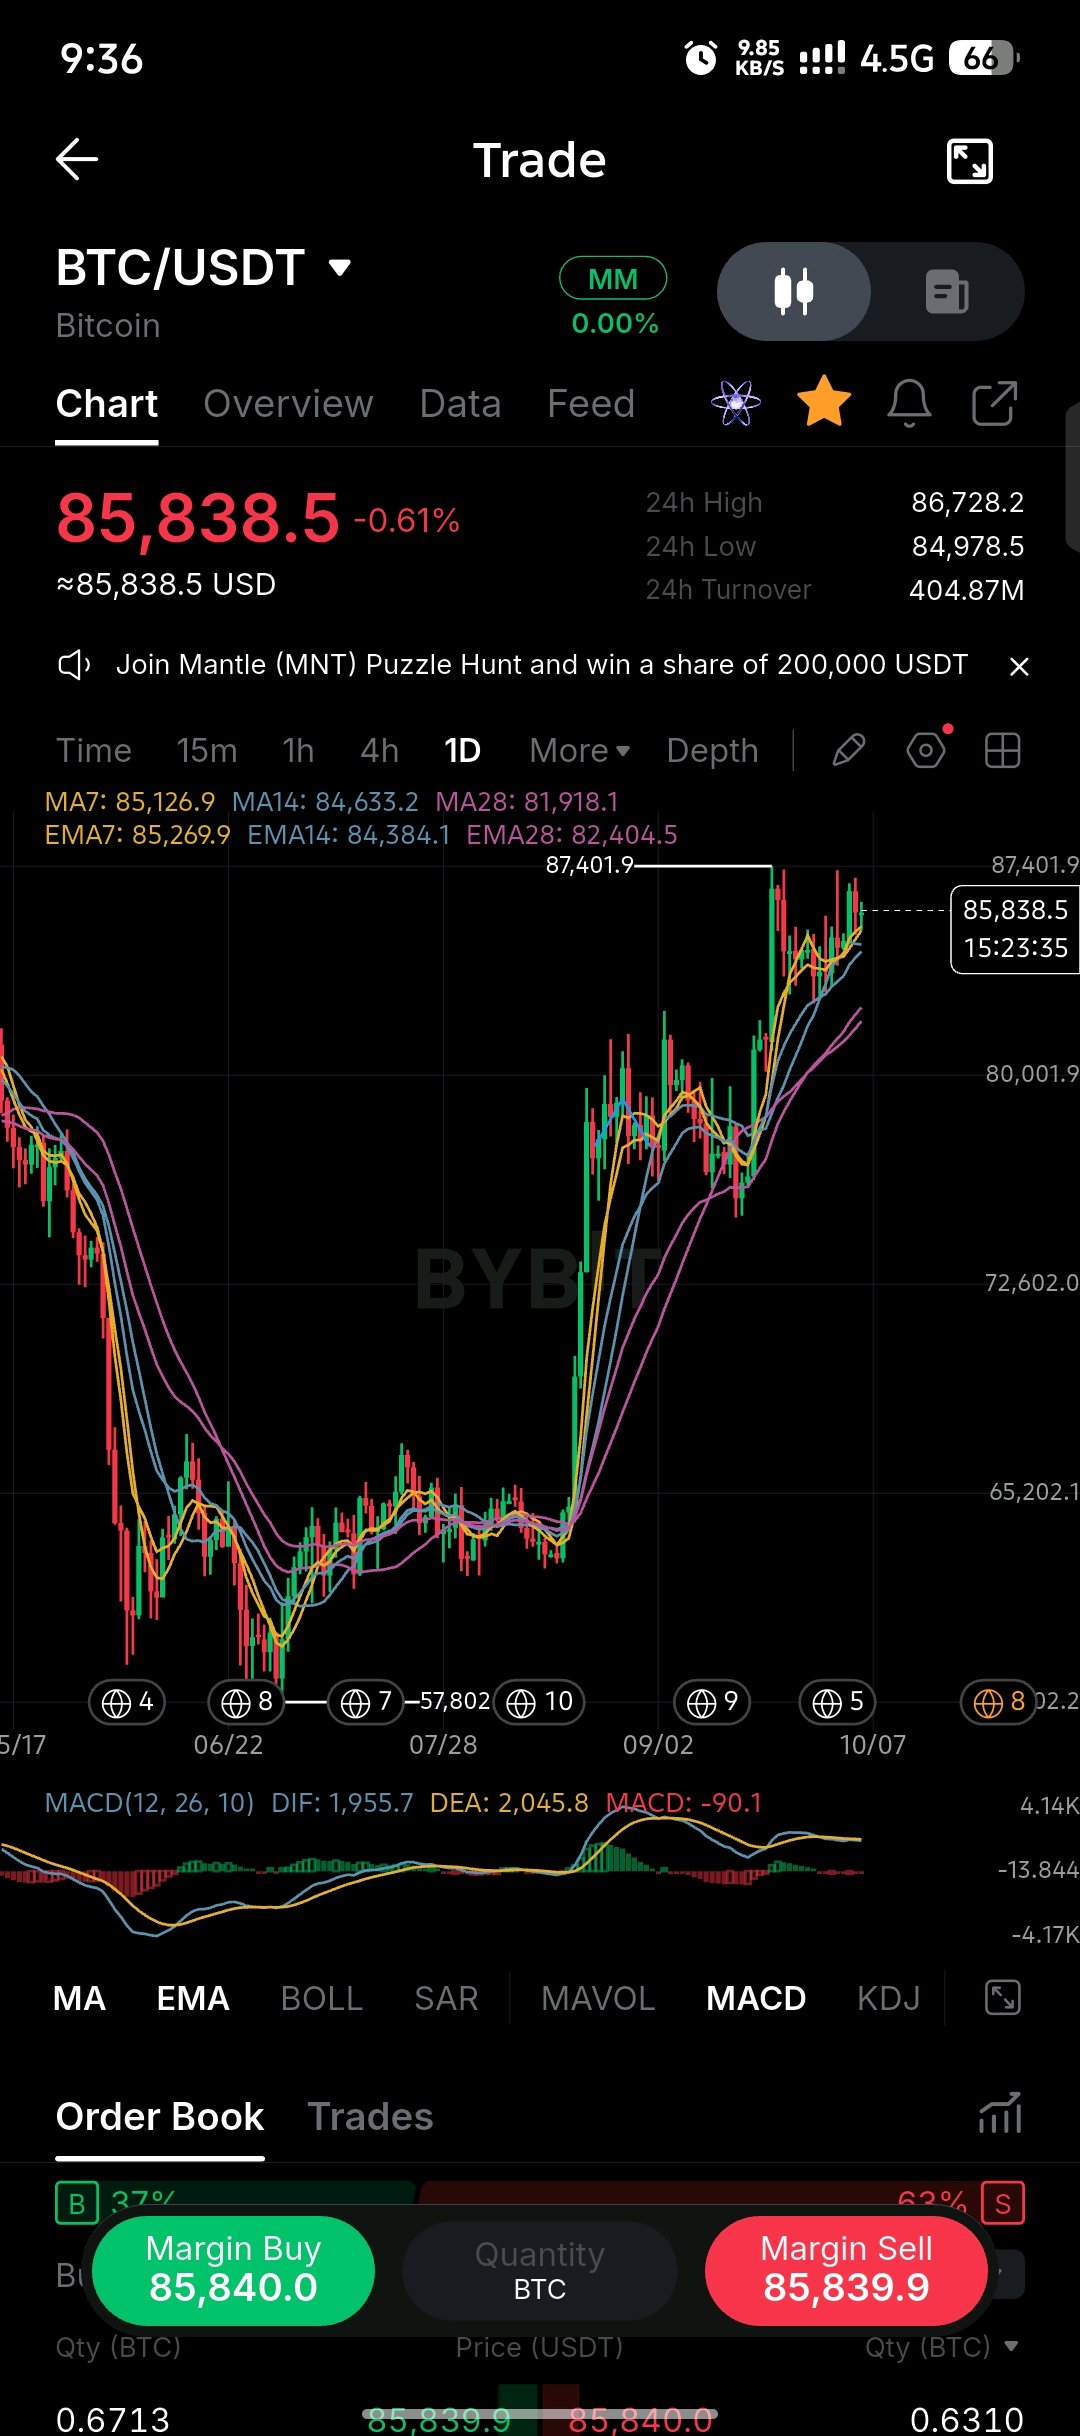
$BTCUSDT is trading at 85,838.5, down 0.61% after failing to hold the push toward 86,700. 24h turnover remains strong at 404.87M. Context: BTC has been in a sustained recovery from the mid-60k base and recently tagged the 87,401 high. Price is now pulling back and sitting just above the short-term averages. The broader structure is still higher-highs, but the immediate momentum has cooled. Turnover at 404.87M is healthy. Real size continues to trade through the range. Volume has supported the prior advance, though the latest red session shows some reduction in aggressive buying. The MA structure remains bullish but price is now testing the upper averages:** - MA7: 85,126.9 - MA14: 84,633.2 - MA28: 81,918.1 - EMA7: 85,269.9 - EMA14: 84,384.1 - EMA28: 82,404.5 Price is hovering just above the MA7/EMA7 cluster. The wider averages are still rising and correctly ordered. MACD:DIF 1,955.7, DEA 2,045.8, histogram -90.1. Momentum has crossed slightly negative. This is the first clear cooling signal after the recent push higher. Support and Resistance: - Resistance: 86,728–87,401 (24h high / prior swing high). A clean reclaim and hold above 87,400 would re-accelerate the trend. - Support: 84,978 (24h low) is the first crack line. Below that the MA14/EMA14 zone near 84,600–84,400 becomes the next demand area. Level to watch: 85,126–85,270 (MA7/EMA7). Holding this band keeps the short-term structure intact. A daily close below it would open a deeper test of the 84,600–84,400 zone. Consideration: The higher-timeframe trend is still up and turnover remains solid. However, the mild MACD cross and 63% ask-side order book mean the path of least resistance in the near term is sideways-to-lower until the short-term averages are defended. Chasing longs at current levels offers poor risk/reward. Trade plan: Two clean setups: 1. Hold of the 85,126–85,270 (MA7/EMA7) zone with declining sell volume → long toward 86,700–87,400, stop below 84,600. 2. Daily close below 84,978 → short toward 84,400 then 82,400, stop above 86,200. Invalidation and risk note: A daily close above 87,401 would neutralize the immediate cooling and reopen upside. A daily close below 84,633 (MA14) would confirm the short-term structure has broken and bring the 82,400–81,900 zone into play. Main risk is the early momentum loss percentage moves can develop quickly once the short-term averages give way. Prefer confirmation over anticipation. Not a call a structural update. $BTCUSDT #ByXIMPACT
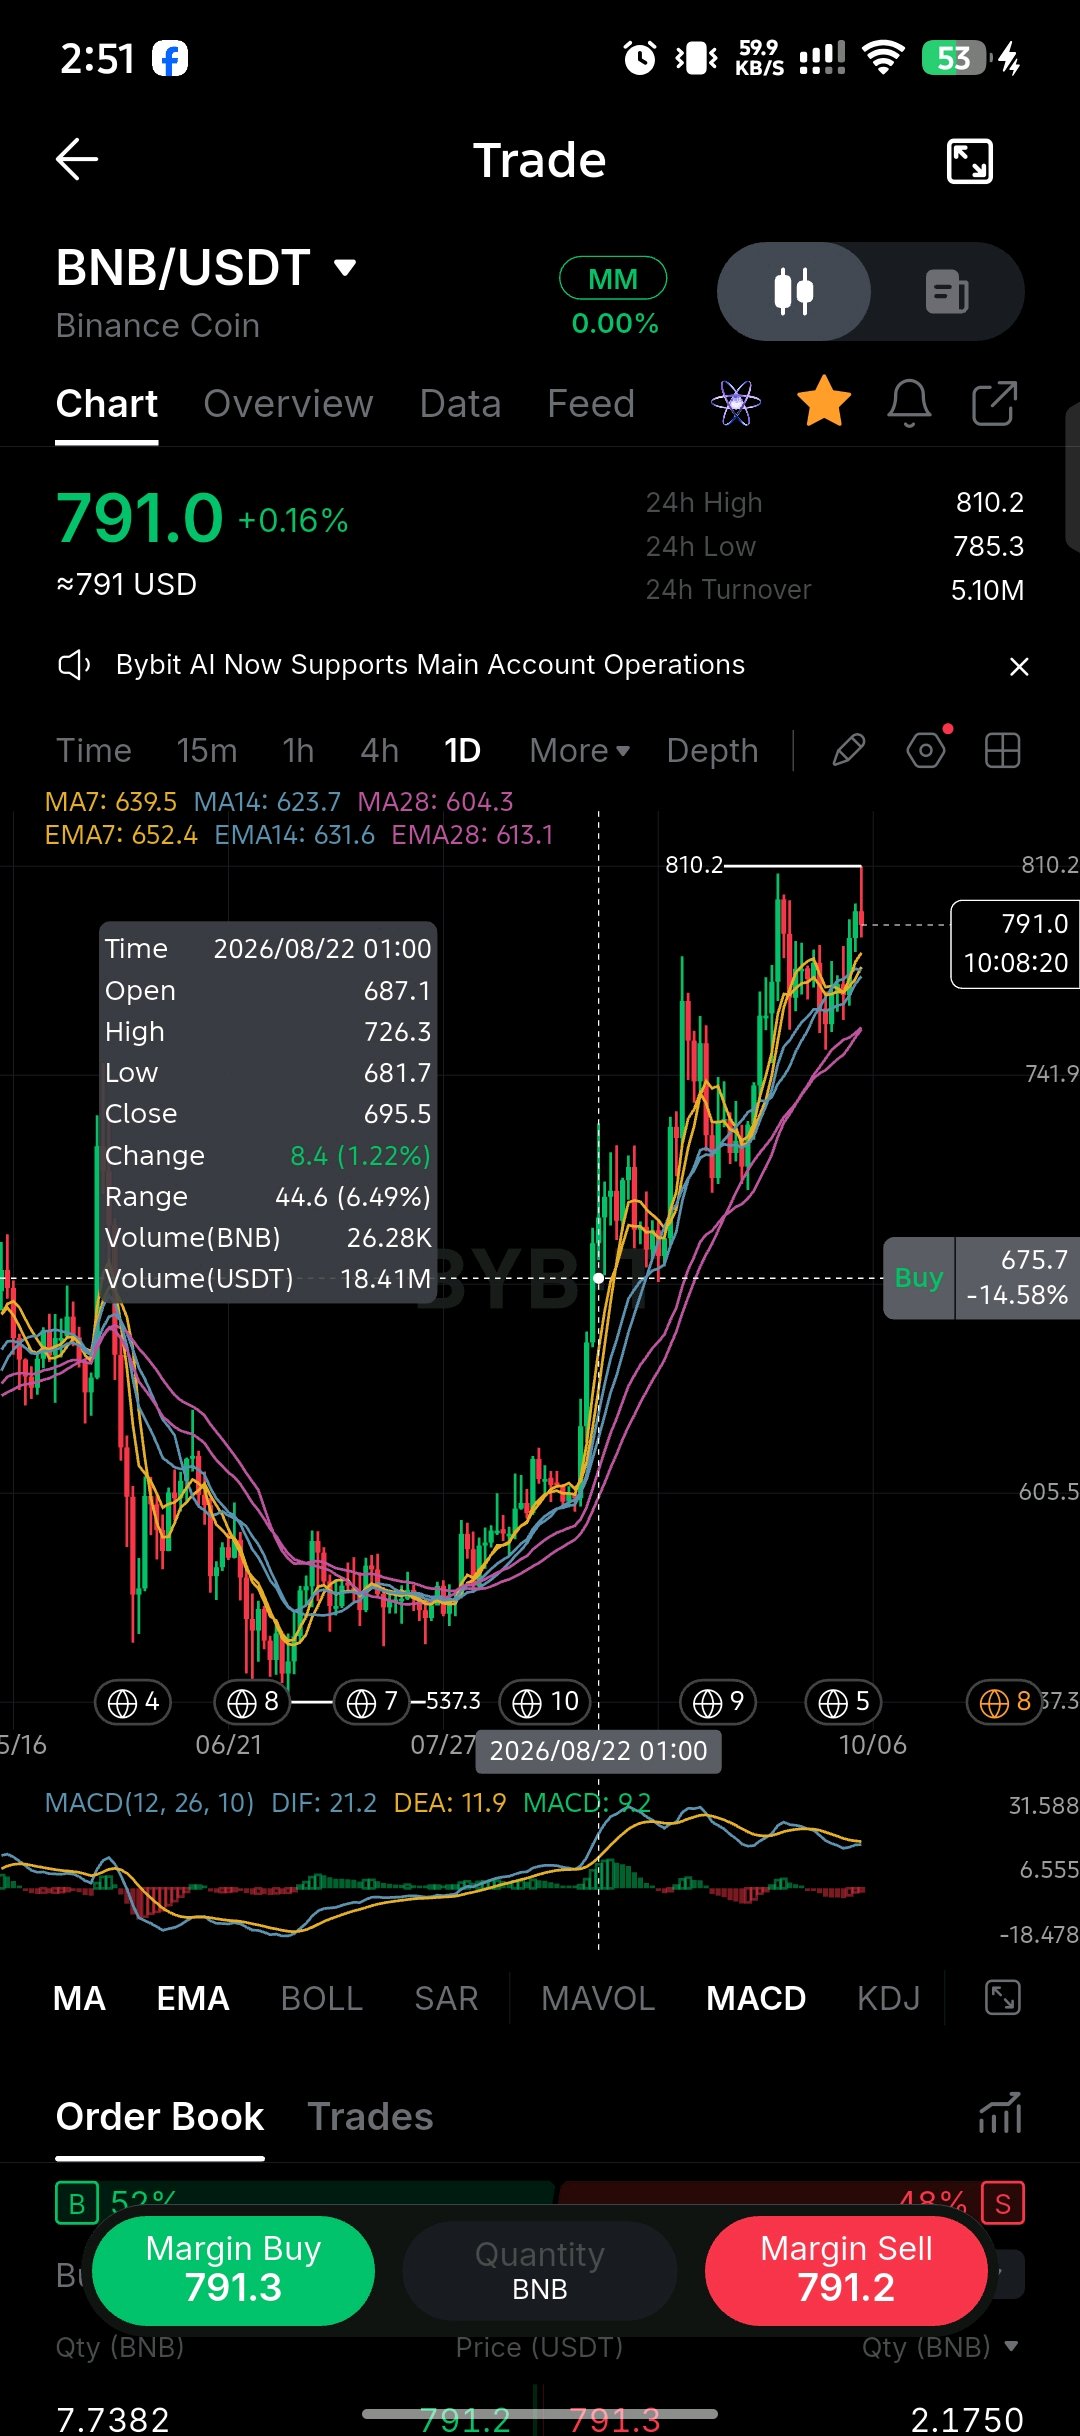
$BNBUSDT is consolidating at 791.0 after tagging the 810.2 high, up just 0.16% on the session. 24h turnover sits at a modest 5.10M. Context: BNB has been in a sustained multi-month advance from the mid-500s into the 800s. Price remains well above the entire moving-average stack and is now digesting just below the recent peak. This is a mature uptrend, not an early breakout phase. Turnover at 5.10M is light for BNB. Participation has cooled relative to the stronger expansion sessions that drove the move higher. Volume has moderated on the latest candles. The advance was real, but the current consolidation is occurring on thinner activity. The MA structure is fully bullish and widely fanned: - MA7: 639.5 - MA14: 623.7 - MA28: 604.3 - EMA7: 652.4 - EMA14: 631.6 - EMA28: 613.1 Price at 791 is sitting roughly 21–31% above the short-term averages. The stack is rising and correctly ordered, but the gap is substantial. MACD: DIF 21.2, DEA 11.9, histogram 9.2. Momentum remains strongly positive and elevated. No roll-over has appeared yet. Support and Resistance: - Resistance: 810.2 (24h and swing high) is the clear ceiling. A clean break and hold above it would reopen price discovery. - Support: 785.3 (24h low) is the first crack line. Below that the rising EMA7/MA7 cluster at 652–639 forms the first major dynamic floor. Level to watch: 785–790. Holding this zone keeps the short-term structure intact. A daily close below 785 would be the first sign of deeper profit-taking and would open a move toward the 650–630 area. Consideration: The higher-timeframe trend is still up and the averages remain supportive. However, the combination of light turnover and the large distance from the MA stack makes chasing the current 791 print unattractive. The cleanest reaction will come from how price behaves on any pullback into the rising short-term averages. Trade plan: I’m not chasing at current levels. Two clean setups: 1. Pullback into the 652–639 (EMA7/MA7) zone that holds with declining sell volume → long toward 810–850, stop below 620. 2. Daily close above 810.2 with volume expansion → continuation long, tight stop under 780. Invalidation and risk note: A daily close below 639.5 (MA7) breaks the short-term momentum structure and opens 630–604. A daily close below 604.3 (MA28) would mark a deeper trend reset. Main risk here is the extension itself moves this far above the averages can retrace 15–25% of the impulse relatively quickly once selling pressure appears. Prefer the retest. Not a call a structural update. $BNBUSDT #ByXIMPACT
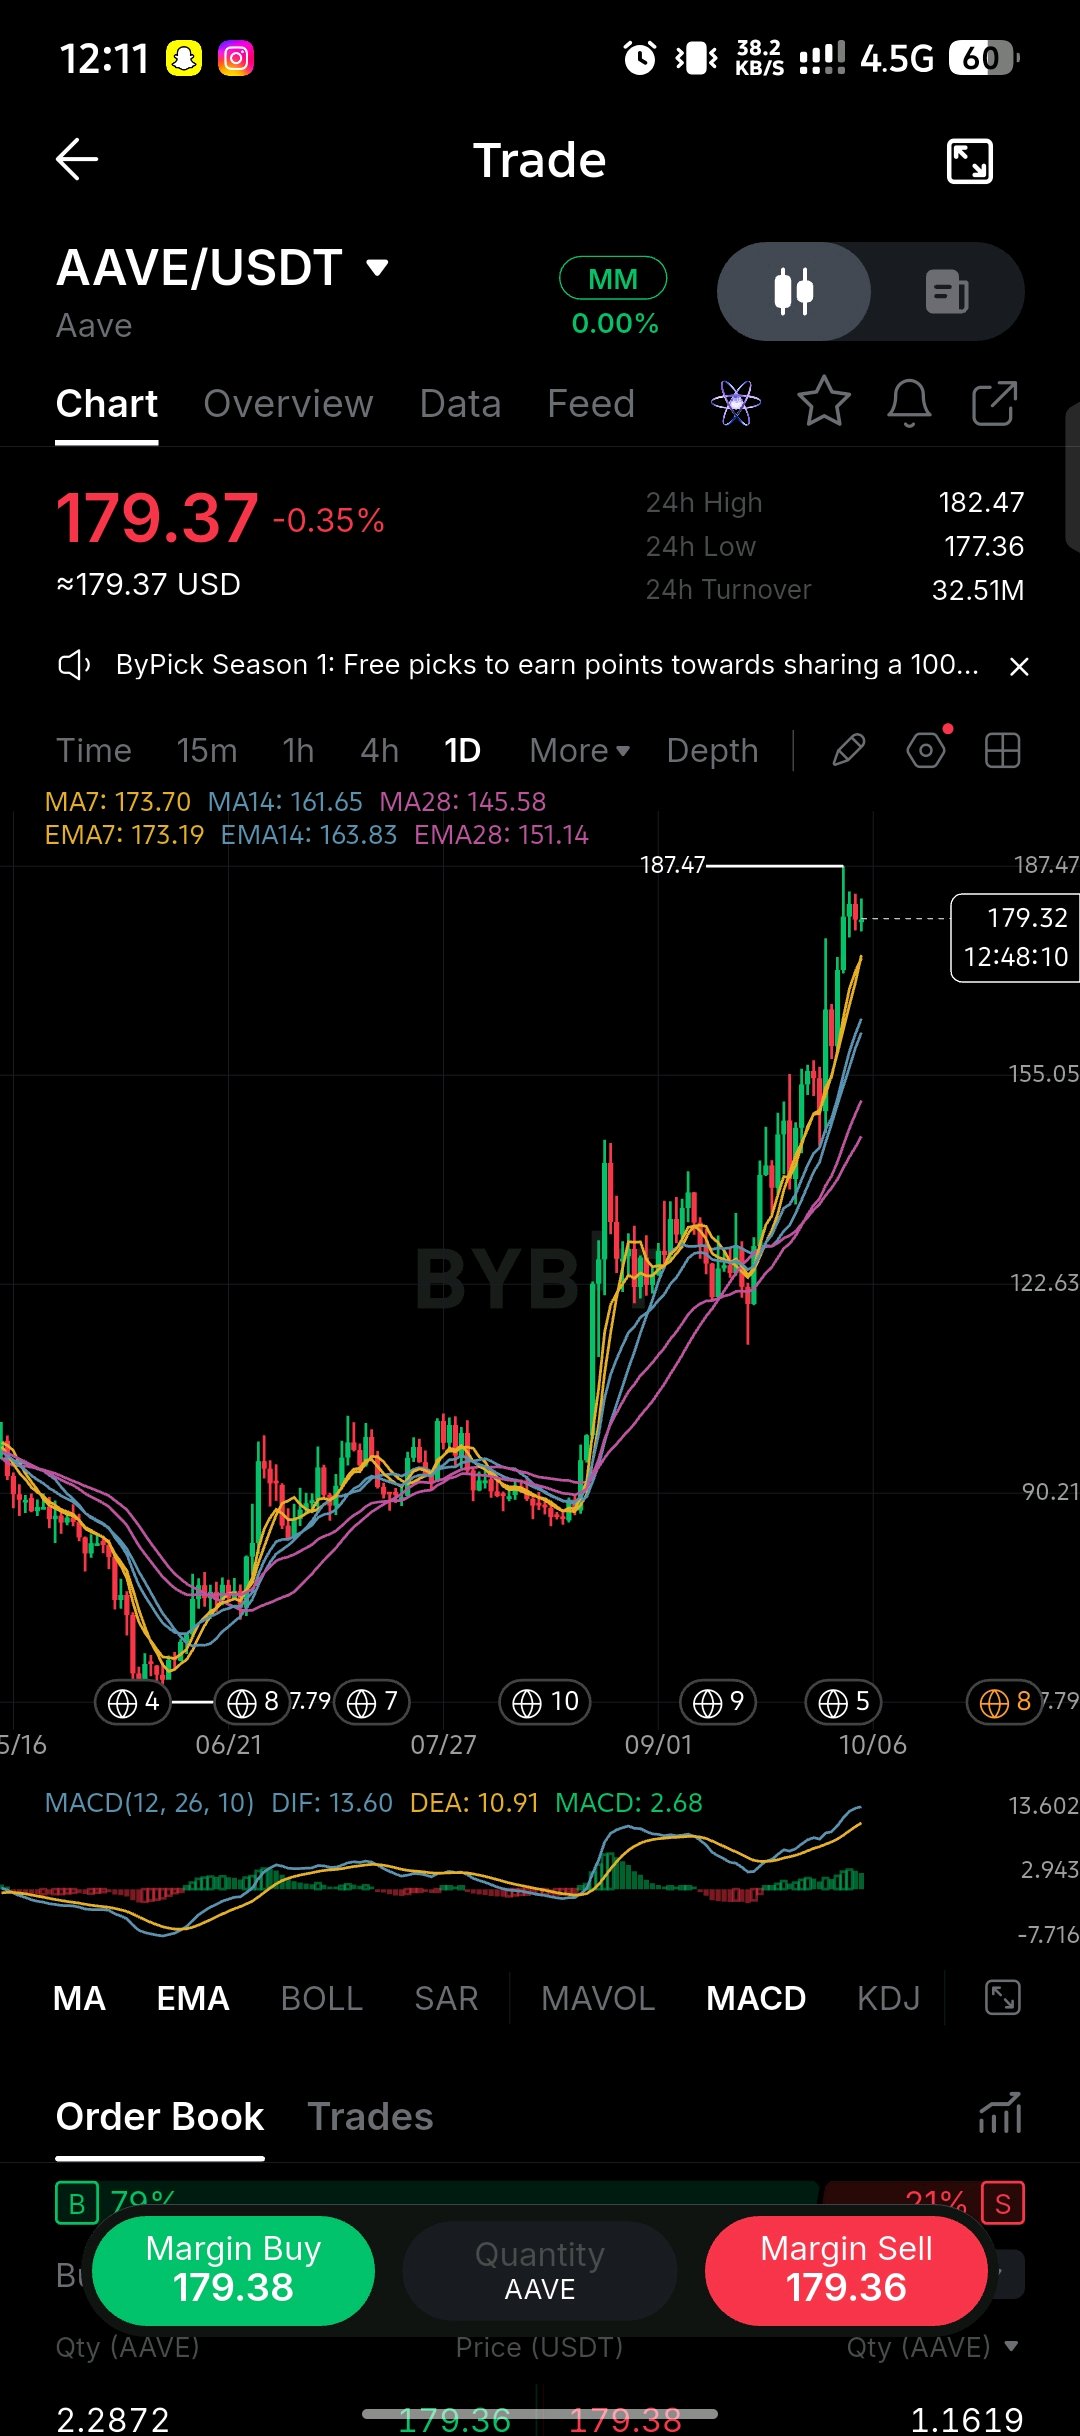
$AAVEUSDT pulled back modestly from the 182.47 high and is trading at **179.37**, down 0.35% on the day. 24h turnover remains healthy at 32.51M after the strong multi-week advance. Context: AAVE has been in a sustained uptrend since the summer base, climbing from the 90s into the high 180s. Price is now consolidating just below the recent peak of 187.47 while still holding well above the entire moving-average stack. The structure remains bullish, but the immediate question is whether this is a healthy pause or the start of a deeper digestion. Turnover at 32.51M is solid. Participation has stayed consistent through the advance and the current pullback. Volume has supported the higher prices. There is no clear divergence on the recent green candles, though the latest session has cooled slightly. The MA structure is fully bullish and fanning: - MA7: 173.70 - MA14: 161.65 - MA28: 145.58 - EMA7: 173.19 - EMA14: 163.83 - EMA28: 151.14 Price at 179.37 sits roughly 3–23% above the short-term averages. The stack is rising and correctly ordered the signature of an intact trend. MACD: DIF 13.60, DEA 10.91, histogram 2.68. Momentum remains positive and still expanding. No roll-over signal has appeared yet. Support and Resistance: - Resistance: 182.47–187.47 (24h high / prior swing high). A clean break and hold above 187.47 would reopen price discovery. - Support: 177.36 (24h low) is the first crack line. Below that the rising EMA7/MA7 cluster at 173.2–173.7 forms the first real dynamic floor. Level to watch: 173.20–173.70. Holding this band on any deeper pullback keeps the short-term structure fully intact. A daily close below it would be the first sign the current leg is losing control and would open a move toward the 163–151 zone. Consideration: The trend is still up, momentum is expanding, and the order book remains bid-side (70%). The only caution is the proximity to the recent highs after a long run. The highest-quality entry remains a pullback into the rising short-term averages rather than a chase near 179–182. Trade plan: Two clean setups: 1. Pullback into the 173.20–173.70 (EMA7/MA7) zone that holds with declining sell volume → long toward 182–187, stop below 163. 2. Daily close above 187.47 with volume expansion → continuation long, tight stop under 176. Invalidation and risk note: A daily close below 173.70 (MA7) breaks the short-term momentum structure and opens 163–151. A daily close below 145.58 (MA28) would mark a deeper trend reset. Main risk at these levels is simple extension after a strong run profit-taking can appear quickly once the market loses momentum. Prefer the retest. Not a call a structural update. $AAVEUSDT #ByXIMPACT
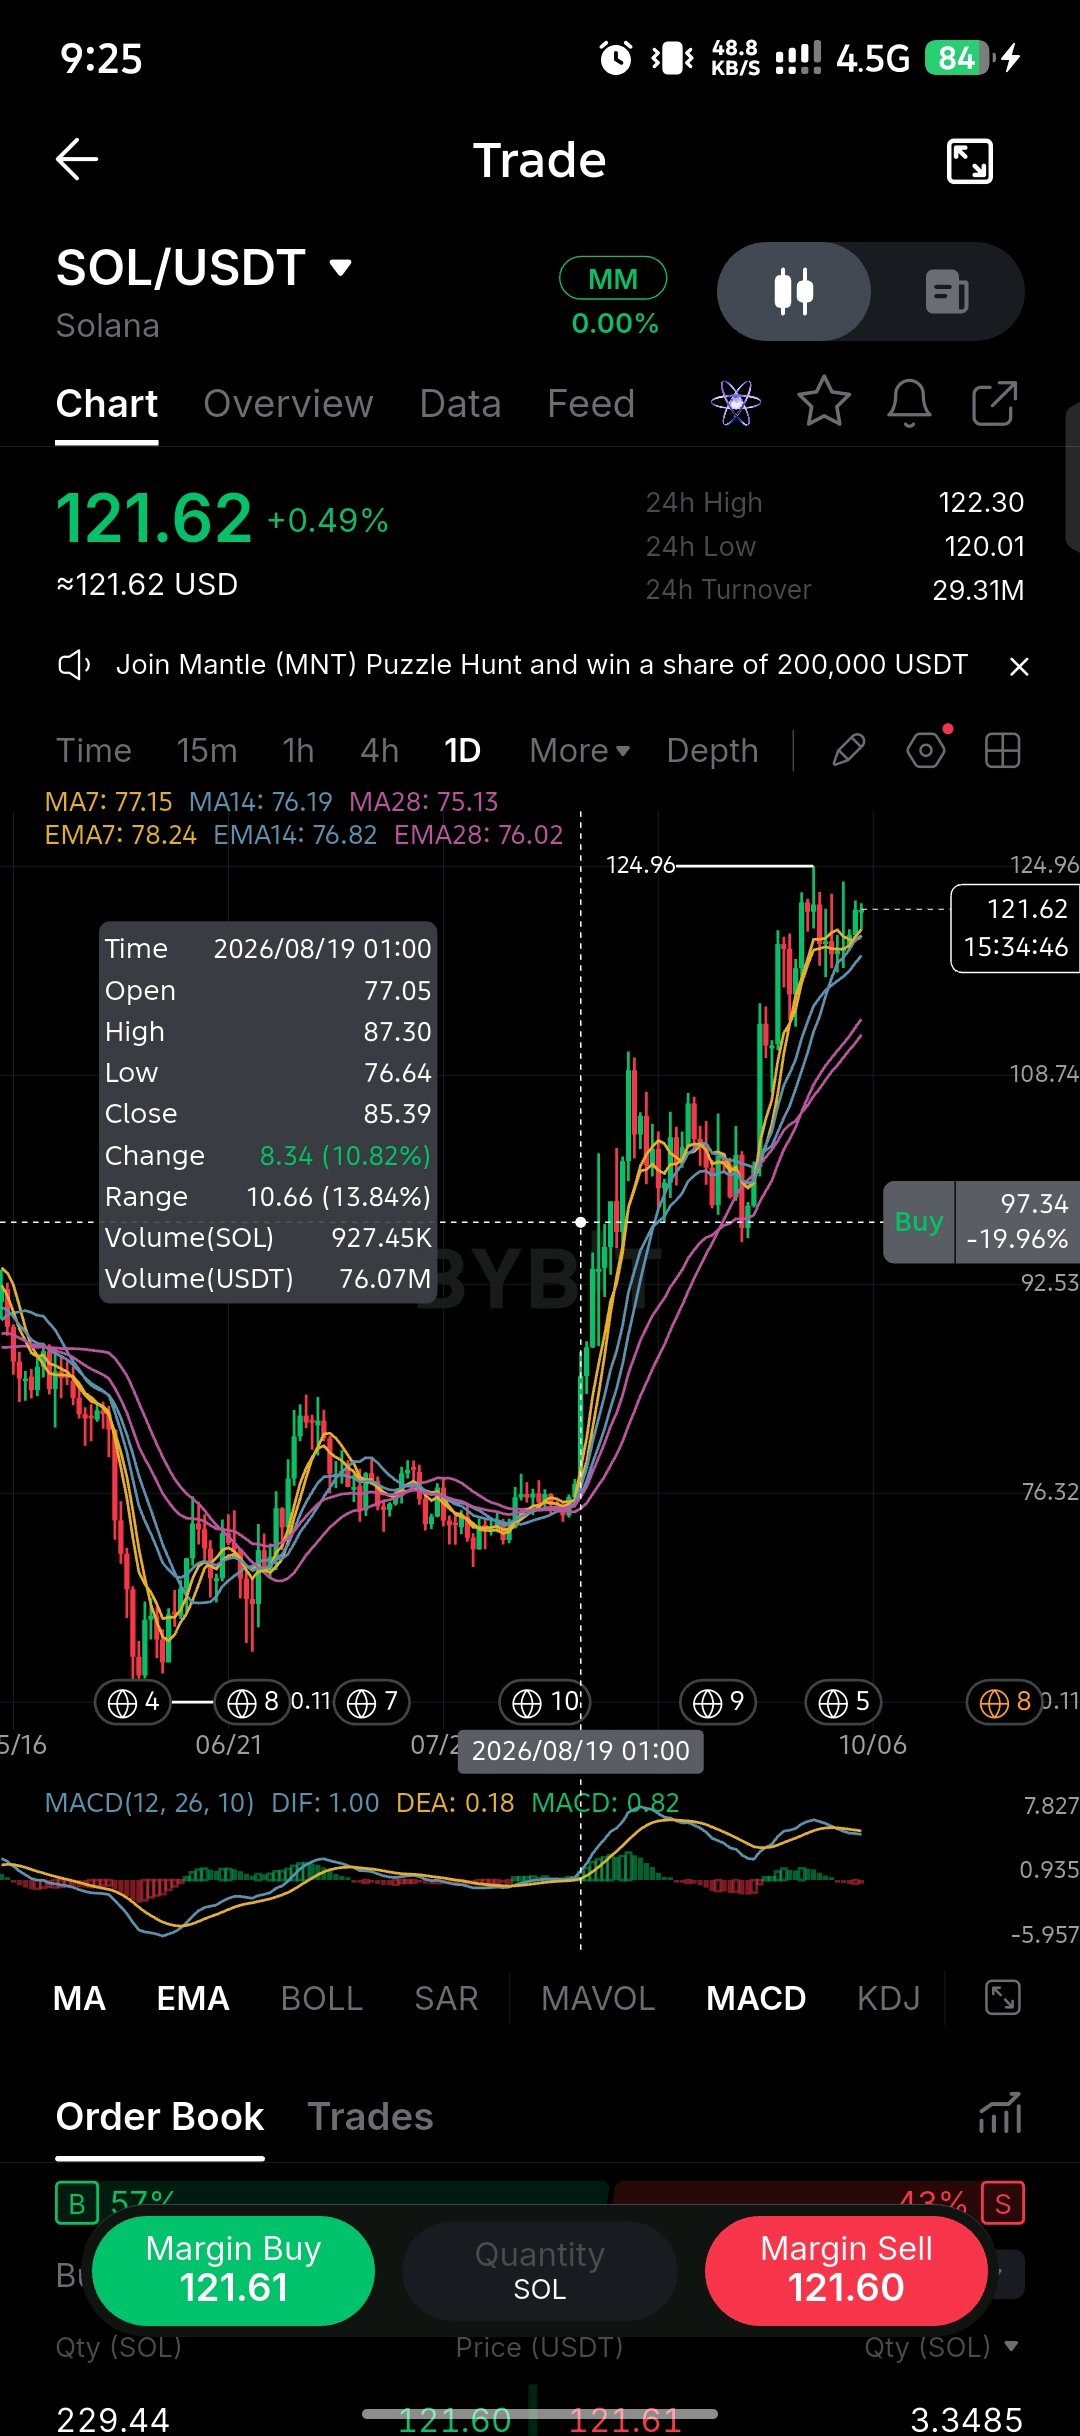
$SOLUSDT is trading at 121.62, up 0.49% inside a tight 120.01–122.30 range. 24h turnover sits at 29.31M. Context: SOL has been in a powerful multi-month advance from the mid-70s into the 120s. Price remains well above every moving average and is consolidating just below the recent high of 124.96. This is a mature trend structure, not an early breakout. Turnover at 29.31M is solid. Participation remains healthy even as the chart has extended. Volume has supported the advance, though the most recent sessions show some cooling compared with the strongest expansion days. The MA structure is fully bullish and extremely stretched: - MA7: 77.15 - MA14: 76.19 - MA28: 75.13 - EMA7: 78.24 - EMA14: 76.82 - EMA28: 76.02 Price at 121.62 is sitting roughly 55–62% above the short-term averages. The stack is rising and correctly ordered, but the gap between price and the averages is one of the widest on the major pairs. MACD: DIF 1.00, DEA 0.18, histogram 0.82. Momentum remains positive and elevated. There is no roll-over signal yet, though the rate of expansion has slowed from the earlier vertical phase. Support and Resistance: - Resistance: 122.30–124.96 (24h high / prior swing high). A clean break and hold above 124.96 would reopen price discovery. - Support: 120.01 (24h low) is the first crack line. Below that the chart has limited intermediate structure until the rising EMA7/MA7 cluster near 78–77. Level to watch: 120.00–120.50. Holding this zone keeps the short-term consolidation intact. A daily close below it would be the first sign of deeper profit-taking and would open a move toward the mid-100s before any real average support appears. Consideration: The higher-timeframe trend is clearly up and the averages remain supportive. However, the extreme distance from the MA stack means any sustained selling can travel a long way before finding dynamic support. The highest-quality entry is no longer a chase near 121–122. A meaningful pullback would be required to restore cleaner risk/reward. Trade plan: I’m not chasing at current levels. Two clean setups: 1. Pullback into the 78–77 (EMA7/MA7) zone that holds with declining sell volume → long toward 124–130, stop below 75. 2. Daily close above 124.96 with volume expansion → continuation long, tight stop under 119.50. Invalidation and risk note: A daily close below 120.00 opens the path toward the mid-100s. A daily close below 78.24 (EMA7) would break the short-term momentum structure and bring the deeper averages into play. Main risk here is the sheer extension moves this far above the averages can retrace 20–30% of the impulse relatively quickly once selling pressure appears. Prefer the retest. Not a call a structural update. $SOLUSDT #ByXIMPACT
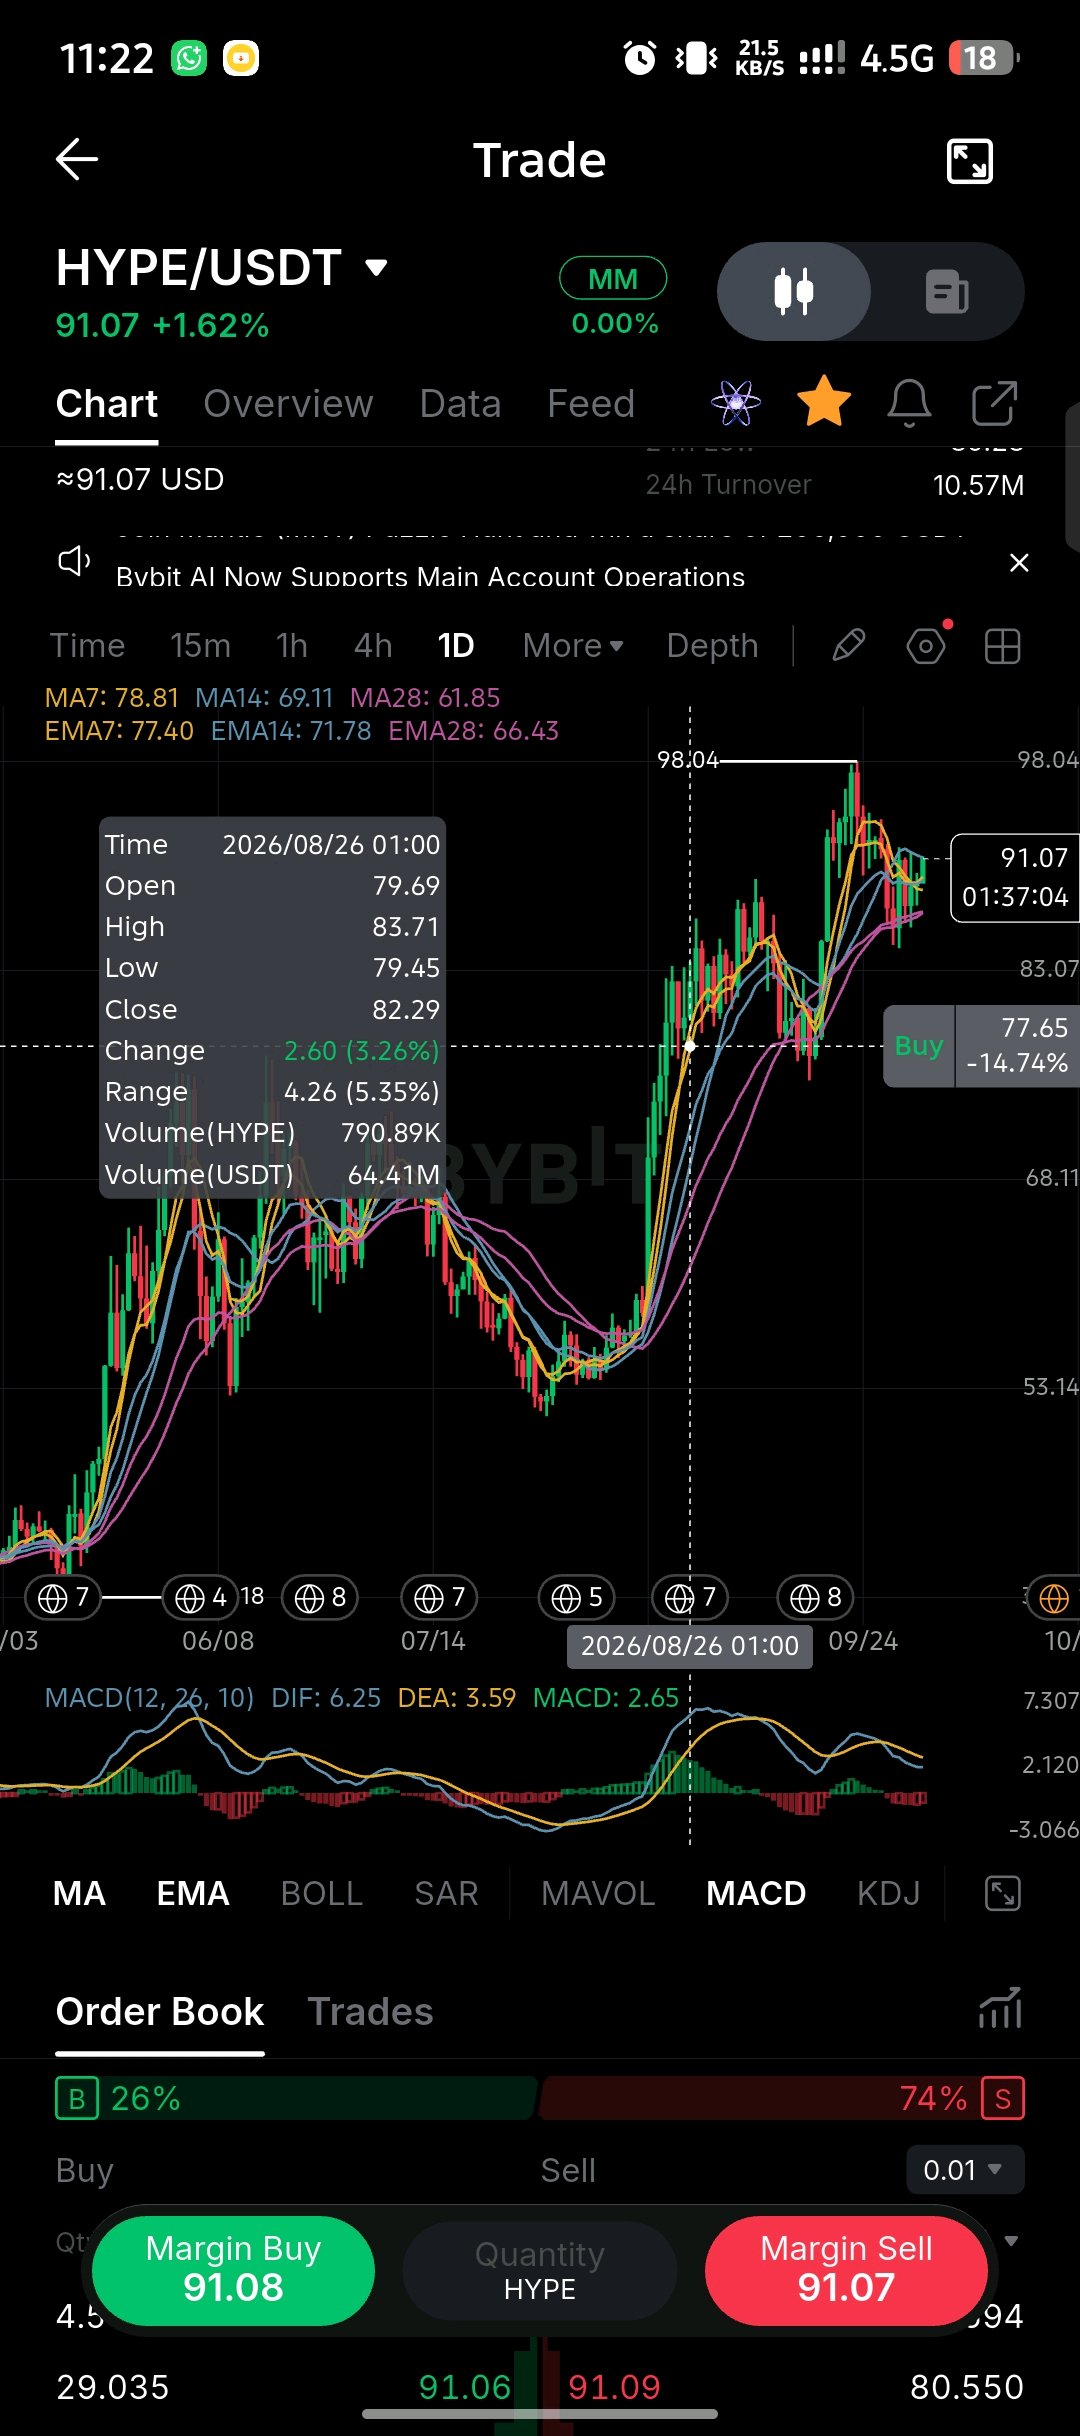
$HYPEUSDT is trading at 91.07, up 1.62% on the session with a 24h turnover of 10.57M. Price remains well above the entire moving-average stack after the strong run that took it into the 98.04 high. Context: HYPE has been in a sustained uptrend since the mid-year base. The current leg pushed it cleanly through the 70s and 80s into the high 90s before a modest pullback. This is still a momentum structure, but the distance from the averages is now significant and the order book has flipped heavily to the ask side. Turnover at 10.57M is moderate. Participation is present but not at the peak levels seen during the strongest expansion candles. Volume has cooled relative to the vertical phase of the move. The current bounce is occurring on lighter activity than the impulse that created the 98 high. **The MA structure remains fully bullish and widely fanned:** - MA7: 78.81 - MA14: 69.11 - MA28: 61.85 - EMA7: 77.40 - EMA14: 71.78 - EMA28: 66.43 Price at 91.07 is sitting roughly 15–47% above the short-term averages. The stack is rising and correctly ordered, but the gap is large enough that any sustained selling can travel quickly toward the first dynamic support. MACD: DIF 6.25, DEA 3.59, histogram 2.65. Momentum is still positive and elevated, though the histogram has begun to compress from the earlier extremes. No full roll-over yet, but the expansion phase has clearly slowed. Support and Resistance: - Resistance: 98.04 (prior high) is the clear ceiling. A clean break and hold above it would reopen price discovery. - Support: 77.40–78.81 (EMA7/MA7) is the first major dynamic floor. Below that, 71.78–69.11 (EMA14/MA14) and the deeper 66–61 zone. Level to watch: 77.40–78.81. Holding this band on any deeper pullback keeps the short-term structure intact. A daily close below it would be the first real break of the current leg and would open a move toward the 70–66 area. Consideration: The higher-timeframe trend is still up and the averages remain supportive. However, two factors stand out: the extension above the MA stack and the 74% ask-side order book. That combination makes chasing the current 91 print unattractive. The cleanest reaction will come from how price behaves on a retest of the rising MA7/EMA7 cluster. Trade plan: I’m not chasing at 91. Two clean setups: 1. Pullback into the 77.40–78.81 (EMA7/MA7) zone that holds with declining sell volume → long toward 98.04, stop below 71.50. 2. Daily close above 98.04 with volume expansion → continuation long, tight stop under 88.00. Invalidation and risk note: A daily close below 78.81 (MA7) breaks the short-term momentum structure and opens 71–66. A daily close below 61.85 (MA28) would mark a deeper trend reset. Main risk right now is the combination of extension + heavy ask-side book moves this far above the averages can retrace 15–25% of the impulse relatively quickly once selling pressure appears. Prefer the retest. Not a call a structural update. $HYPEUSDT #ByXIMPACT
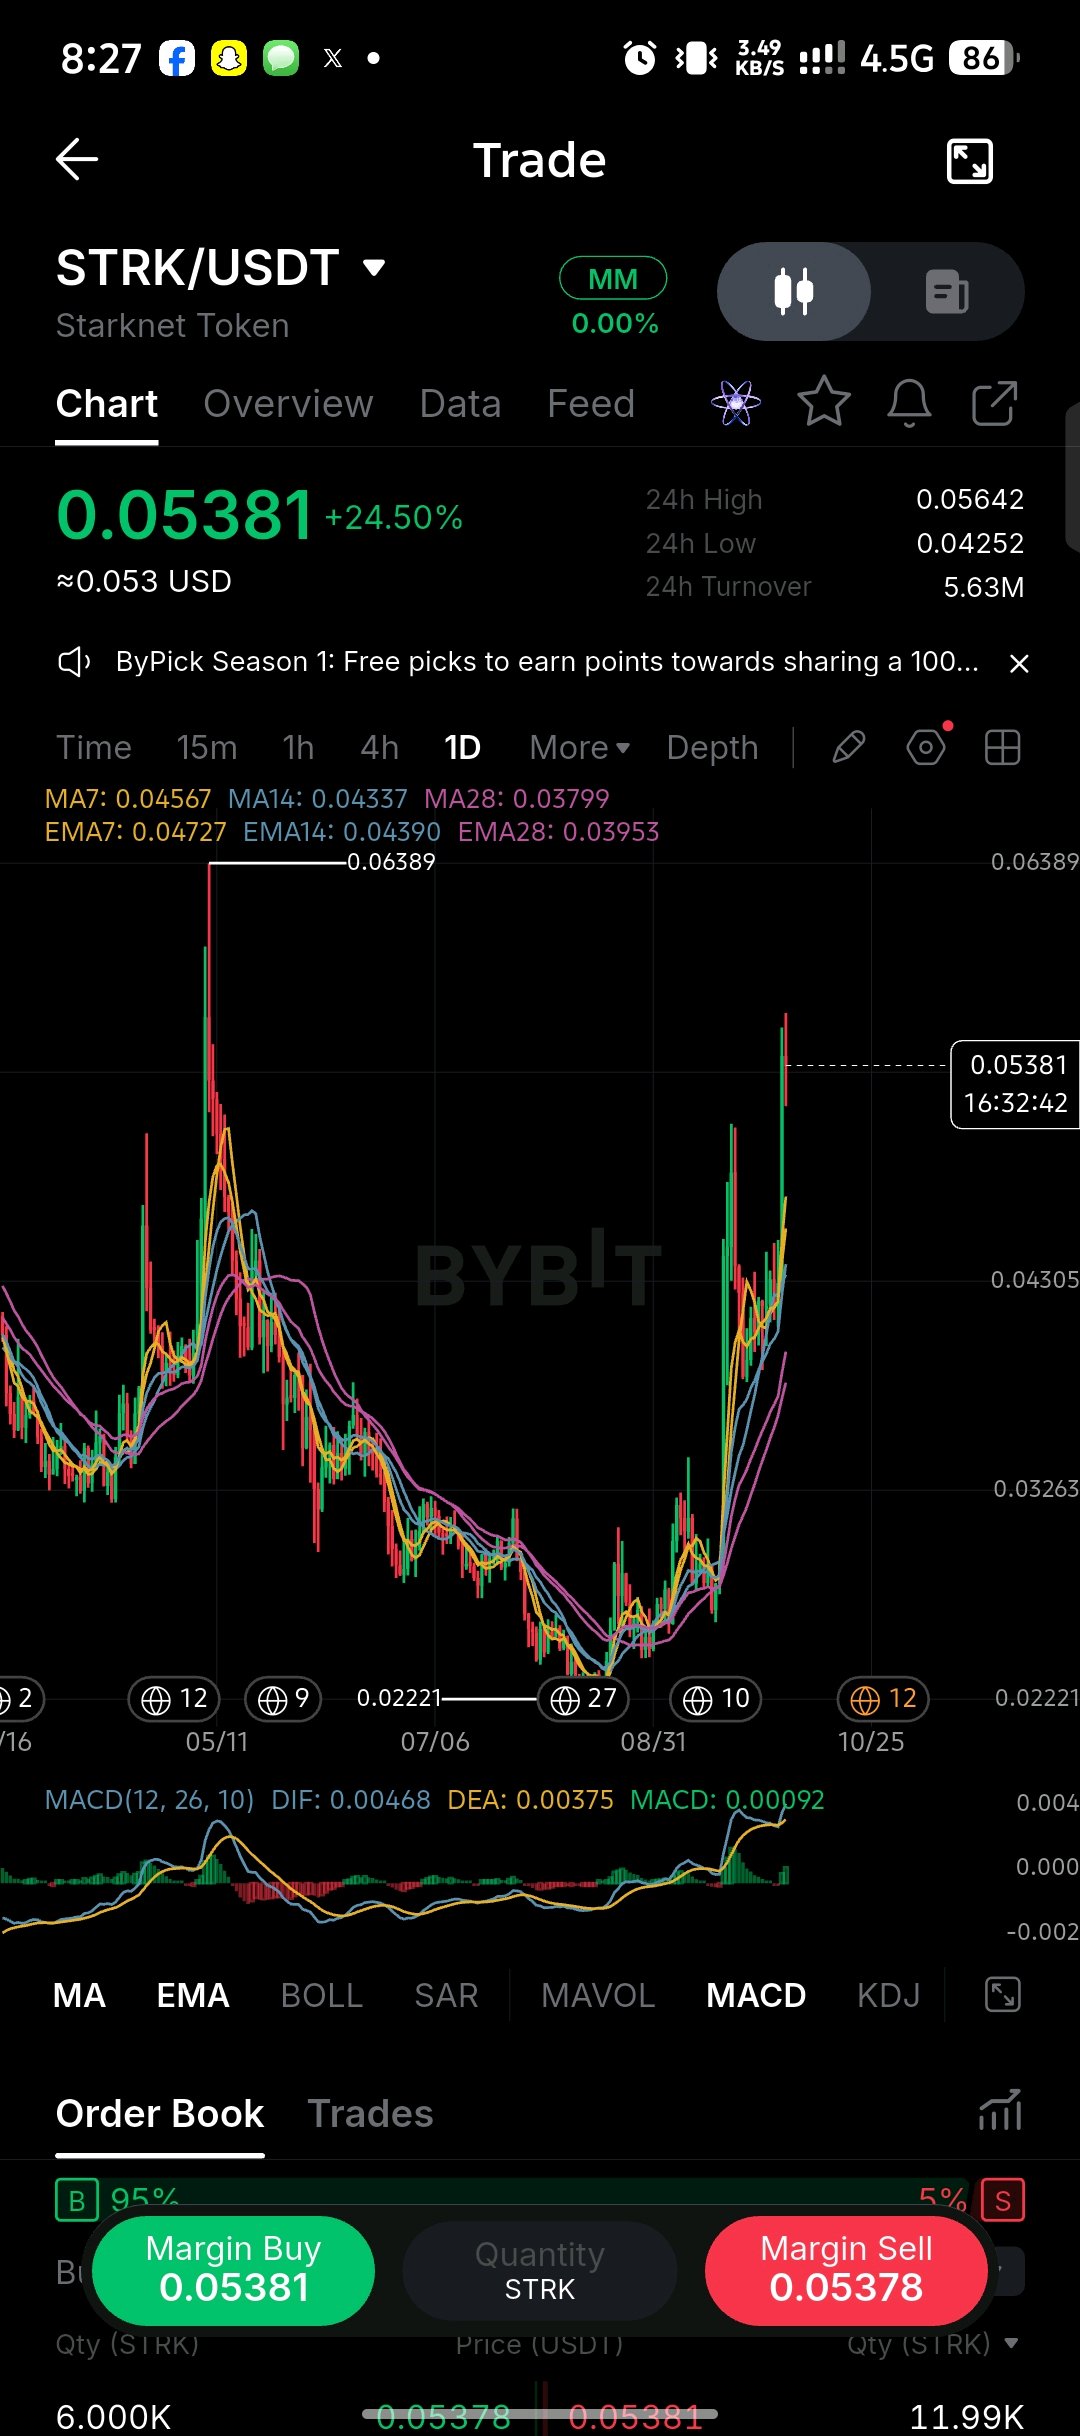
$STRKUSDT is trading at 0.05381, up 24.50% on the session after running from the 0.04252 low to a high of 0.05642. 24h turnover sits at 5.63M. Context: STRK has been grinding higher out of the 0.022–0.030 base and has now printed a strong expansion day. Price cleared the prior consolidation and is sitting well above the entire moving-average stack. This is a momentum breakout, not a slow grind. Turnover at 5.63M is decent but not explosive relative to a 24% daily move. Participation is present, yet not at the extreme levels that usually accompany the cleanest continuation legs. Volume has expanded on the green candles. The move is not a thin wick there is real activity behind it, though the absolute size remains moderate for the percentage gained. The MA structure is fully bullish and fanning: - MA7: 0.04567 - MA14: 0.04337 - MA28: 0.03799 - EMA7: 0.04727 - EMA14: 0.04390 - EMA28: 0.03953 Price at 0.05381 is roughly 14–42% above the short-term averages. The stack is rising and correctly ordered the visual signature of an early-to-mid trend expansion. MACD: DIF 0.00468, DEA 0.00375, histogram 0.00092. Momentum is positive and still expanding. No roll-over signal yet. Support and Resistance: - Resistance: 0.05642 (24h high) is the immediate ceiling. Above that the next visible supply sits near 0.060–0.06389 (prior swing high). - Support: 0.04727–0.04567 (EMA7/MA7) is the first dynamic floor. Below that, 0.0439–0.0425 (EMA14 / 24h low) and the deeper 0.039–0.038 zone. Level to watch: 0.0473–0.0457. Holding this band on any pullback keeps the short-term structure fully intact. A daily close below it would be the first sign the expansion is losing control and would open a deeper retest of the 0.043–0.039 area. Consideration: The breakout is real and the order book is heavily bid-side (95%). However, a 24% day on 5.63M turnover leaves the chart extended. The highest-quality entry is rarely the middle of a vertical candle. A pullback into the rising MA7/EMA7 cluster would offer a cleaner risk/reward than chasing the current print. Trade plan: I’m not chasing the 24% candle. Two clean setups: 1. Pullback into the 0.0473–0.0457 (EMA7/MA7) zone that holds with declining sell volume → long toward 0.0564–0.0639, stop below 0.0425. 2. Daily close above 0.05642 with volume expansion → continuation long, tight stop under 0.0510. Invalidation and risk note: A daily close below 0.04567 (MA7) breaks the short-term momentum structure and opens 0.043–0.039. A daily close below 0.03799 (MA28) would mark a deeper trend reset. Main risk here is the speed of the move — vertical advances of this size can retrace 30–50% of the daily range quickly once profit-taking appears. Prefer the retest. Not a call a structural update. $STRKUSDT #ByXIMPACT
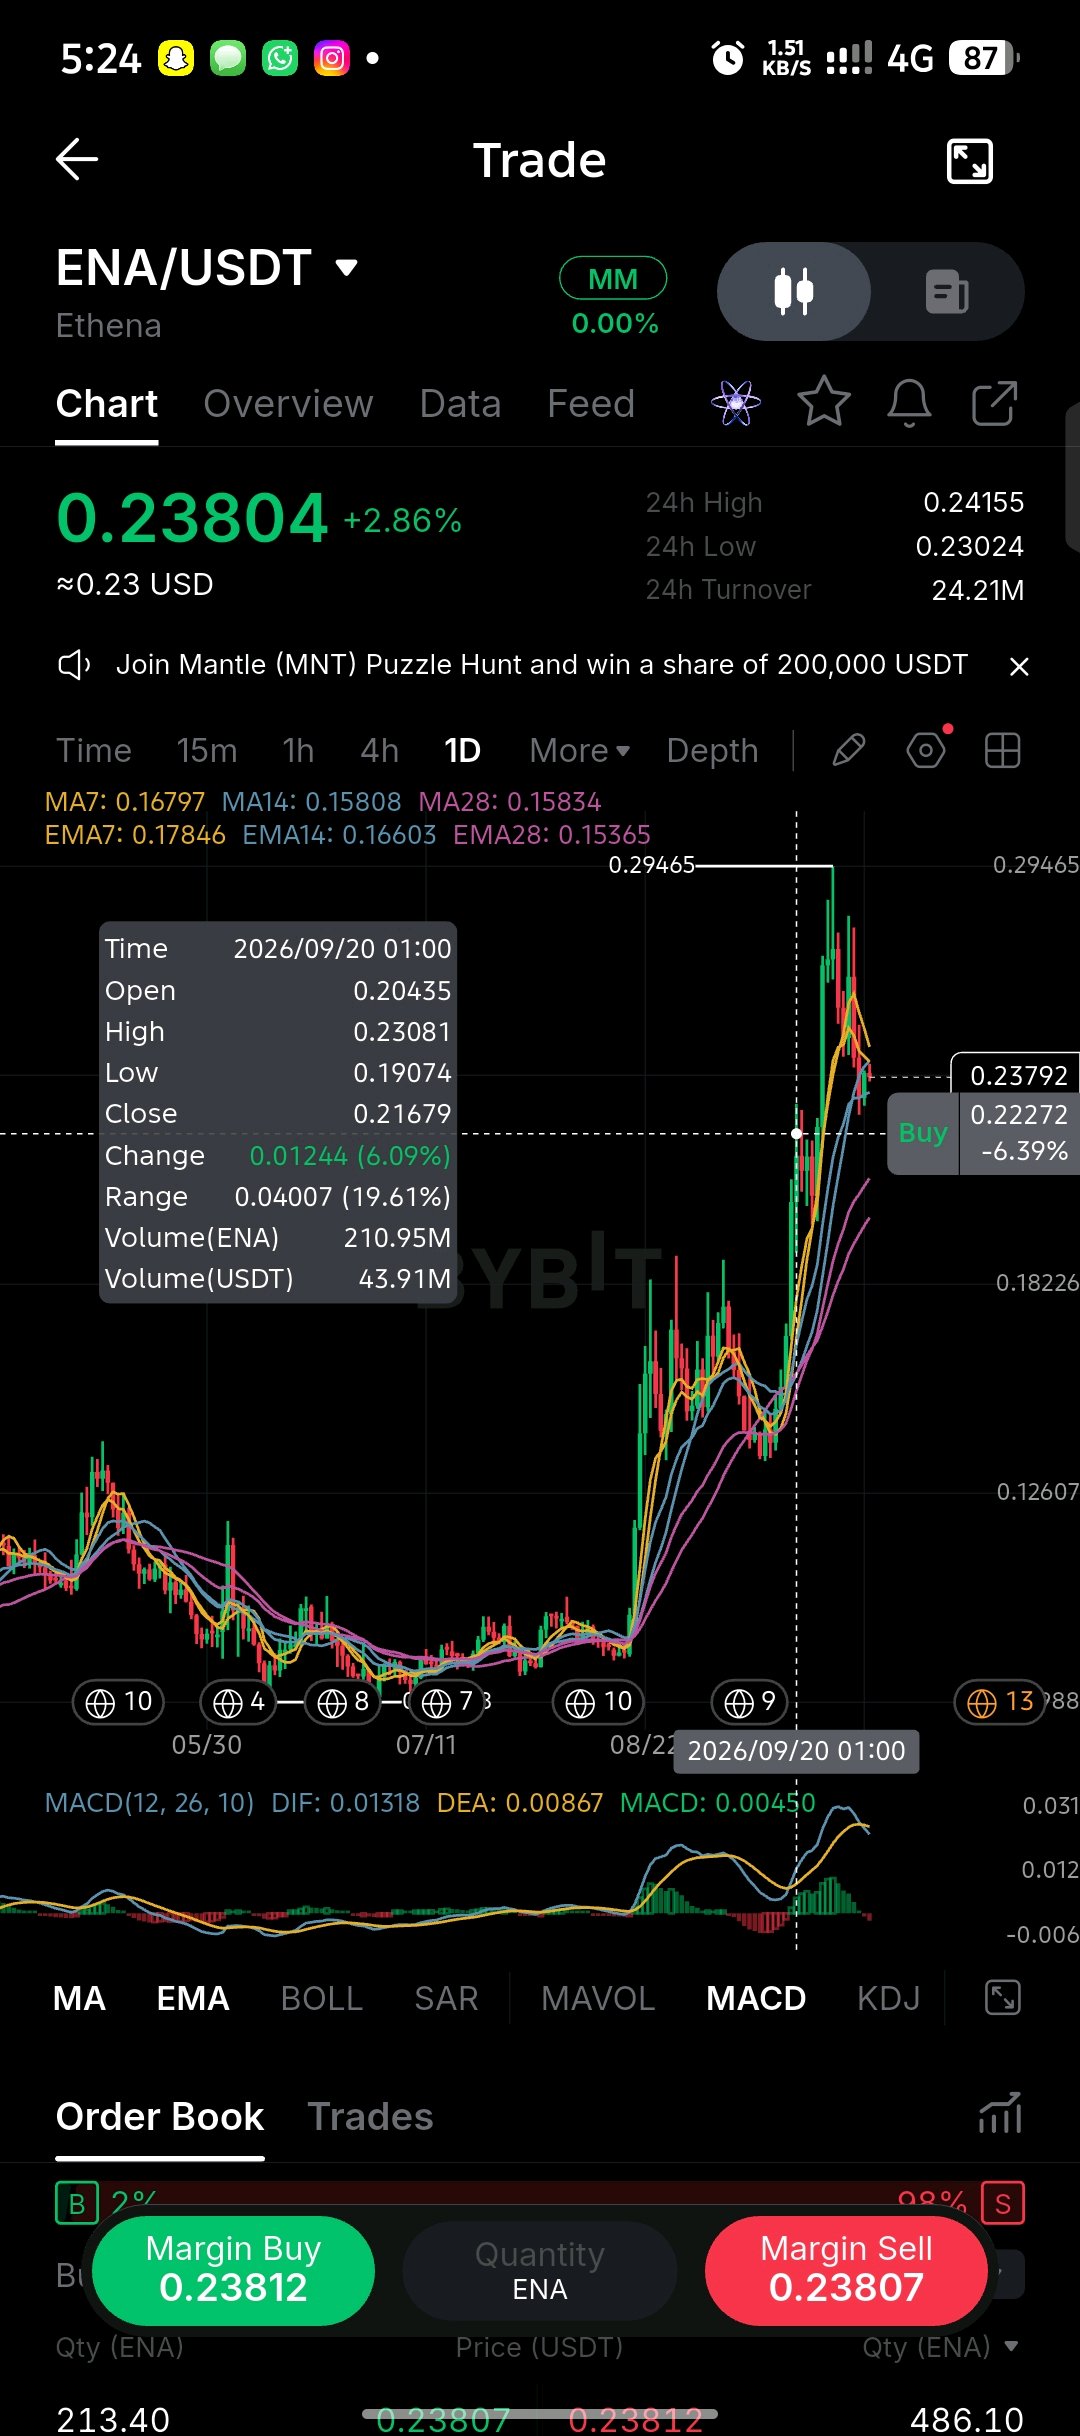
$ENAUSDT is trading at 0.23804, up 2.86% after running from the 0.23024 low to a high of 0.24155. 24h turnover sits at 24.21M. Context: ENA has been in a powerful recovery since the August base. The move has taken price from the mid-0.15s into the 0.23–0.24 zone in a near-vertical fashion. This is no longer an early-trend chart it is a fully extended momentum leg that is now testing higher levels on the daily. Turnover at 24.21M is healthy. The advance has been accompanied by real size rather than thin liquidity. Volume has supported the expansion. Participation remains elevated relative to the quieter base that preceded the run. The MA structure is fully bullish but extremely stretched: - MA7: 0.16797 - MA14: 0.15808 - MA28: 0.15834 - EMA7: 0.17846 - EMA14: 0.16603 - EMA28: 0.15365 Price at 0.23804 is sitting roughly 33–55% above the short-term averages. The stack is rising and correctly ordered, but the gap between price and the averages is one of the widest on the board right now. MACD:DIF 0.01318, DEA 0.00867, histogram 0.00450. Momentum is still positive and expanding. There is no roll-over signal yet on the indicator itself. Support and Resistance: - Resistance: 0.24155 (24h high) is the immediate ceiling. Above that the next supply sits near 0.26–0.28, with the prior major high at 0.29465. - Support: 0.23024 (24h low) is the first crack line. Below that the rising EMA7 at 0.1785 and MA7 at 0.1680 form the first real dynamic floor. Level to watch: 0.2300–0.2320. Holding this zone on any pullback keeps the short-term structure intact. A daily close below it would be the first sign the current expansion is losing control and would open a deeper retest of the 0.178–0.168 average cluster. Consideration: The trend is strongly up and momentum is still expanding. However, two factors stand out: the extreme distance from the averages and the order book sitting at 98% ask-side. That combination makes chasing the current price unattractive. The highest-quality reaction will come from how price behaves on the first meaningful pullback into the rising short-term averages. Trade plan: I’m not chasing at 0.238. Two clean setups: 1. Pullback into the 0.178–0.168 (EMA7/MA7) zone that holds with declining sell volume → long toward 0.241–0.28, stop below 0.153. 2. Daily close above 0.24155 with volume expansion → continuation long, tight stop under 0.228. Invalidation and risk note: A daily close below 0.16797 (MA7) breaks the short-term momentum structure and opens the 0.158–0.153 zone. A daily close below 0.15365 (EMA28) would mark a deeper trend reset. Main risk here is the combination of extreme extension + heavily ask-side book moves this far above the averages can retrace 25–40% of the impulse quickly once selling pressure appears. Prefer the retest over the chase. Not a call a structural update. $ENAUSDT #ByXIMPACT