
Rijvi
No shortcuts. Just charts, discipline & progress. 🎯
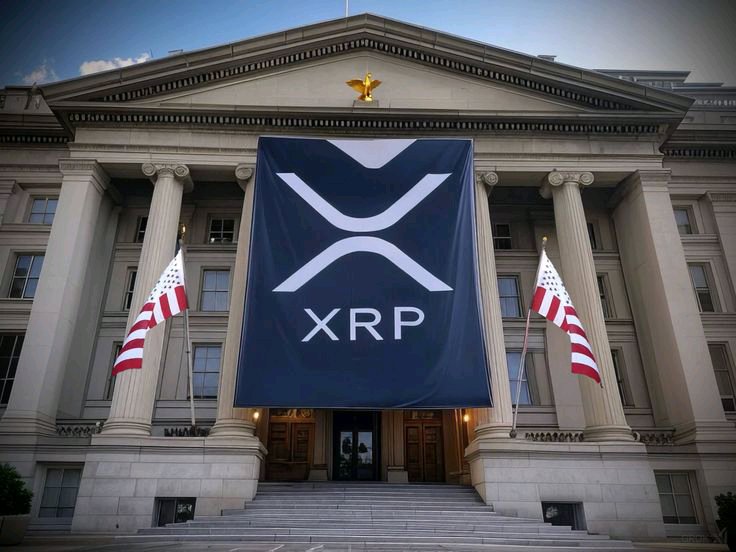
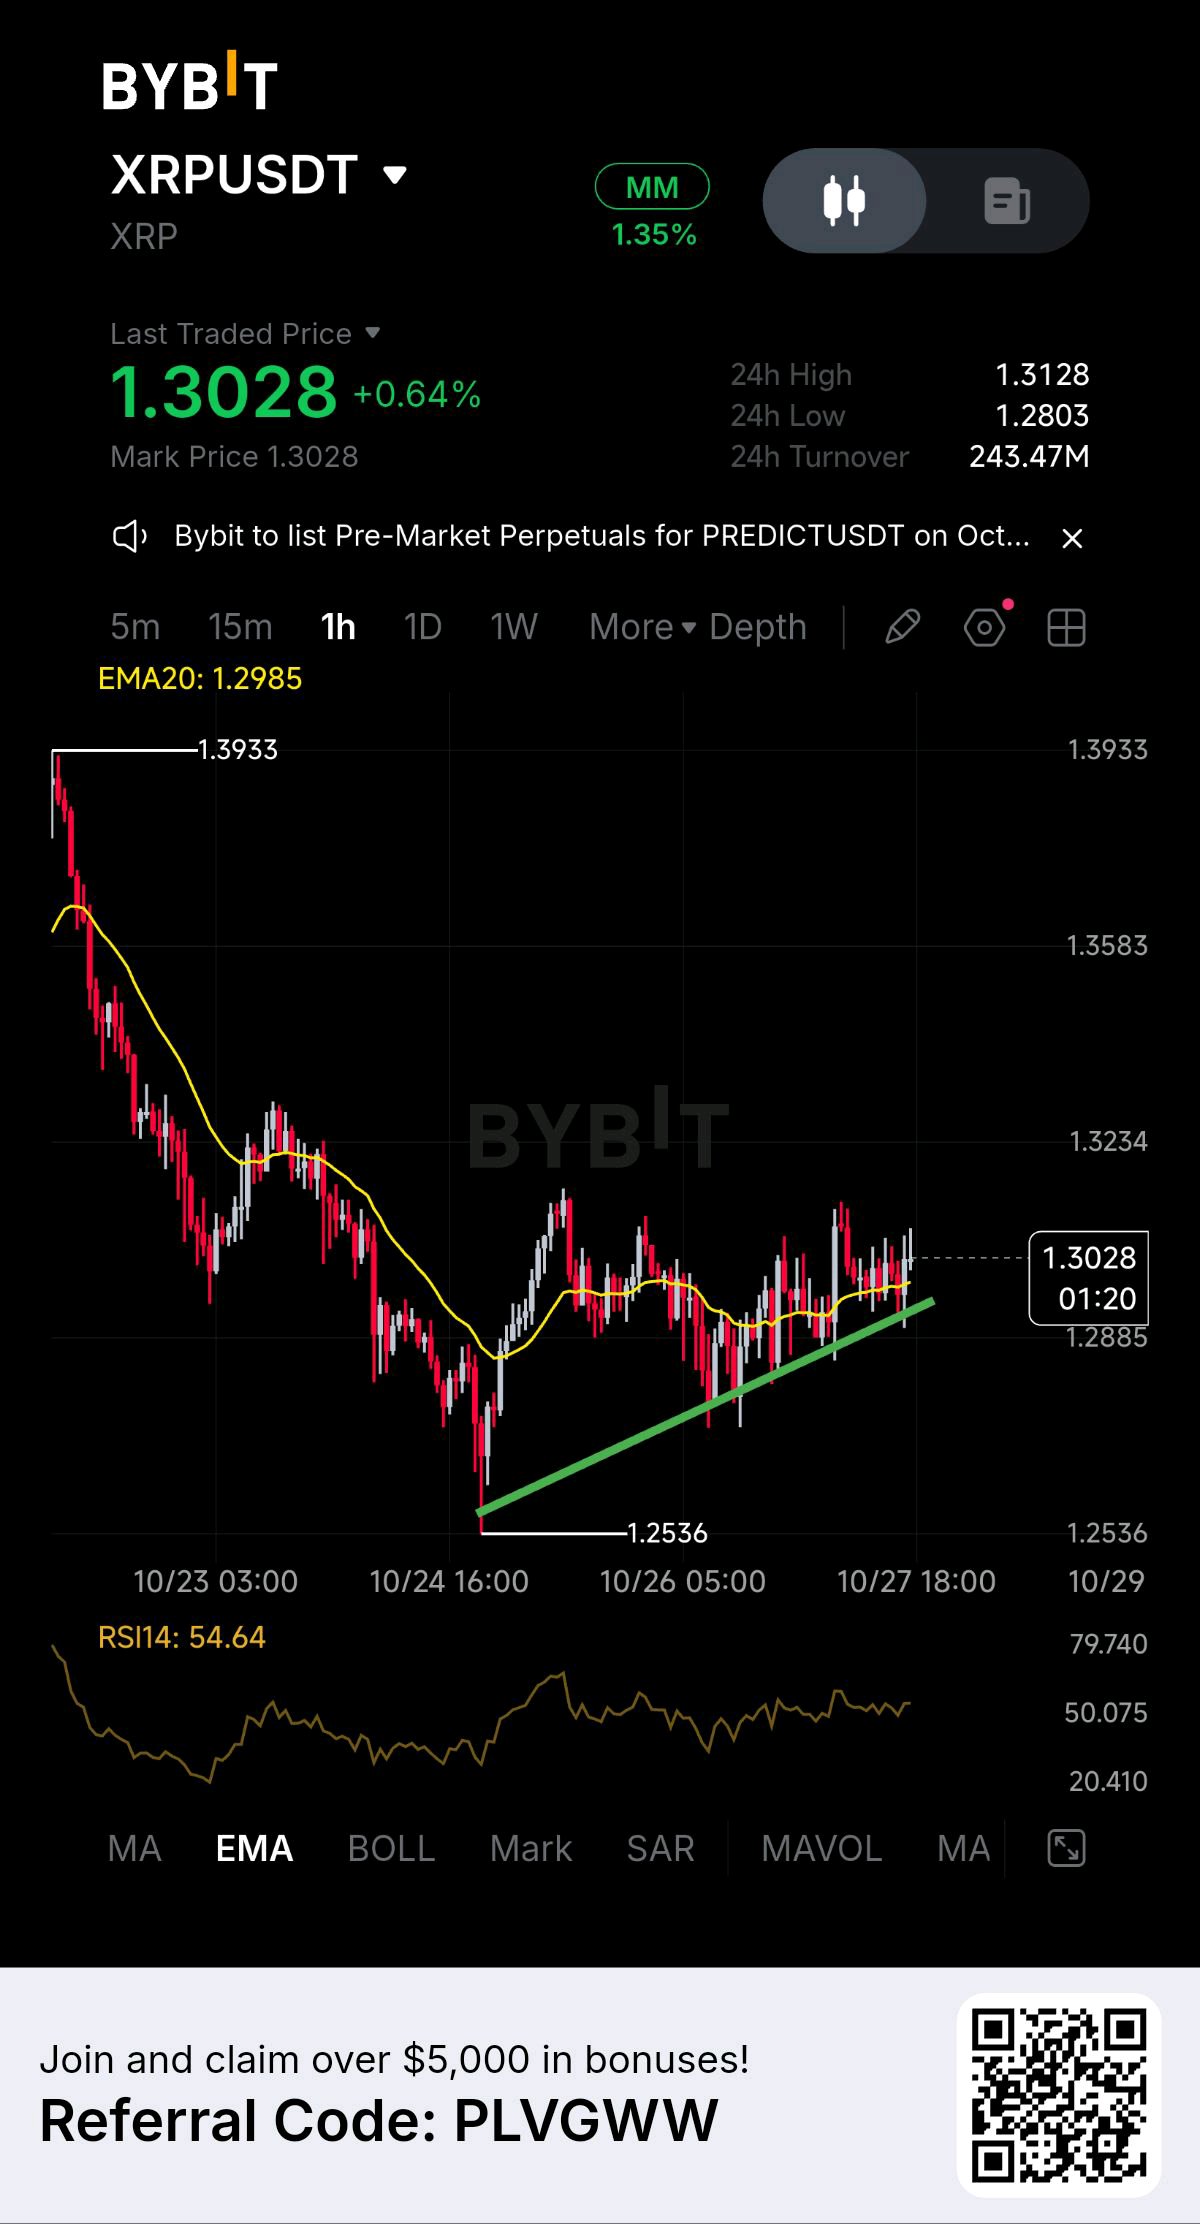
Looking at $XRP on the 1h, it dropped hard from the 1.39 high and found a low at 1.2536. Since then it's been making higher lows along a rising trendline, and price is now sitting just above both that line and the EMA20 at about 1.2985. RSI is around 54, so momentum is slightly positive without being stretched. What I'm watching is whether it can keep holding the trendline and push through the 1.3128 area, which is the 24h high. If it does, 1.3234 is the next level up. If it loses the trendline and the EMA20, I'd expect a retest of the 1.2803 low, and a break below that would put the 1.2536 low back in play. Just my read, not financial advice. #IMPACTbyTrade #MyByXTake #WSOT2026 $XRPUSDT $XRPBTC
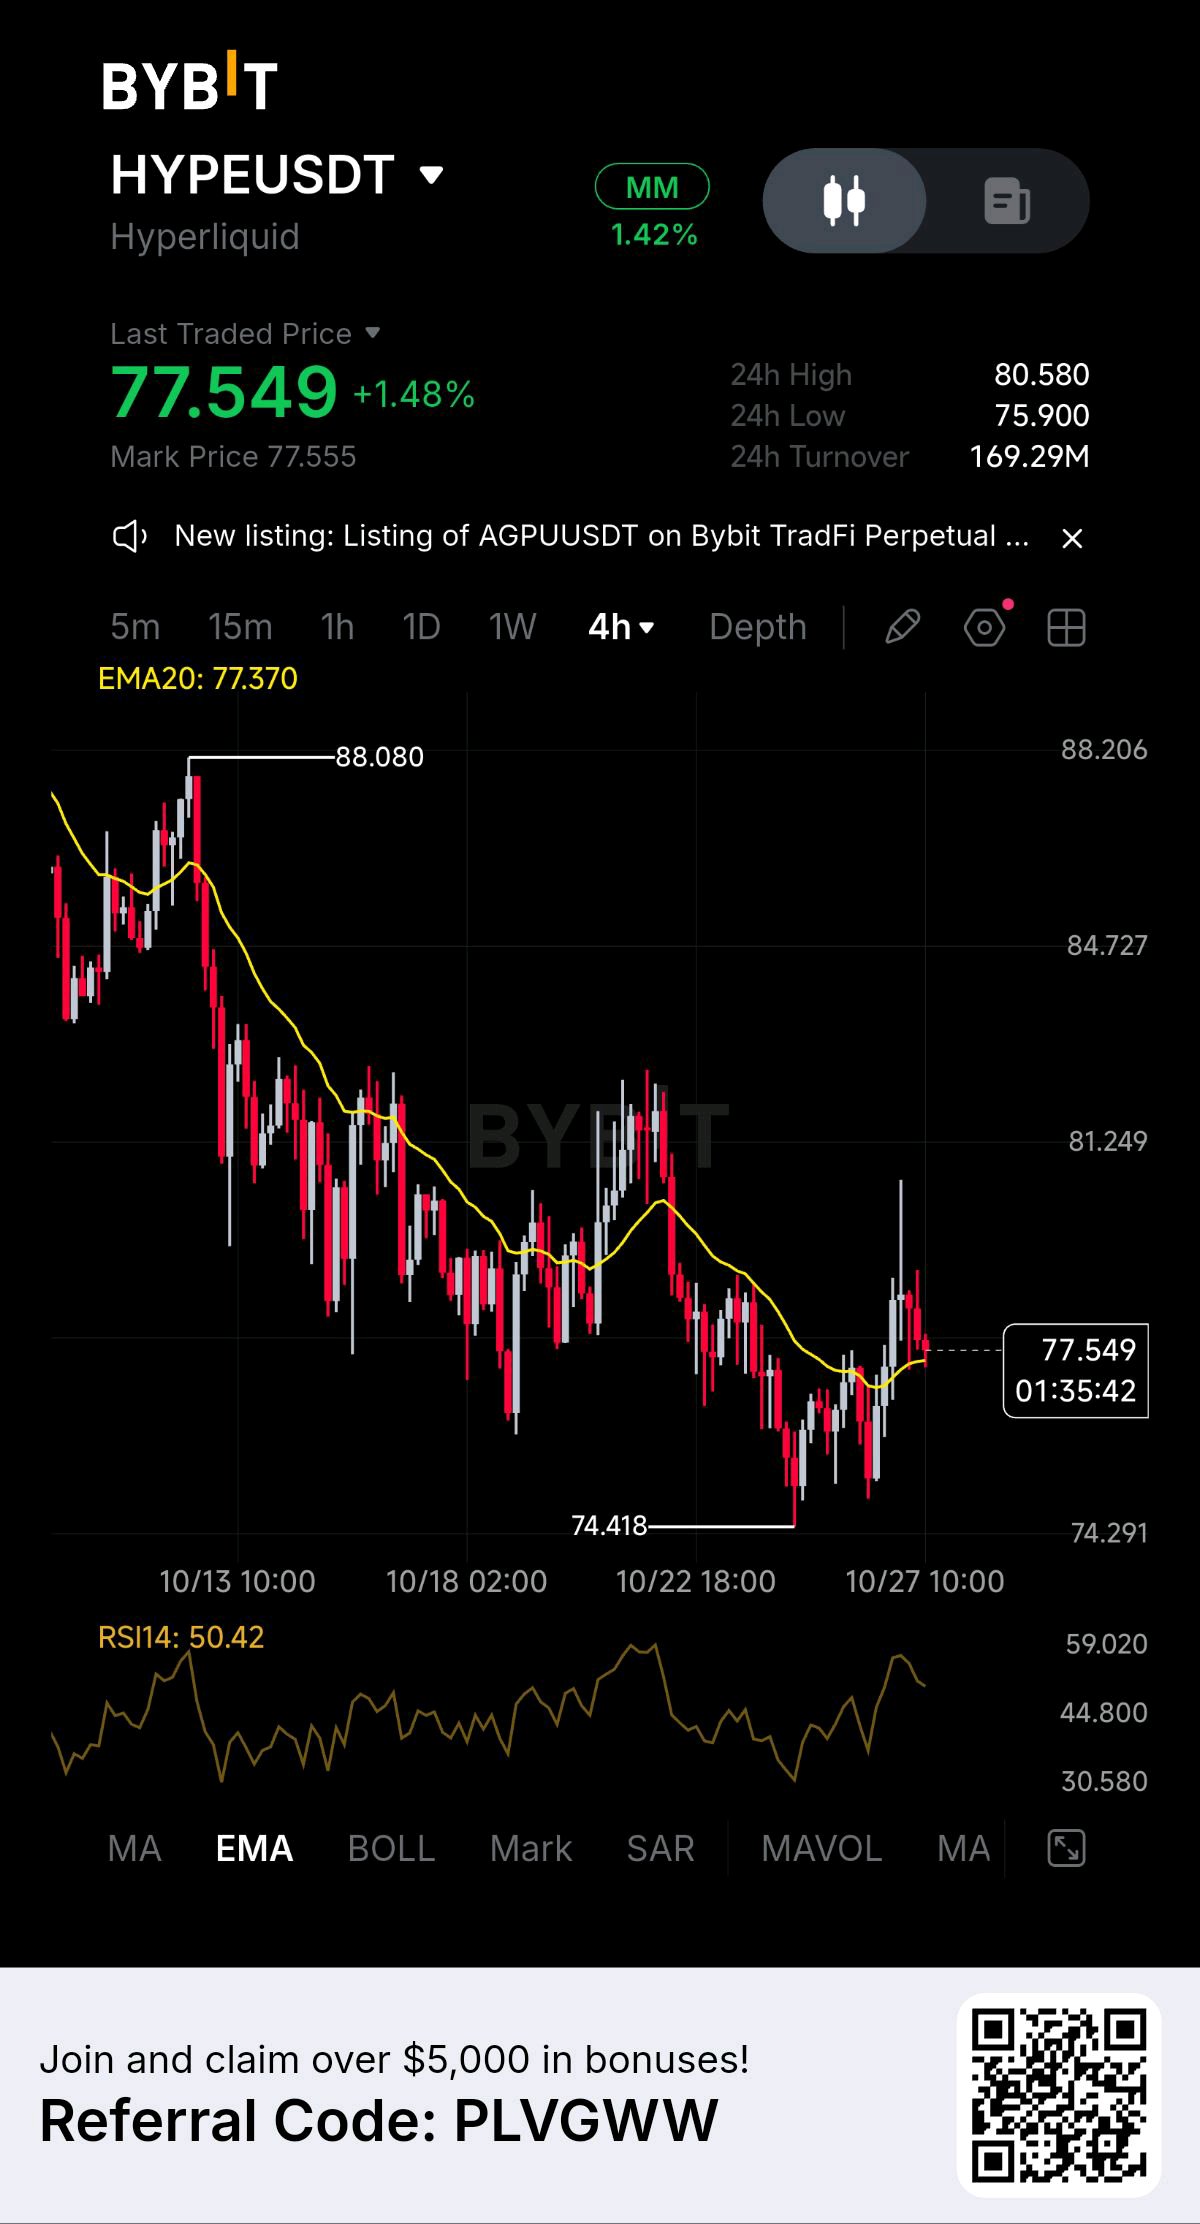
Looking at HYPE on the 4h, it's been in a downtrend since the 88 high, with lower highs the whole way down until buyers stepped in at 74.4. Since then it bounced to the 80.5 area, pulled back, and is now sitting right on the EMA20 at about 77.4. RSI is near 50, so momentum is neutral and nothing looks stretched. What I'm watching is whether it can hold above the EMA20 and push back toward 80.5. If it does, a move into the mid 80s is possible. If it loses the EMA and slips under 75.9, I'd expect a retest of the 74.4 low, and a break below that would kill the bounce idea. I opened a long around 77.5, so 74.4 is my line. Just my read, not financial advice. #IMPACTbyTrade #MyByXTake $HYPEUSDT

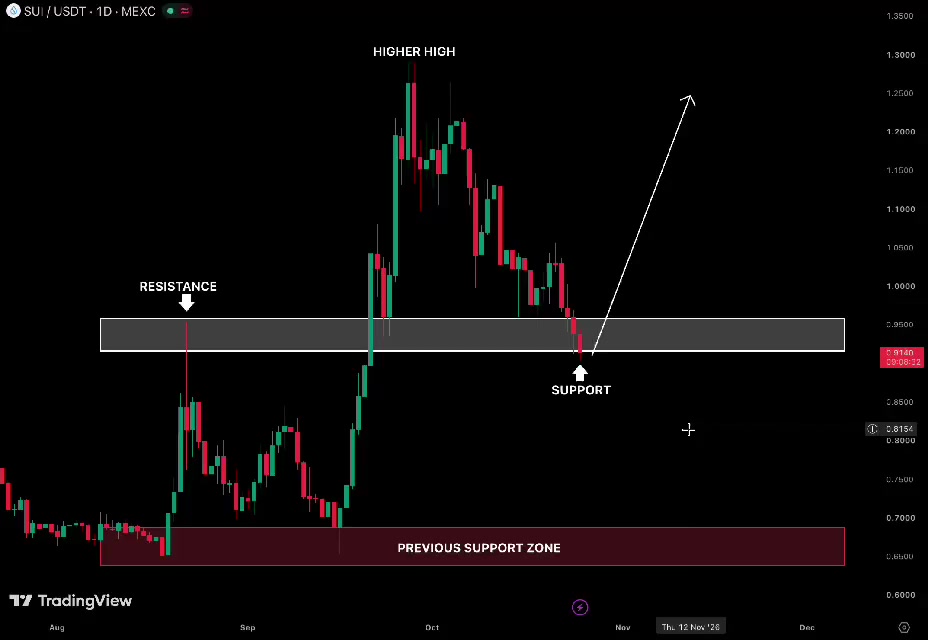
SUI is testing the breakout zone again This was resistance before, and now bulls need to prove it can hold as support If it does, a bounce toward $1.10 and potentially $1.25 wouldn’t surprise me Let’s see if buyers actually show up or if this level was just temporary support #IMPACTbyTrade #MyByXTake #WSOT2026 $SUIUSDT $SUIUSDC
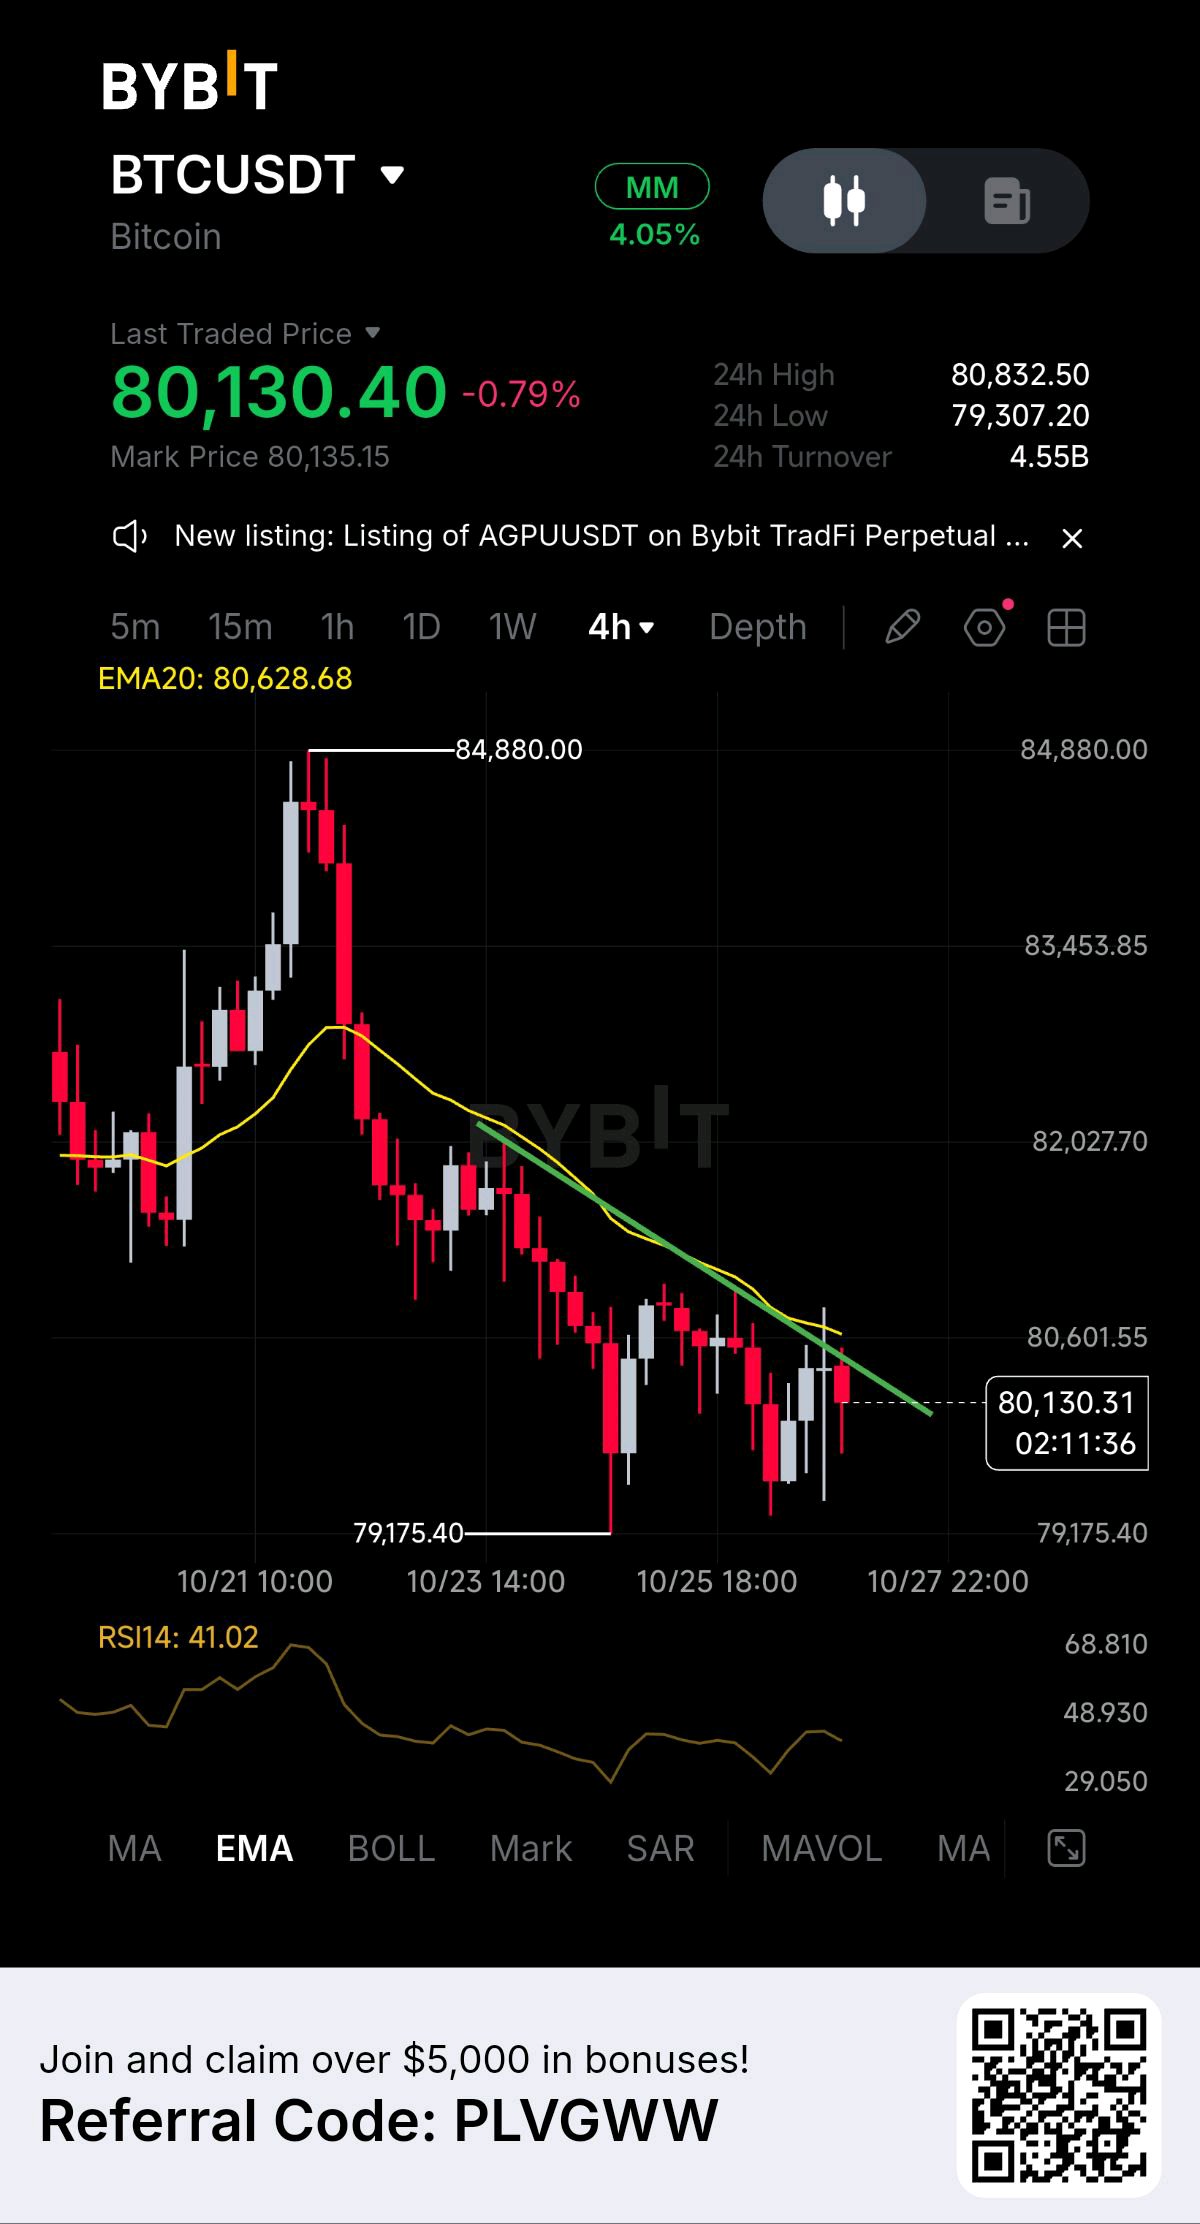
BTC: Buyers are trying but the trend hasn’t turned yet. 👀 BTC is trading around $80,130 on the 4H chart. After getting rejected near $84,880, the price has continued to make lower highs, and the latest bounce still looks a bit weak. Here’s what I’m watching: 📊 Price: $80,130 📊 EMA20: $80,628.68 📊 RSI(14): 41.02 📊 24H High/Low: $80,832.50 / $79,307.20 BTC is still below the EMA20, while RSI remains under 50. Sellers have the advantage for now, although the price is approaching an area where buyers could try to defend. 🟢 Bullish scenario: BTC needs to reclaim $80,600–$80,800 and break above the descending trendline. If buyers manage that, a move toward $82,000 could come into focus. 🔴 Bearish scenario: Another rejection could send BTC back toward $79,300 and the recent chart low around $79,175. A clean breakdown below that area would weaken the structure further. Personally, I’m not rushing to call a bottom here. I want to see BTC reclaim resistance before getting confident about a recovery. Will BTC break this downtrend or are we heading for another support test? 👀 DYOR. Not financial advice. #IMPACTbyTrade #MyByXTake #MidtermsMarketWatch $BTCUSDT $BTCUSDC
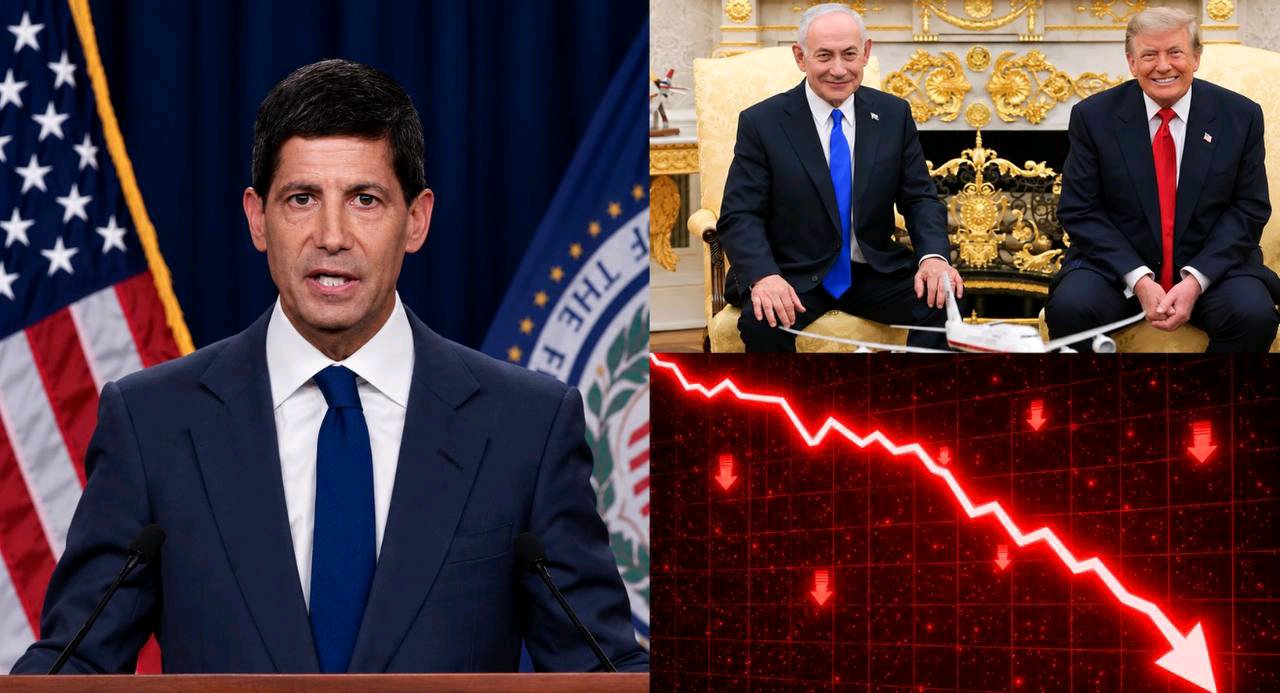
🚨 THE NEXT 10 DAYS COULD BE BRUTAL FOR GLOBAL MARKETS. Several major events are about to happen at the same time, and even one bad outcome could trigger a massive sell off across stocks, crypto, and precious metals. 1. Major central bank meetings • Oct 28: Federal Reserve meeting • Oct 30: Bank of Japan meeting • Nov 5: Bank of England meeting These three central banks could signal tighter monetary policy as rising energy prices threaten another inflation shock. If they turn hawkish, higher borrowing costs could put even more pressure on global markets. 2. Two major elections • Oct 27: Israel's election • Nov 3: U.S. midterm elections Both countries are involved in the conflict with Iran, and the election results could influence how their governments handle the war. Any further escalation could push oil prices higher, making inflation even harder to control. 3. Major tech earnings Google, Microsoft, Amazon, and dozens of other major companies will report earnings over the coming days. With growing concerns about massive AI spending, disappointing results could trigger another major sell off in tech stocks and drag down the broader market. 4. U.S. inflation and GDP data Fresh economic data will show whether inflation is getting worse while the economy is slowing. Hotter inflation could send bond yields higher again, increasing pressure on stocks, mortgages, and businesses already struggling with borrowing costs. Now imagine several of these events going against the market within just a few days. Higher oil prices, hawkish central banks, weak economic data, and disappointing earnings could trigger selling across multiple markets at once. However, there's one reason I'm getting more bullish. Crypto markets often react badly to uncertainty, and right now investors are facing several major events without knowing how they will turn out. Once these events are over and the market has priced in the results, that uncertainty will fade. Crypto has already been outperforming several other major assets since Q3, and once the uncertainty goes away, crypto could continue its uptrend with a strong recovery. The next 10 days could bring serious downside volatility, but they could also provide a good buying opportunity in crypto before the next major rally. #IMPACTbyTrade $BTCUSDT $ETHUSDT
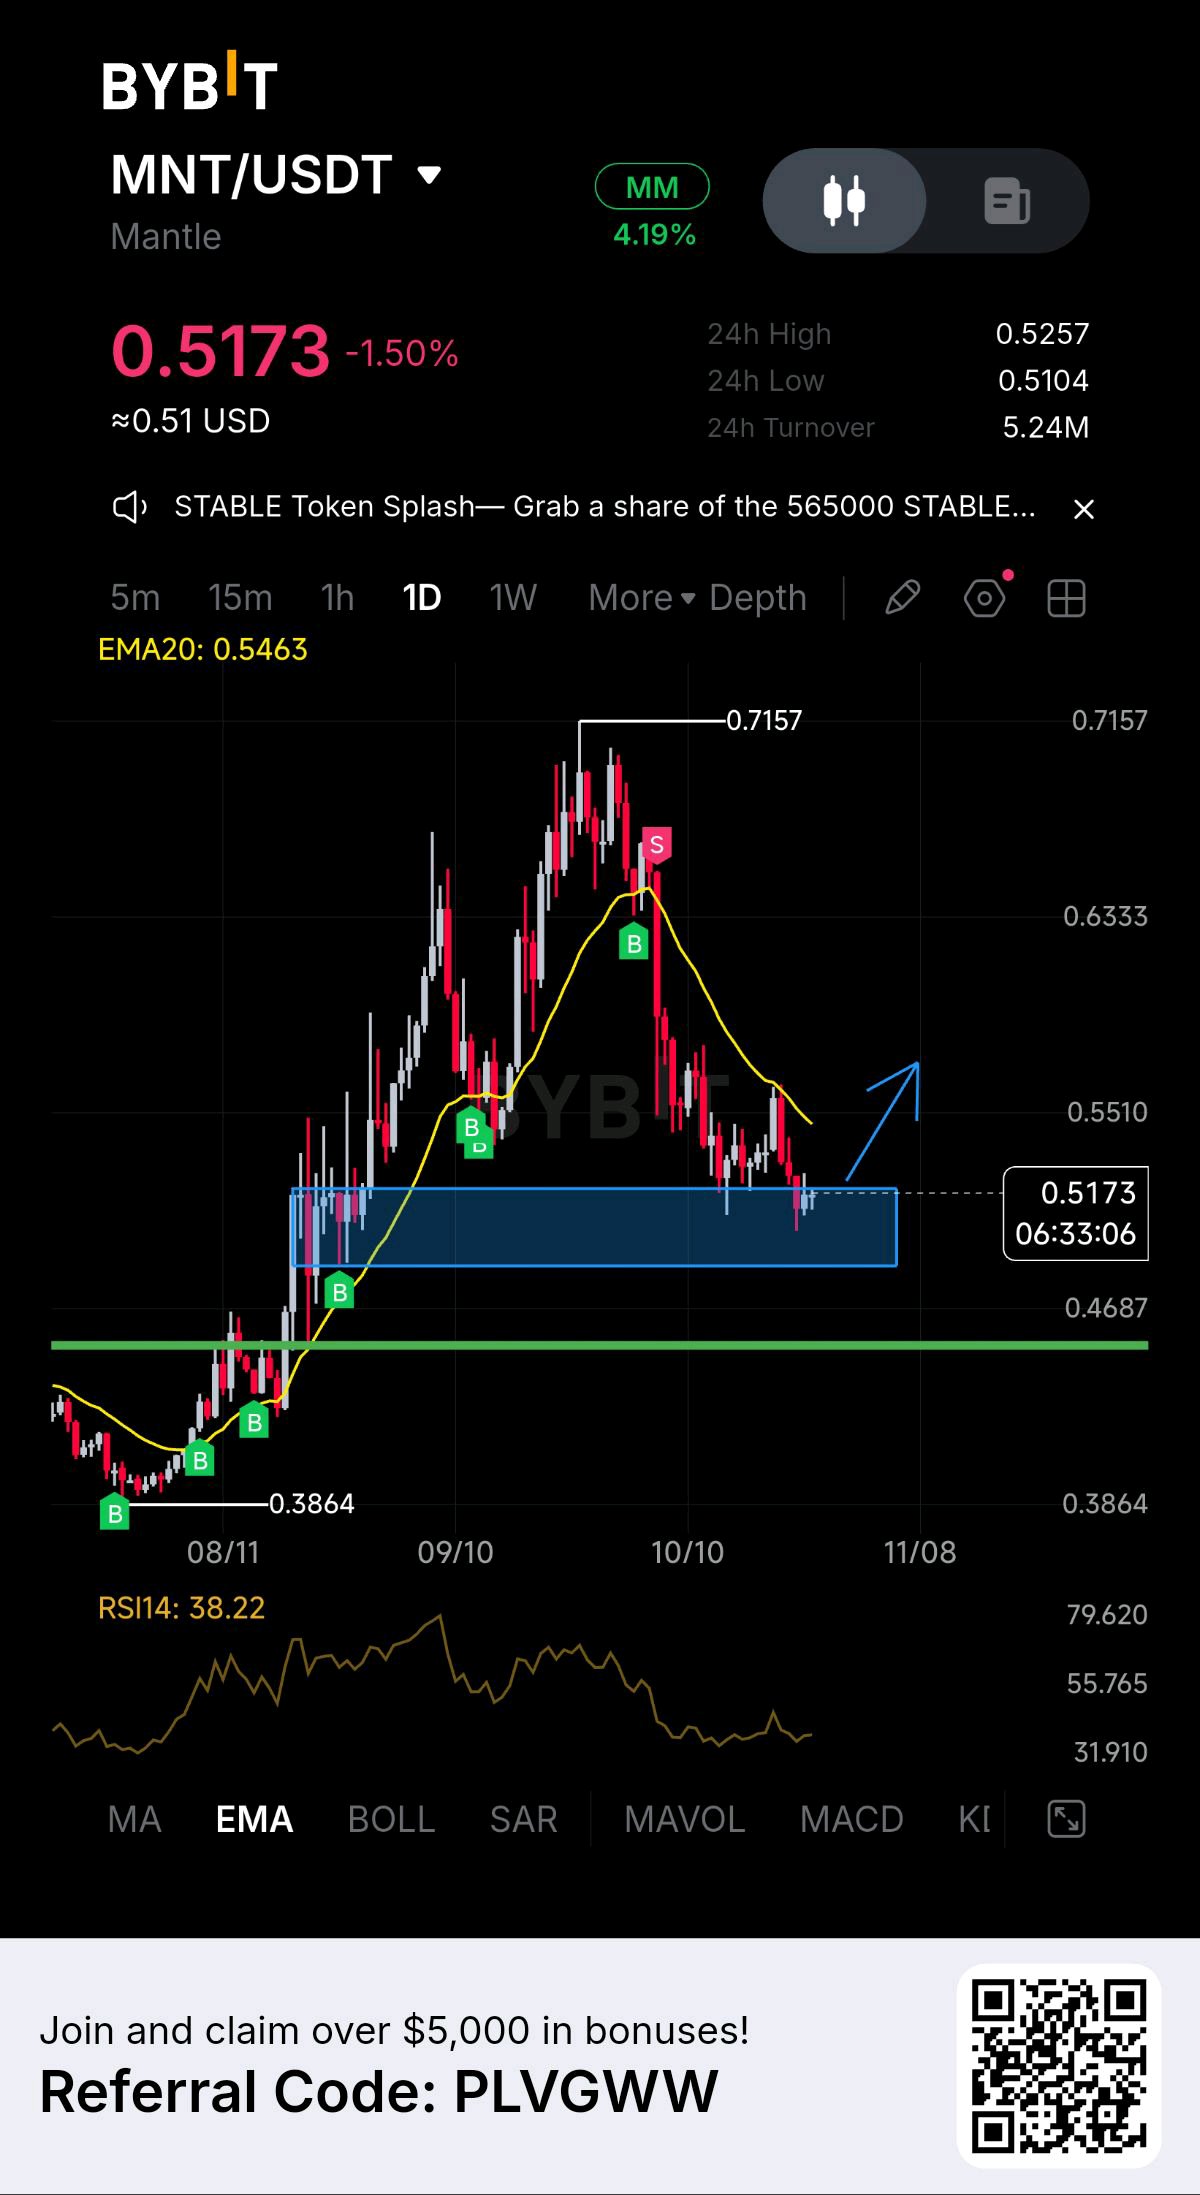
MNT is sitting at a pretty important level right now. 👀 MNT is trading around $0.5173, and after dropping from the $0.7157 high, it’s now testing the support zone marked on the daily chart. Here’s what I’m noticing: 📊 Price: $0.5173 📊 EMA20: $0.5463 📊 RSI(14): 38.22 The price is still below the EMA20, and RSI is showing that momentum has been weak. But MNT is approaching an area where buyers could try to step in. 🟢 If buyers defend this zone: We could see a bounce toward $0.546 first. If price gets back above that level, a move toward $0.55 and higher becomes more interesting. 🔴 If support breaks: Things could get ugly, with $0.45 as a potential area to watch next. Personally, I’m keeping an eye on how price reacts here. A bounce would be encouraging, but I’d like to see buyers actually show some strength before getting too bullish. For now, it’s a wait-and-see situation. 👀 Do you think MNT will bounce from here or is there more downside ahead? DYOR. Not financial advice. #IMPACTbyTrade #WSOT2026 #MyByXTake $MNTUSDT $MNTBTC
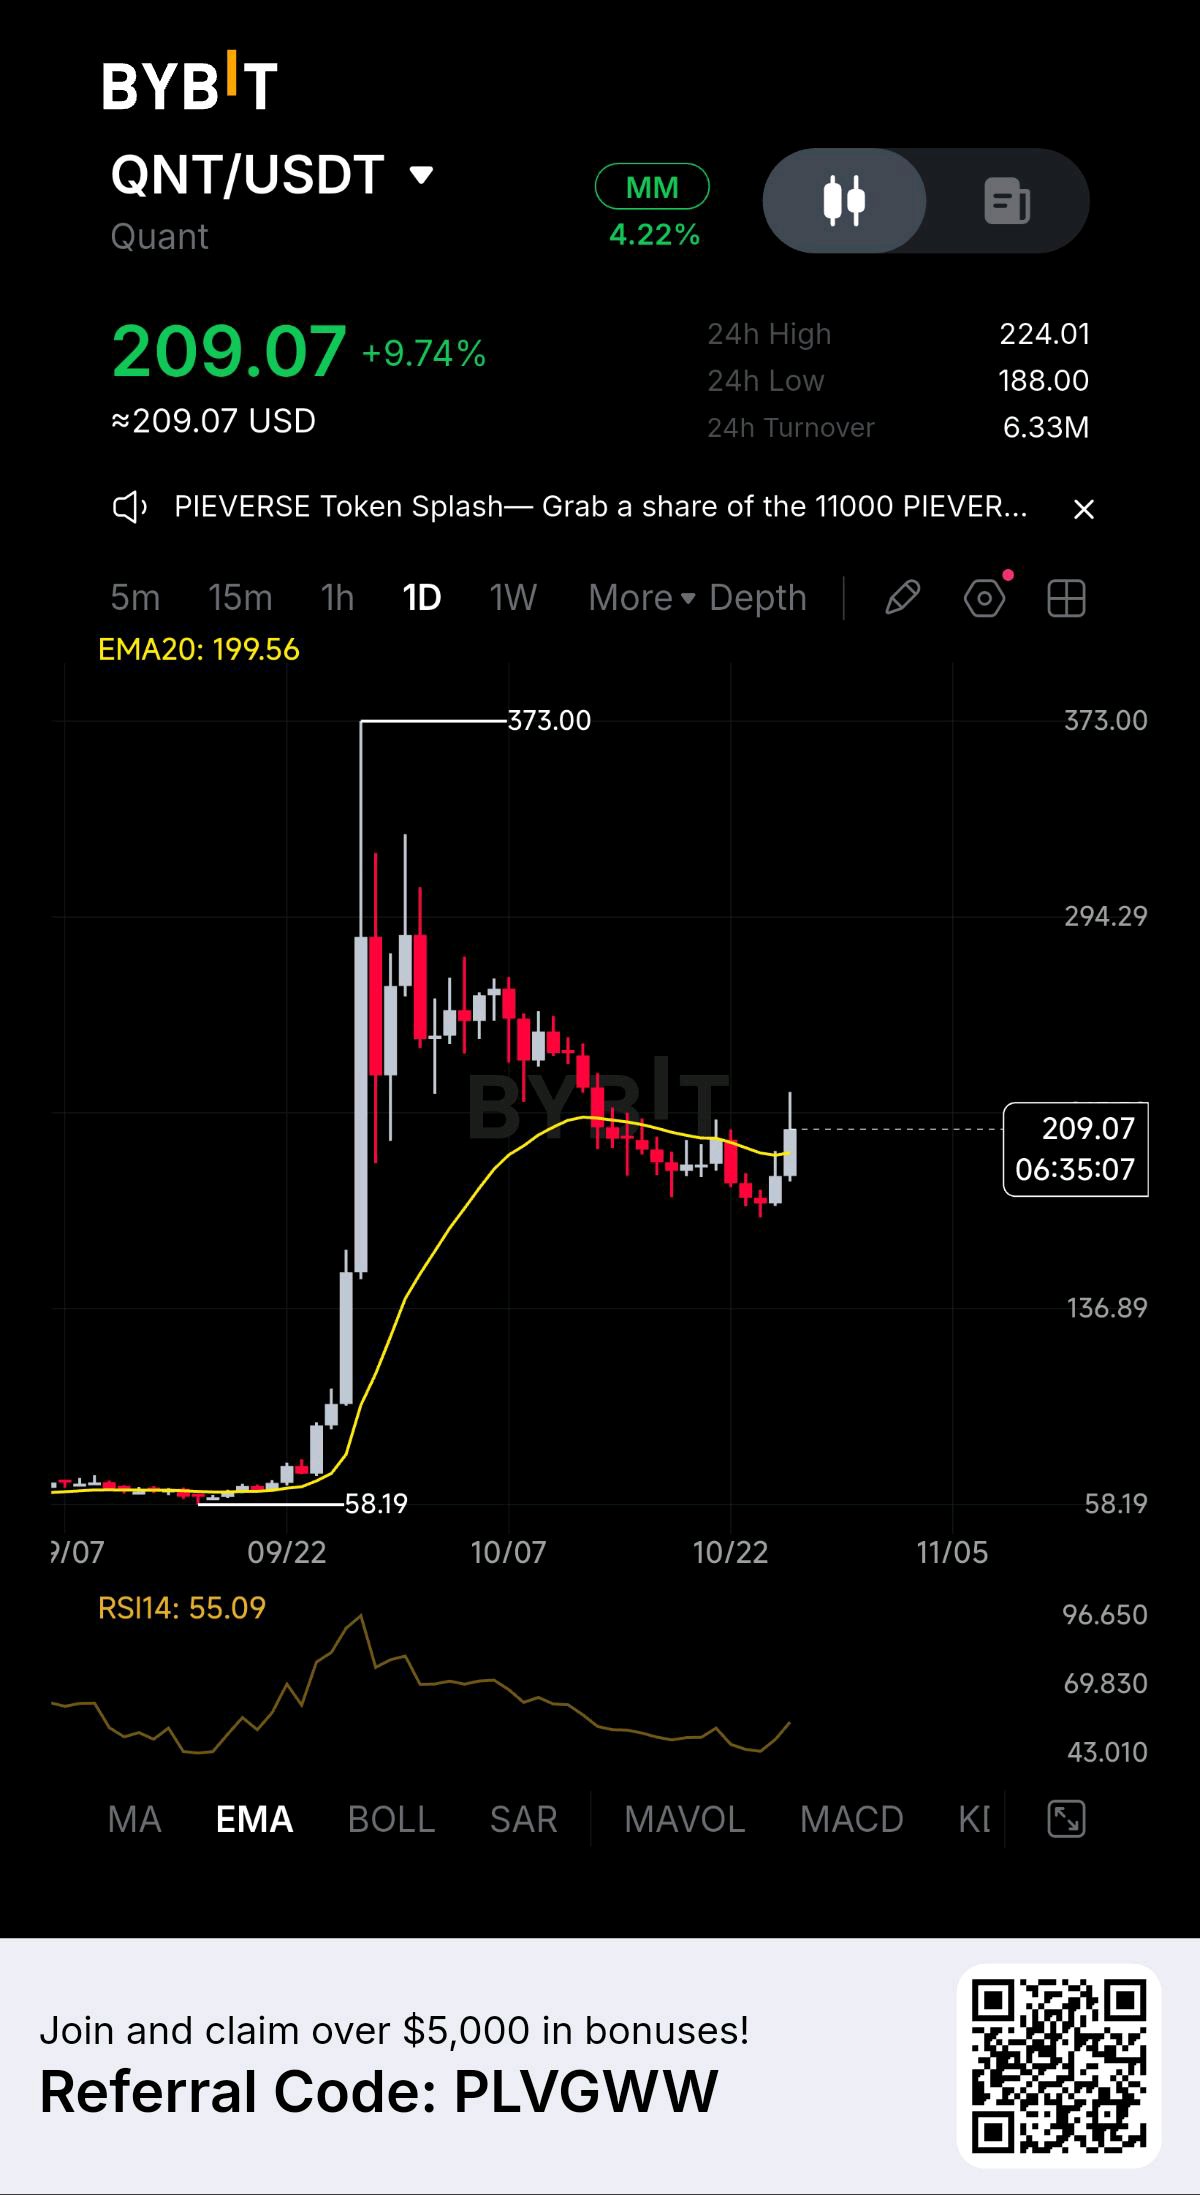
QNT is showing signs of a recovery 👀 QNT is up 9.74%, trading around $209.07 on the daily chart. After a long pullback from the $373 high, buyers are finally trying to push the price back up. Here’s what caught my attention: 📊 Price: $209.07 📊 EMA20: $199.56 📊 RSI(14): 55.09 📊 24H High/Low: $224.01 / $188.00 Price is back above the EMA20, and RSI has climbed above 50. That’s encouraging, but one green move doesn’t mean the downtrend is over. 🟢 Bullish scenario: If QNT holds the $199–$200 area and pushes through $224, I’ll be watching for further recovery toward the $240–$250 zone. 🔴 Bearish scenario: If the price falls back below the EMA20, $188 is the first level I’d watch. Losing that support could put more pressure on the recovery. For now, I’m interested in whether QNT can hold above $200 and build on this bounce. The next few daily candles should tell us more. Is this the start of a proper recovery or just a relief bounce? 👀 DYOR. Not financial advice. #MyByXTake #IMPACTbyTrade #WSOT2026 $QNTUSDT
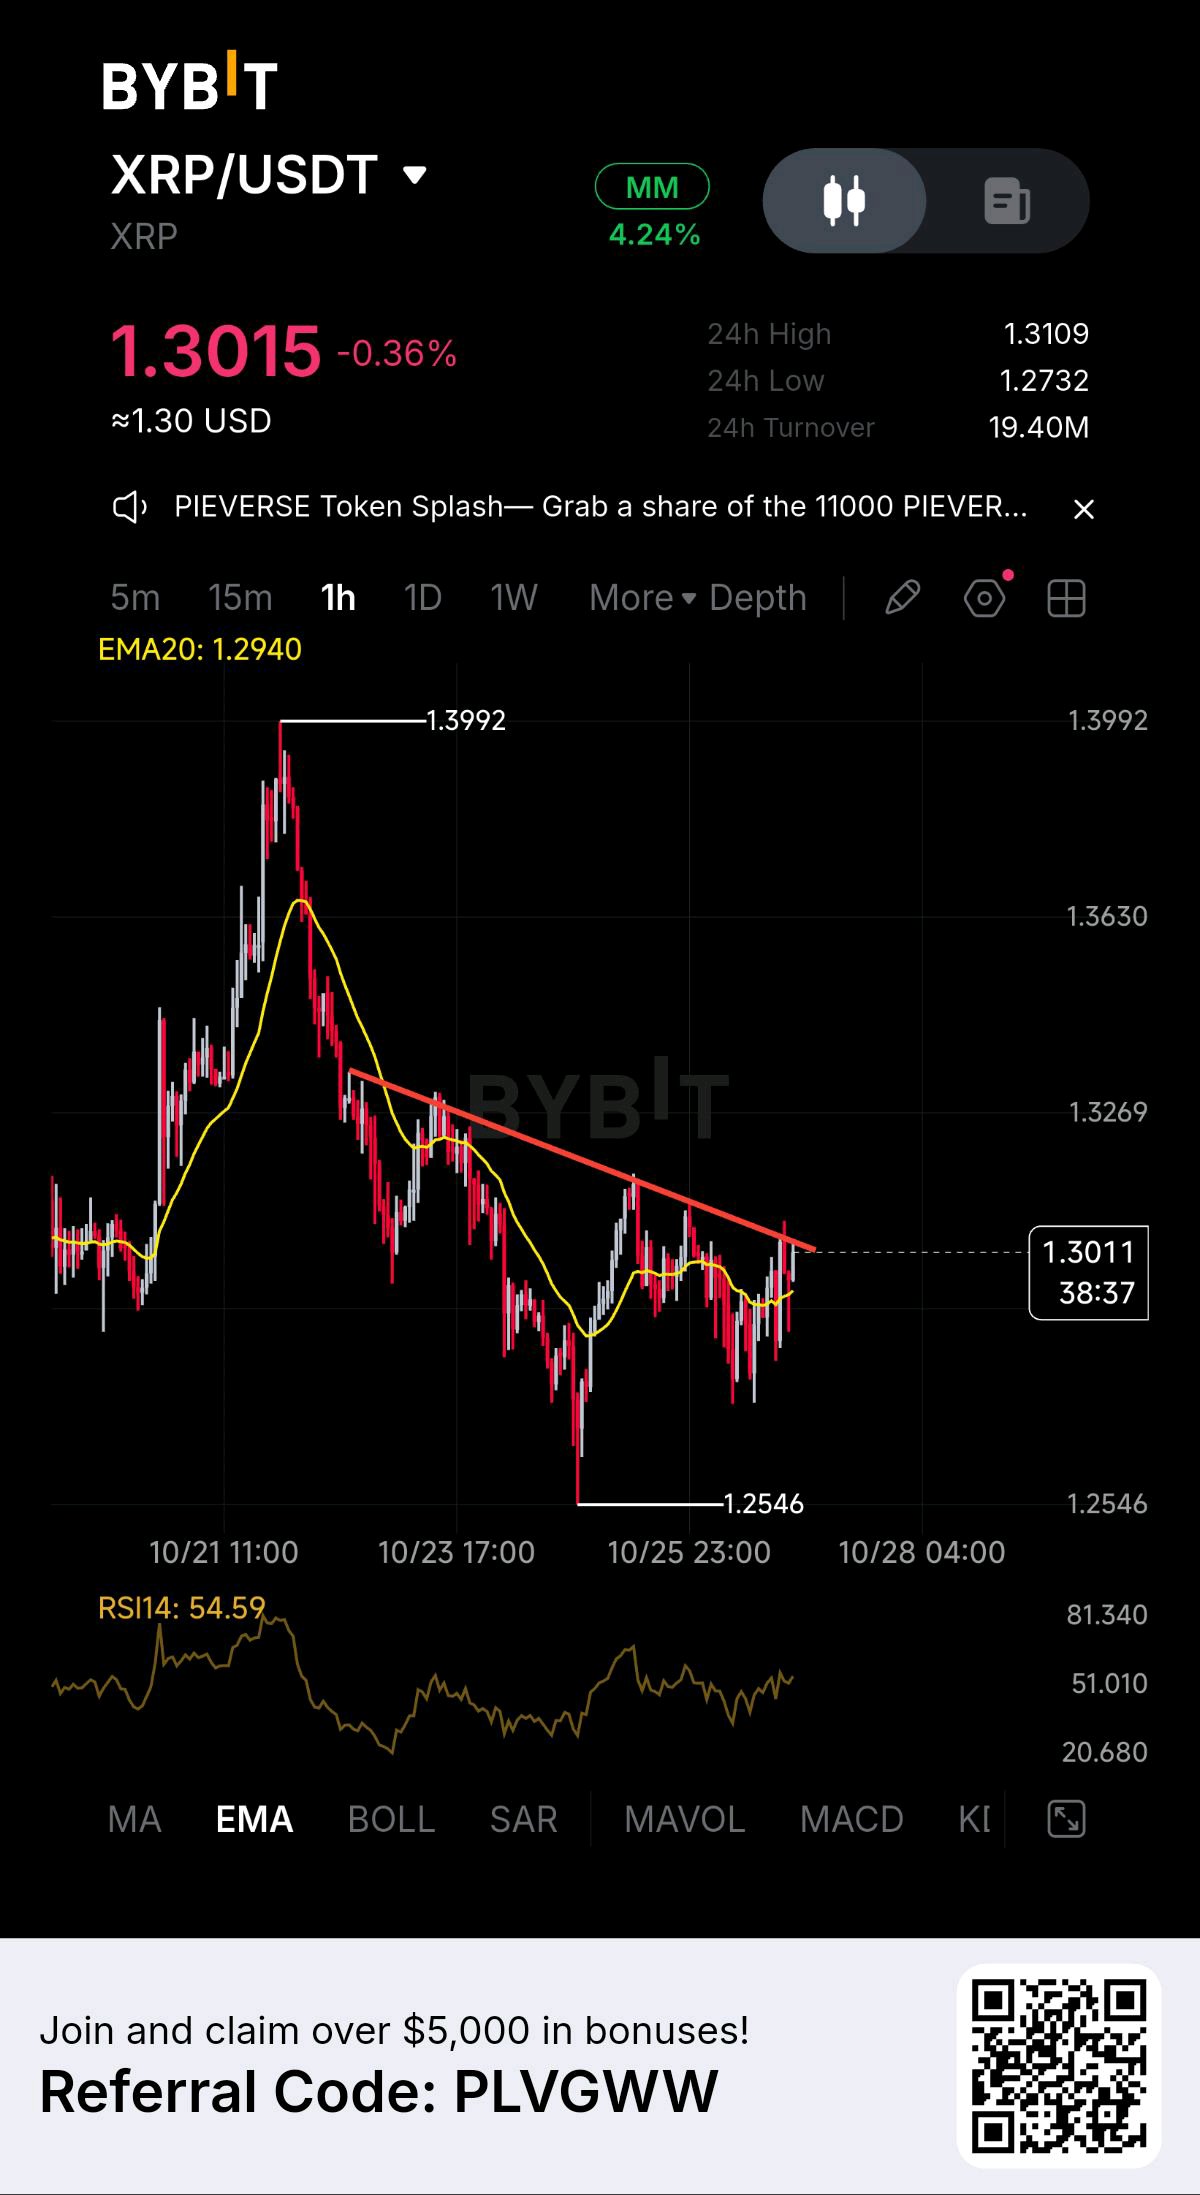
XRP is approaching a key resistance 👀 XRP is trading around $1.3015 on the 1H chart. After dropping from the $1.3992 high, the price has been making lower highs, but buyers are trying to push it back up. Here’s what I’m watching: 📊 Price: $1.3015 📊 EMA20: $1.2940 📊 RSI(14): 54.59 📊 24H High/Low: $1.3109 / $1.2732 XRP is back above the EMA20, and RSI is above 50. That’s encouraging, but the descending trendline is still standing in the way. 🟢 Bullish scenario: A clean break above the trendline, followed by a move through $1.3109, could open the way toward $1.3269. 🔴 Bearish scenario: If XRP gets rejected here and loses $1.2940, I’ll be watching $1.2732, with $1.2546 as the next major downside level on the chart. For me, the trendline is the level to watch. I want to see buyers break it and hold above it before getting too confident. Will XRP finally break this downtrend or are sellers still in control? 👀 DYOR. Not financial advice. #IMPACTbyTrade #MyByXTake #WSOT2026 #FOMCRateDecision #MidtermsMarketWatch $XRPUSDT $XRPUSDC
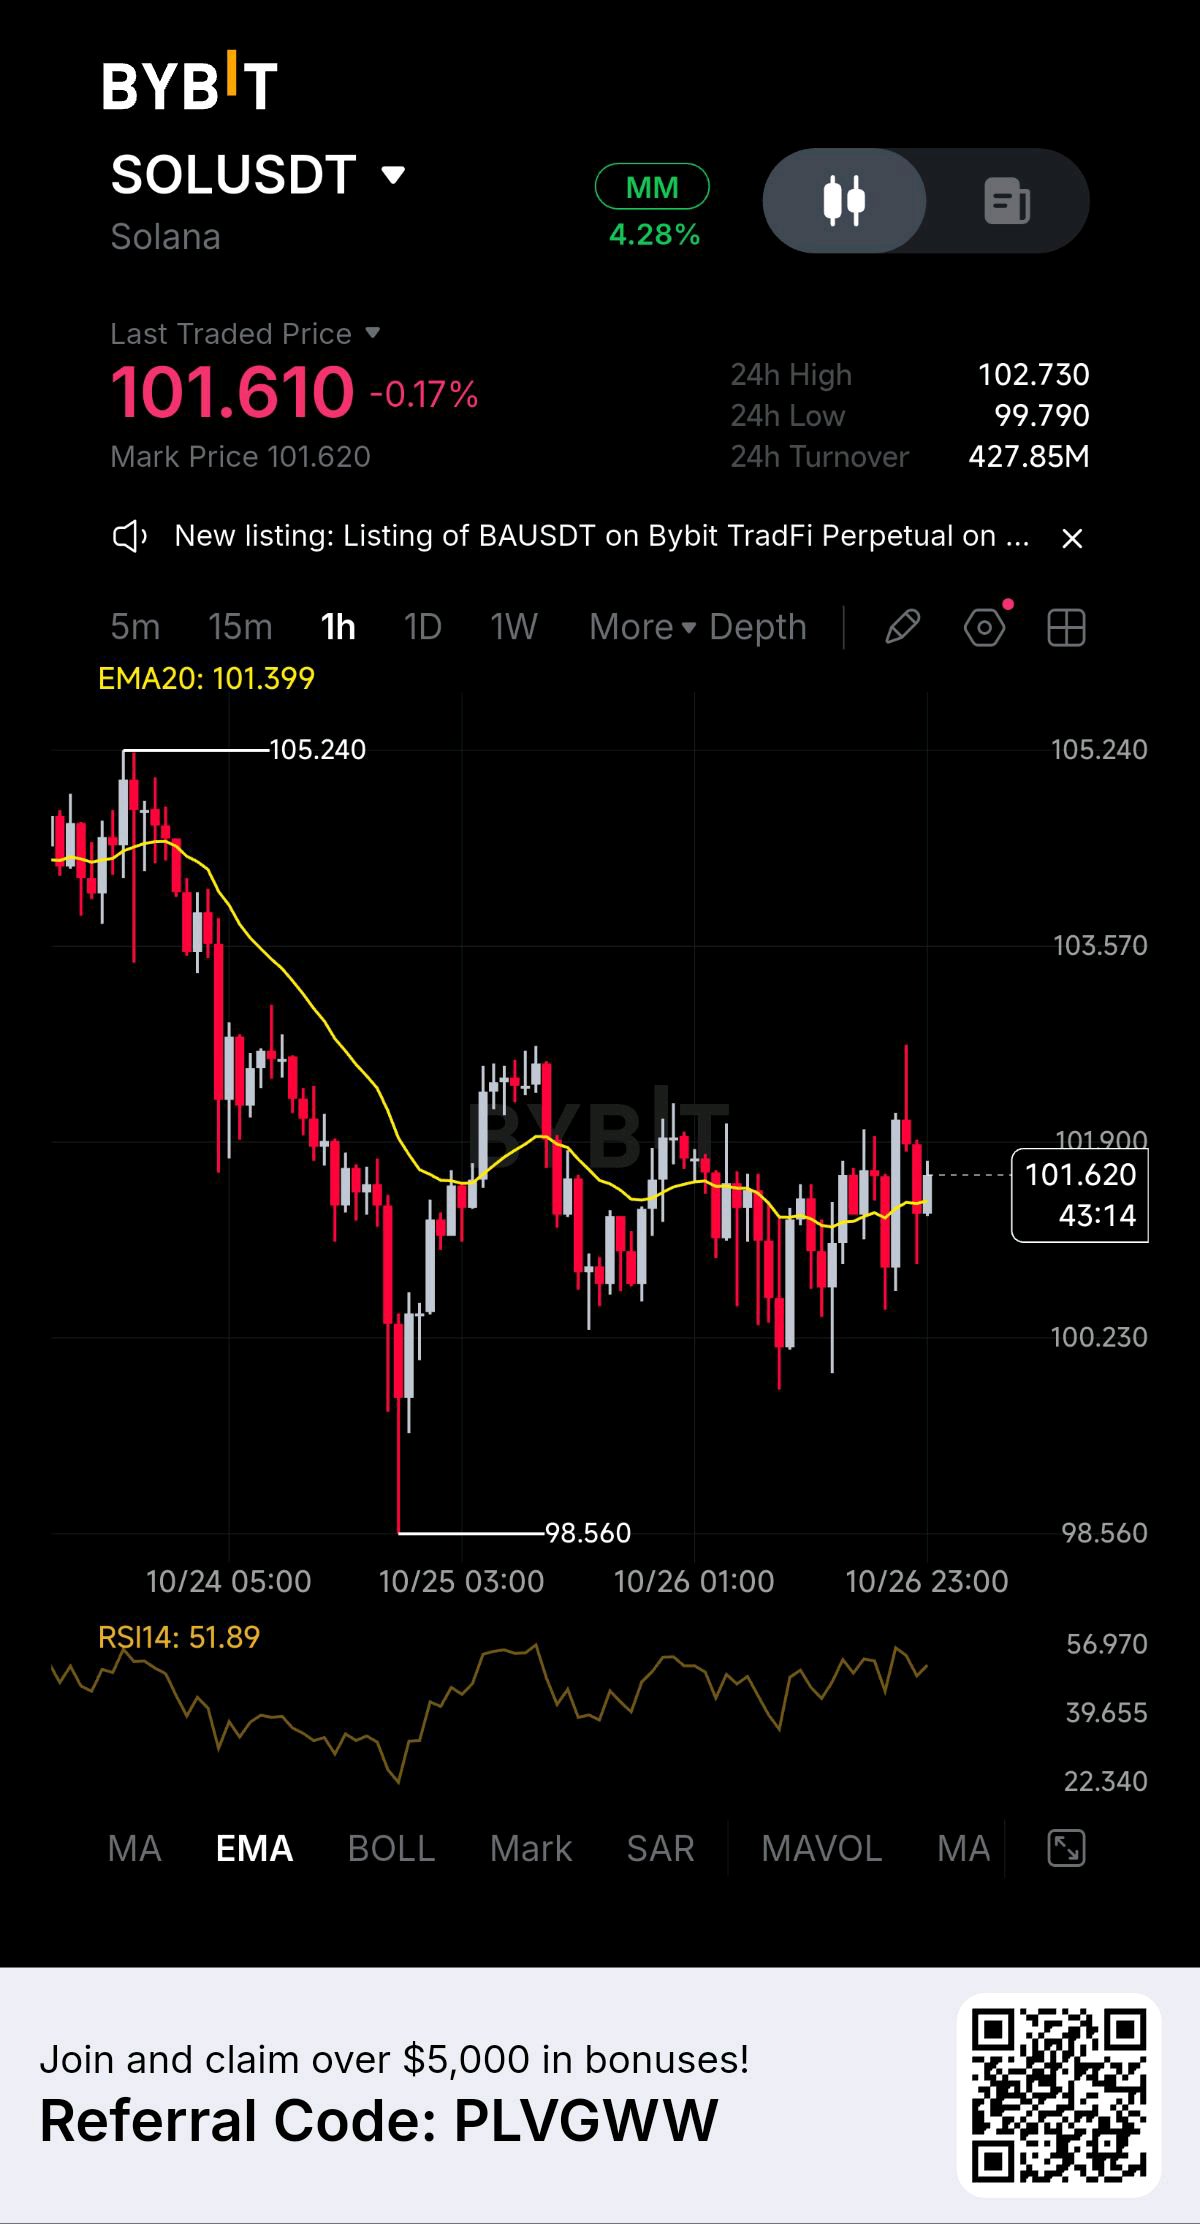
Can SOL finally find some direction? 👀 SOL is trading around $101.61 on the 1H chart, and honestly, the price action still looks pretty choppy after that sharp drop from above $105. Here’s what caught my attention: 📊 Price: $101.61 📊 EMA20: $101.399 📊 RSI(14): 51.89 📊 24H High/Low: $102.73 / $99.79 SOL is back slightly above the EMA20, and RSI is sitting just above 50. That’s a small improvement, but not enough to call it a bullish reversal yet. 🟢 Bullish side: If SOL holds around $101.30–$101.40 and pushes through $101.90, I’ll be watching $102.73 next. A clean break above that could give buyers more room to work with. 🔴 Bearish side: If SOL loses the $101 area, a retest of $100.20–$99.79 becomes possible. Below that, $98.56 is the key low on this chart. For now, SOL looks more like it’s consolidating than choosing a clear direction. I’d rather wait for a proper breakout than guess which way the next move will go. $102.73 is the level I’m watching. Can buyers reclaim it? DYOR. Not financial advice. #IMPACTbyTrade #MyByXTake #WSOT2026 $SOLUSDT $SOLUSDC
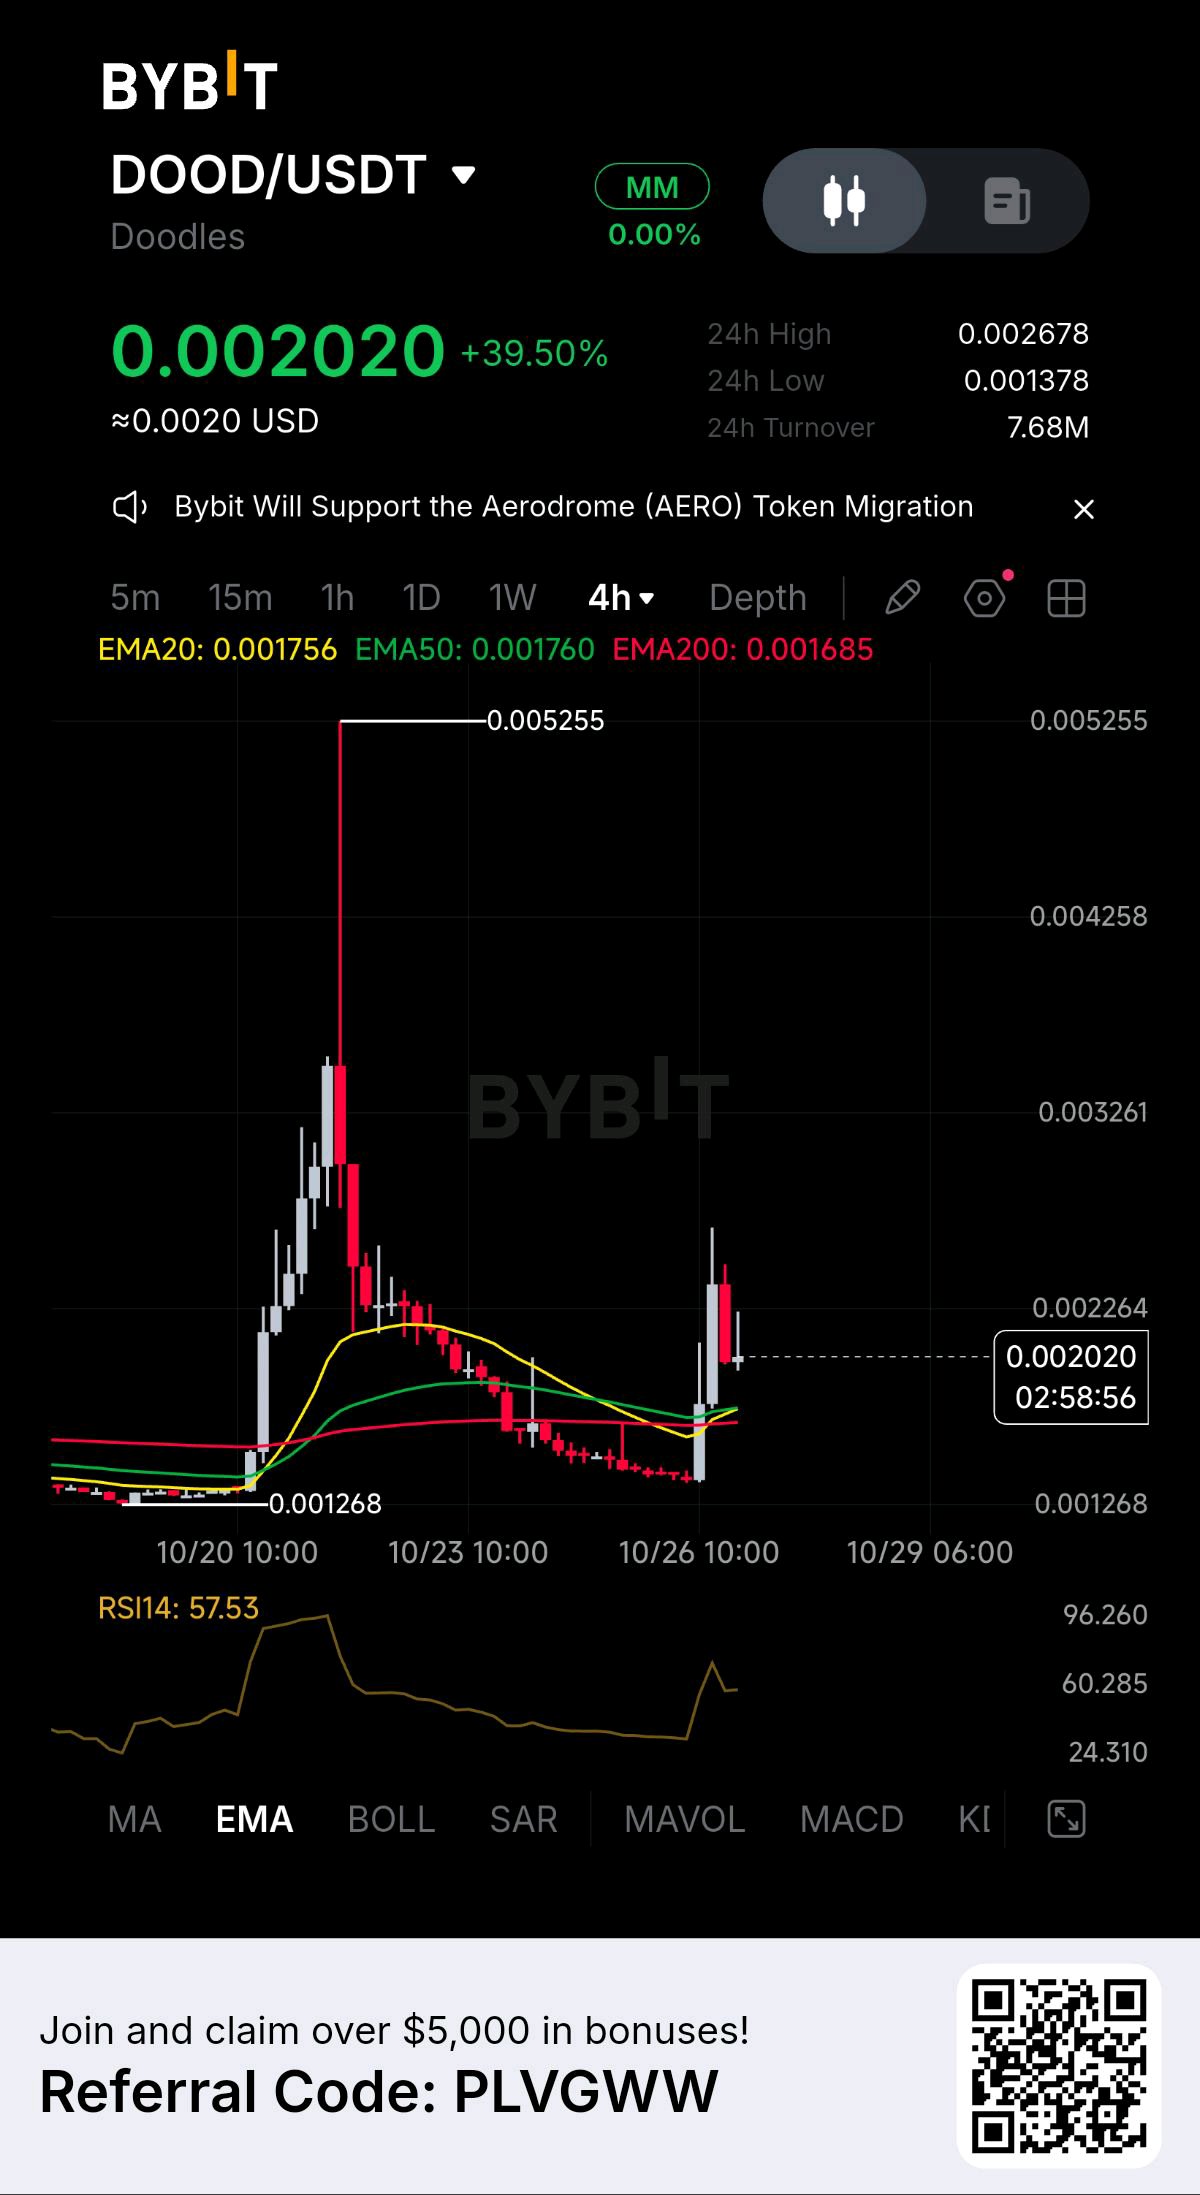
DOOD is up nearly 40%, but that huge wick tells an interesting story. 👀 The 4H chart shows a sharp move from the $0.0013 area, followed by a strong rejection from higher levels. Price is now around $0.00202, so I’d be careful about chasing this pump. Here’s what I’m watching: 📊 EMA20: $0.001756 📊 EMA50: $0.001760 📊 EMA200: $0.001685 📊 RSI: 57.53 The good thing is that price is back above all three EMAs and RSI is holding above 50. That suggests momentum has improved. But after such a sharp move, volatility can go both ways. 🟢 Bullish scenario: If DOOD holds the $0.00175–$0.00180 area and buyers return, the $0.00226 zone is the first major resistance to watch. A clean break could open the door to another attempt higher. 🔴 Bearish scenario: If the price loses the EMA support zone, a pullback toward $0.00168 or even $0.00138 becomes possible. Personally, I’d rather wait for the price to settle and show some structure before making a move. A 39% pump looks exciting, but the follow-through matters more than the first candle. Can DOOD hold this breakout, or was that just a liquidity grab? 👀 DYOR. Not financial advice. #IMPACTbyTrade #MyByXTake #WSOT2026 #MidtermsMarketWatch $DOODUSDT
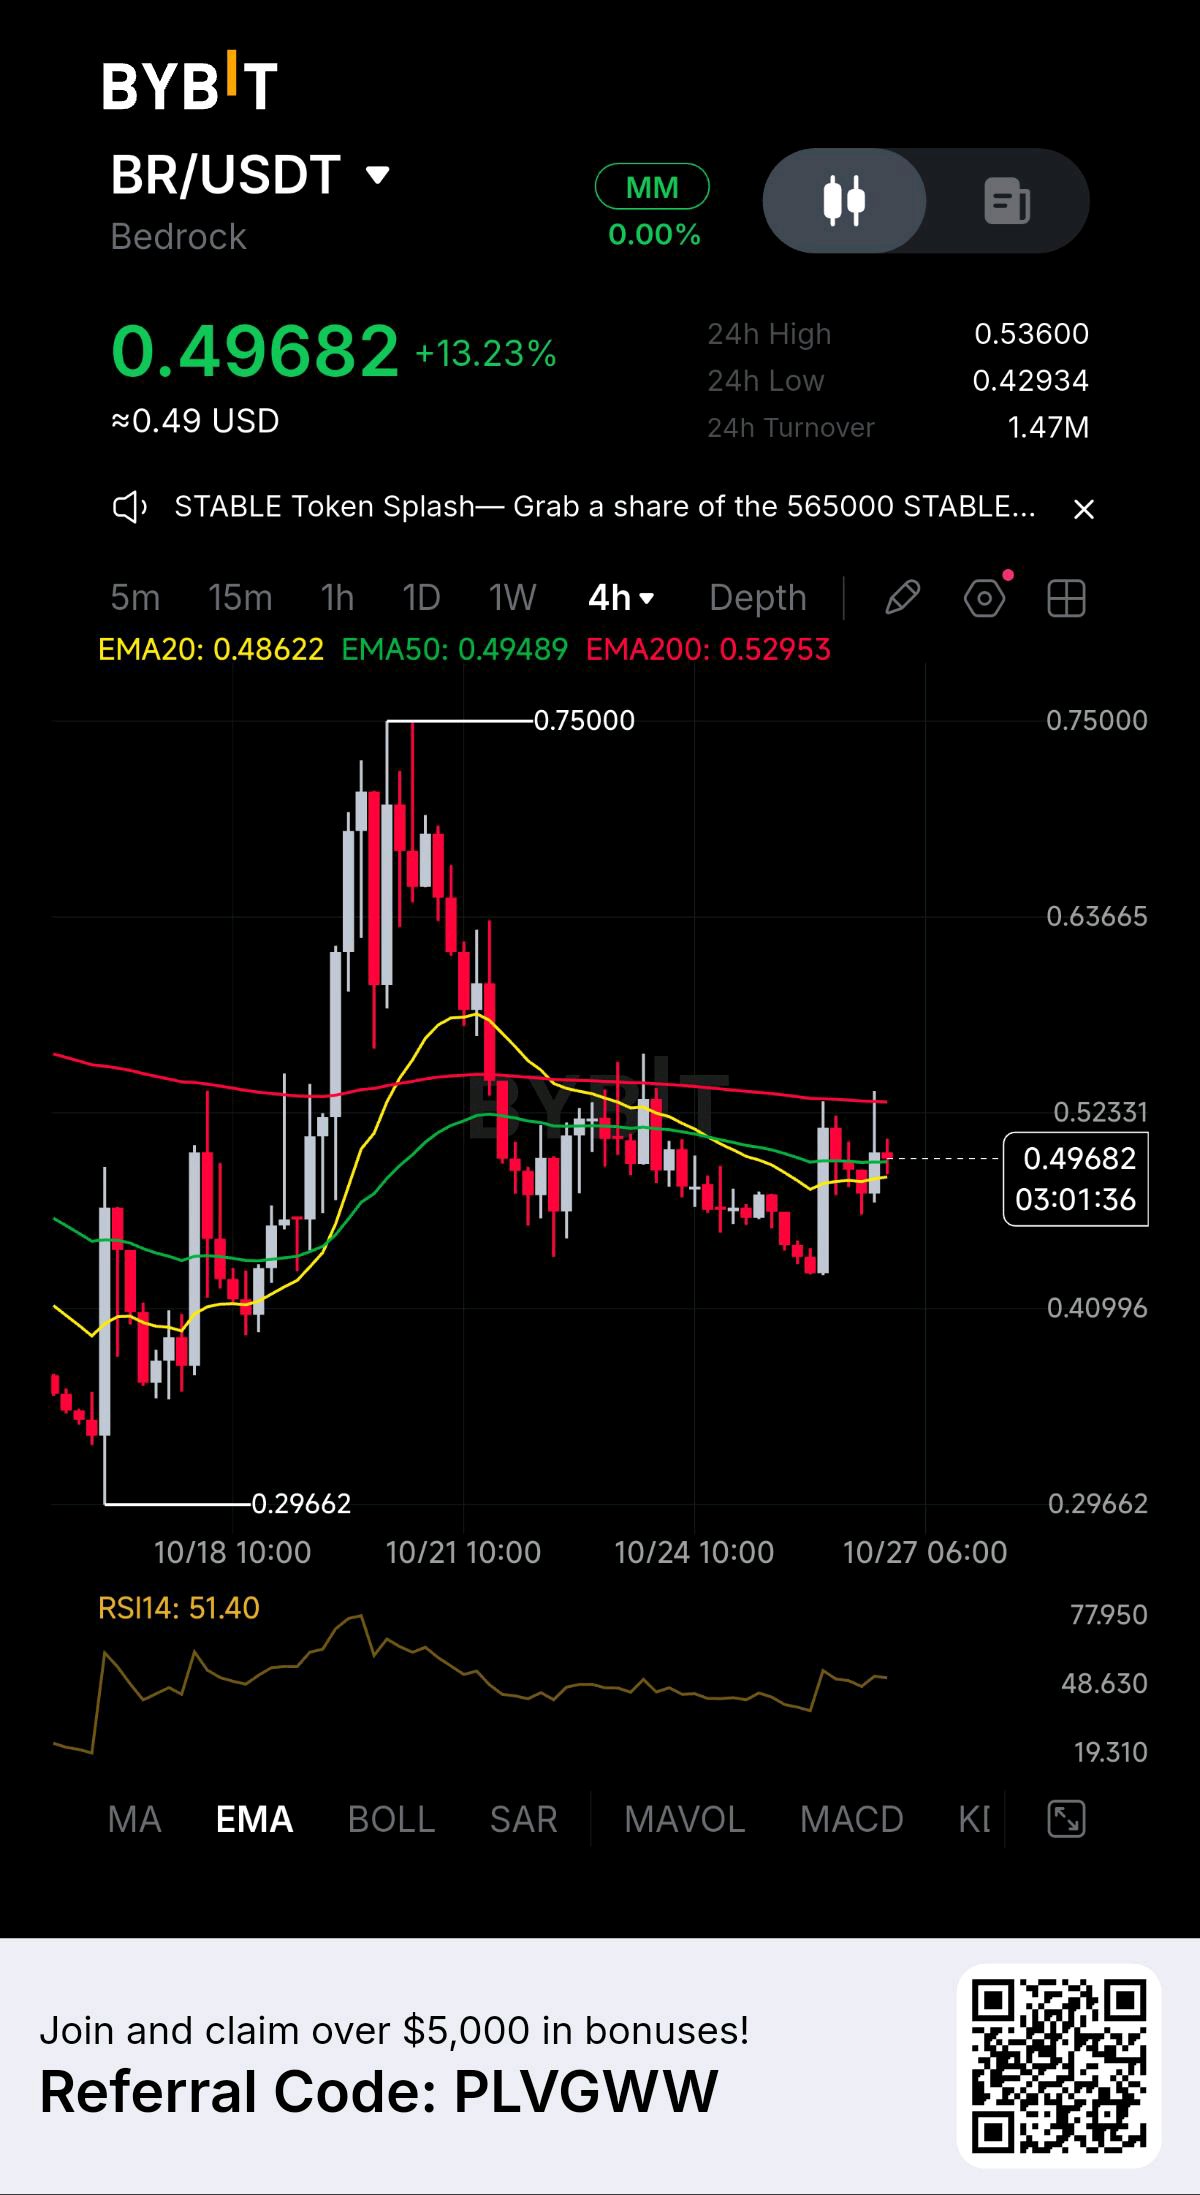
BR is starting to look interesting 👀 BR is up over 13% and sitting around $0.4968 on the 4H chart. The price has bounced nicely, but I’m still waiting to see if this move has enough strength to turn into a proper reversal. Here’s what I’m watching: 📈 Price is back above EMA20 ($0.4862) and EMA50 ($0.4949), which is a good sign for short-term momentum. ⚠️ The bigger challenge is EMA200 around $0.5295. BR still needs to break above that area to make the bullish case more convincing. Key levels to watch: 🟢 If BR breaks above $0.50–$0.505 and holds it, the next area to watch is $0.523–$0.530. 🔴 If it loses the $0.485 support zone, we could see a pullback toward $0.46–$0.47. If selling pressure continues, $0.429 could come back into play. RSI is around 51, so momentum is improving, but it’s not exactly screaming bullish yet. Personally, I wouldn’t chase the pump here. I’d rather wait for a clear breakout or a decent retest before making a move. $0.50 is the first hurdle. $0.53 is the real test. Let's see what BR does next. 👀 Not financial advice. Always manage your risk. #IMPACTbyTrade #MyByXTake #MidtermsMarketWatch #WSOT2026 $BRUSDT
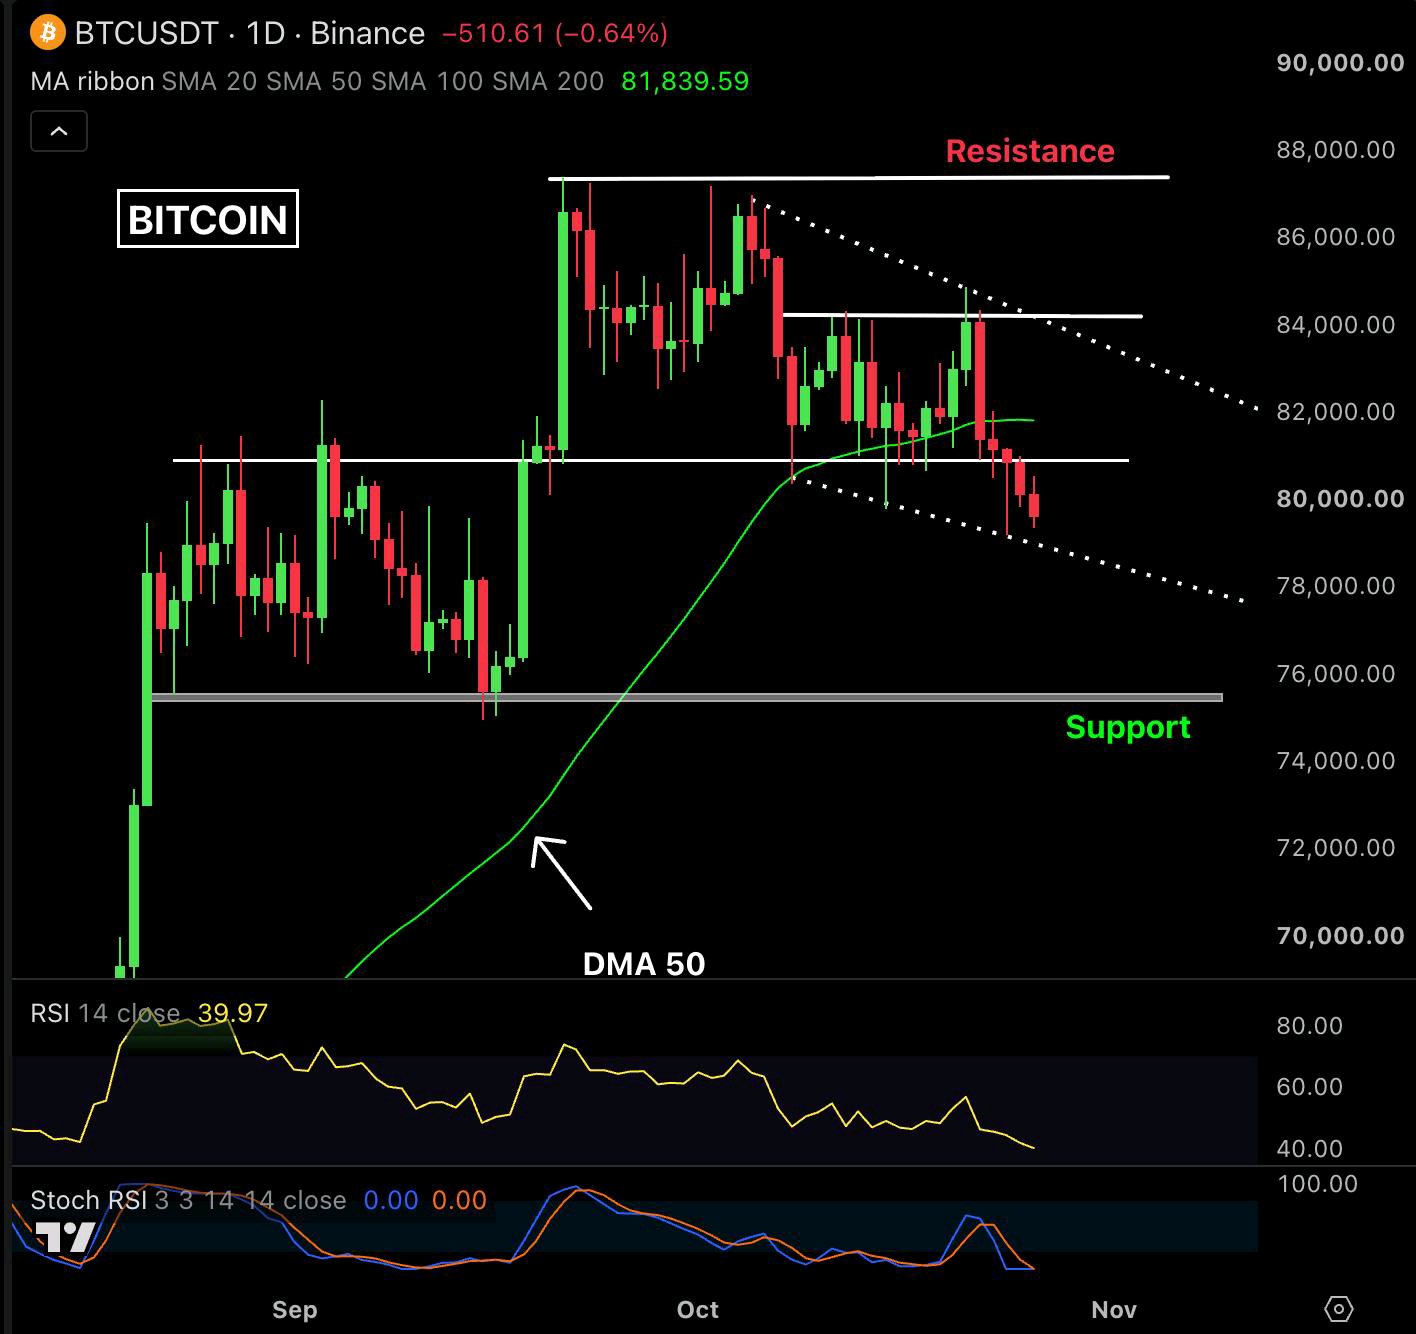
BITCOIN IS SHOWING SIGNS OF WEAKNESS. Bitcoin has been falling for the last five days, and the daily chart is looking weak. Price has dropped below the daily MA 50 near $81,800, and it needs to reclaim that level to keep the bullish case strong. For now, $84,800 and $87,500 are the resistance levels to watch, and the support is around $75,000. This week’s Israel election, FOMC decision, big tech earnings, U.S. PCE, GDP and midterm elections could all drive volatility. If $BTC gets back above the daily MA 50, things could start looking better. A move above $85,000 would be another positive sign. #IMPACTbyTrade #MyByXTake #MidtermsMarketWatch $BTCUSDT $BTCUSDC
Hyperliquid just put Nvidia, Tesla and the S&P 500 on a 24/7 crypto order book. The same week, PURR lifted its stock buyback to $100M, and ~9.92M $HYPEUSDT (~$760M) is scheduled to unlock on Nov 6. #WSOT2026 #IMPACTbyTrade #MyByXTake

🤝👀 SOL PrimeRevenue, a global leader in working capital management and B2B payment automation, is implementing electronic bills of exchange (ETD) on Solana. $SOLUSDT $SOLUSDC #WSOT2026 #AnthropicS1Filing #IMPACTbyTrade #MyByXTake #MidtermsMarketWatch

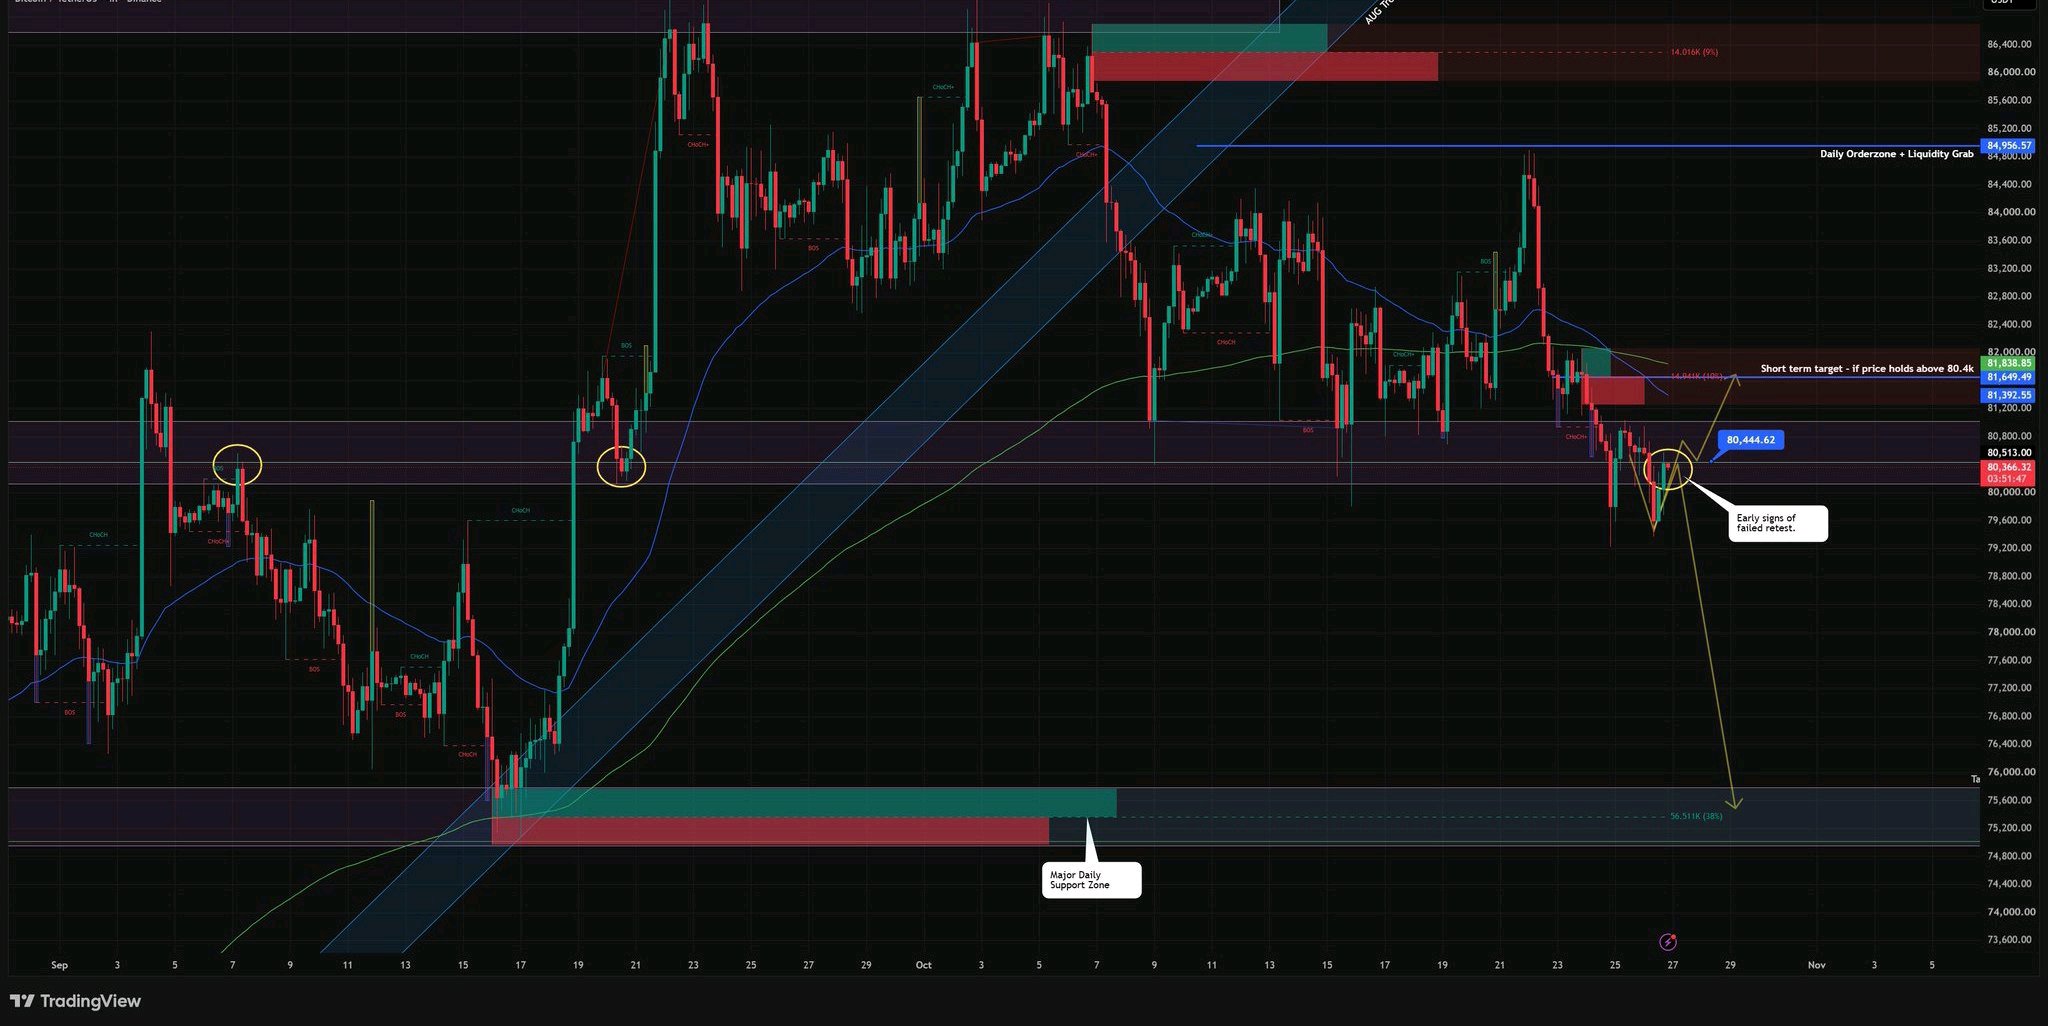
BTC 4HR Update: The US Session Decides This One Bitcoin is still fighting around 80.4k, but buyers are being squeezed harder every time this level gets tested. . Key levels: • Critical support: 80.4k • Short term reclaim target: 81.5k to 82k • Daily orderzone above: around 84.9k • Major downside target if 80.4k fails: 75k to 76k For me, today is simple. 80.4k holds and Bitcoin gets another chance to breathe. Lose it and the 75k to 76k roadmap comes straight back into play. The US session should tell us which way this wants to go. #MyByXTake #IMPACTbyTrade #WSOT2026 #MidtermsMarketWatch #FOMCRateDecision $BTCUSDT $BTCUSDC
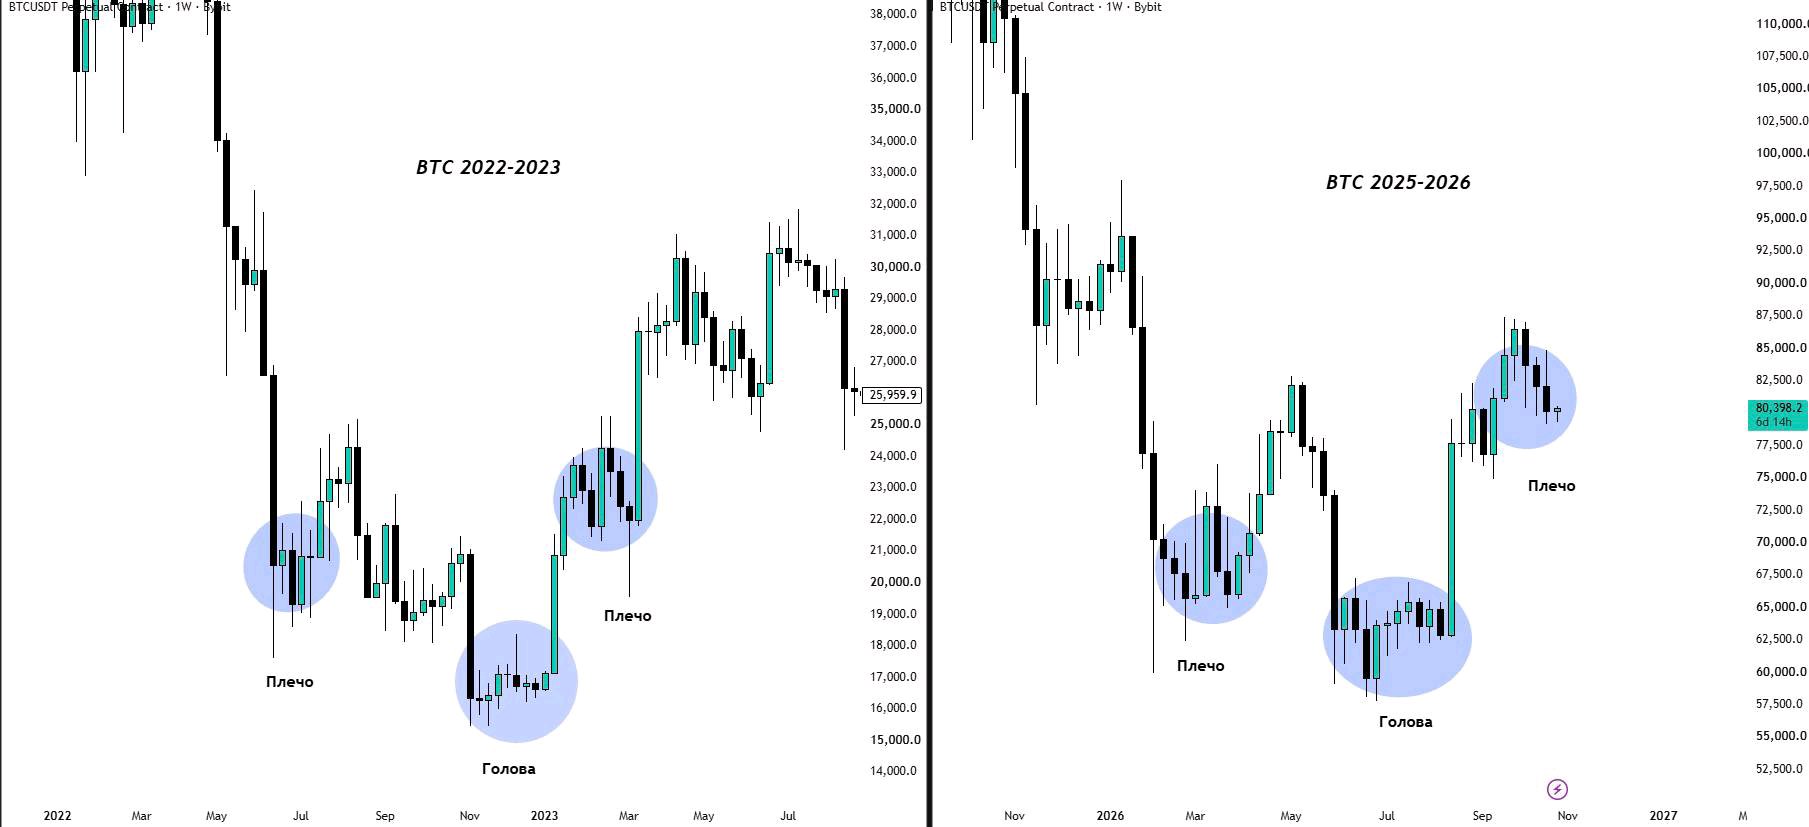
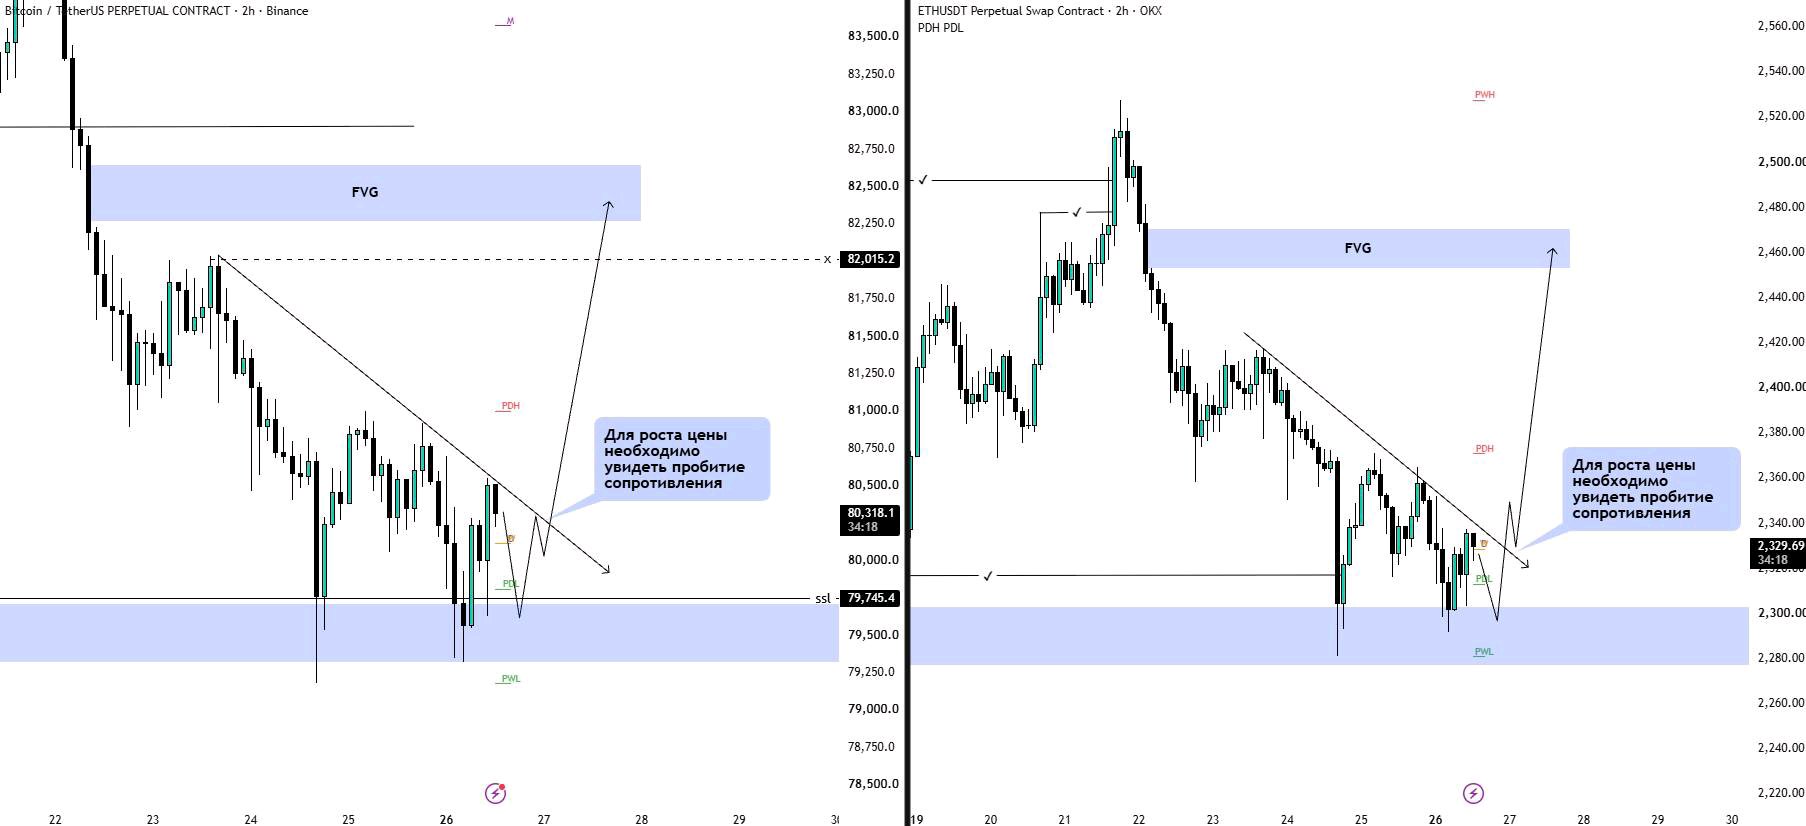
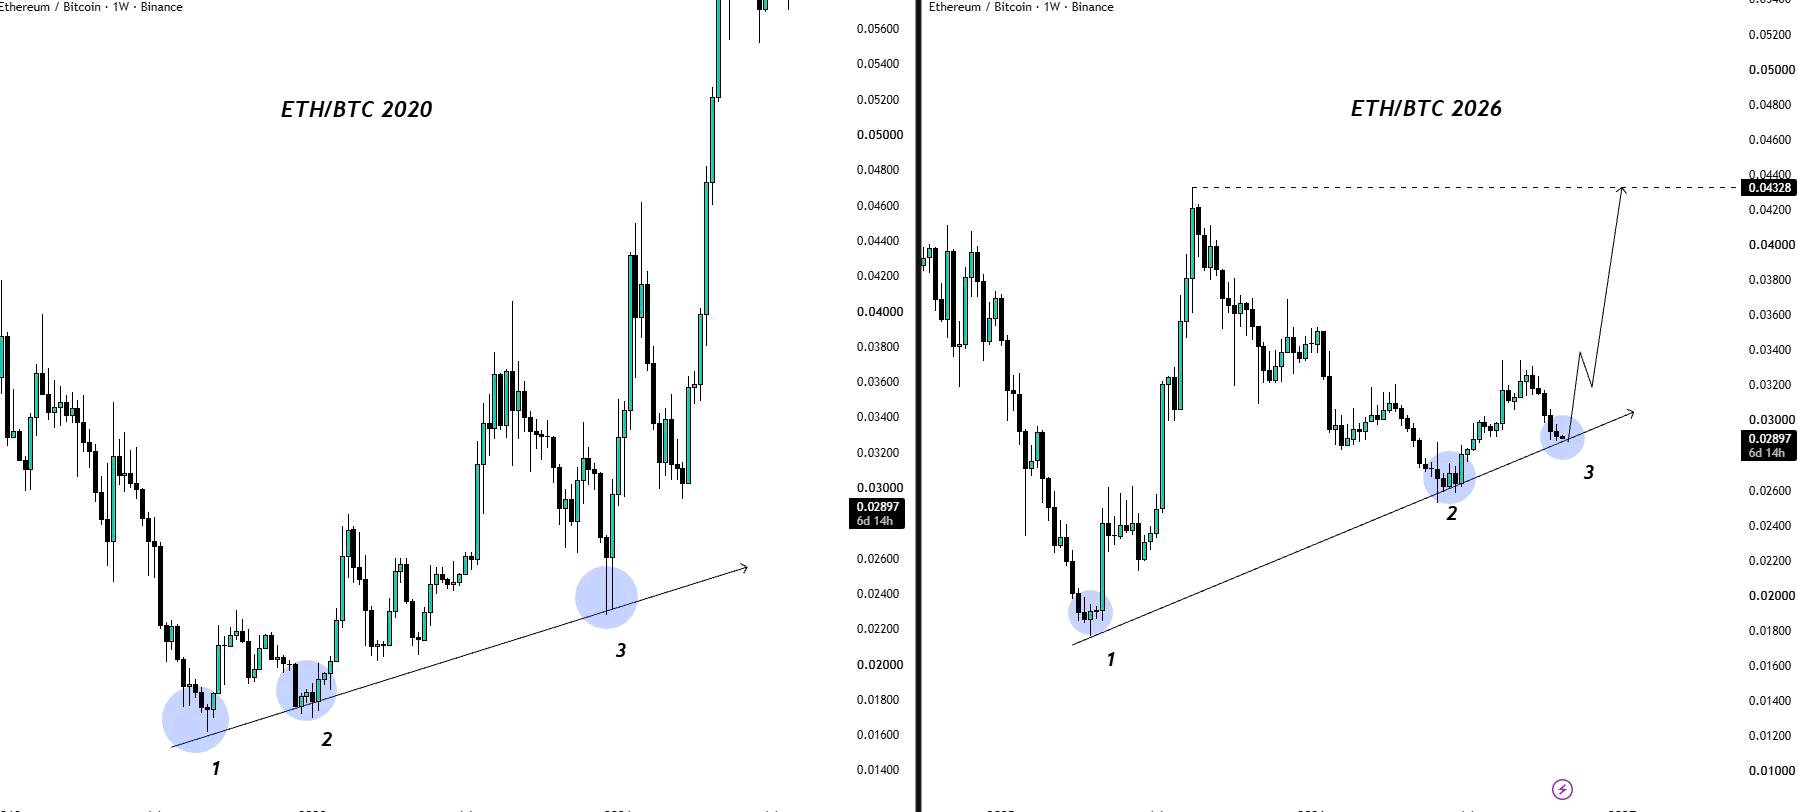
Ну что, ребят, начинаем новую торговую неделю! 🛡 Сегодня предлагаю посмотреть на общую ситуацию по BTC и ETH, а заодно сравнить их графики с прошлыми циклами. Нашла несколько интересных сходств, которыми хочу поделиться! Начнём с метрик. Индекс страха и жадности составляет 44 пункта против 49 неделю назад, а индекс альтсезона снизился с 57 до 52. Настроения стали осторожнее, пока преимущество остаётся за биткоином. На выходных ожидала снижения BTC и ETH, но коррекция оказалась глубже. На обоих графиках сформировалась локальная нисходящая структура. По BTC уже сняли SSL в районе $79 745 и получили реакцию от поддержки $79 300–79 750. По ETH ситуация похожая, реакция покупателей появилась в зоне $2 280–2 300. Пока допускаю продолжение консолидации, после чего буду ждать пробоя нисходящих трендовых. В таком случае по BTC целью выступает FVG $82 250–82 600, по ETH — $2 450–2 470. Теперь хочу поделиться ещё одним интересным наблюдением! Дополнительно прикрепила сравнение графиков BTC за 2022–2023 и 2025–2026 годы. В обоих случаях просматривается перевёрнутая «голова и плечи». В 2023 году после формирования этой структуры BTC перешёл к росту. Сейчас правое плечо ещё формируется, поэтому интересно, повторится ли сценарий. Также сравнила ETH/BTC за 2020 и 2026 годы. Тогда цена трижды тестировала восходящую линию поддержки, после чего последовал мощный импульс вверх. Сейчас видим похожую картину. Если поддержка удержится, первой целью рассматриваю локальный максимум около 0,0432. Укрепление ETH относительно BTC могло бы создать хорошую основу для роста альткоинов, особенно при снижении доминации биткоина. Исторические структуры не гарантируют повторения, но сходства интересные. Продолжу следить за развитием обоих сценариев! #IMPACTbyTrade #MyByXTake #WSOT2026 #MidtermsMarketWatch #FOMCRateDecision $BTCUSDT $ETHUSDT
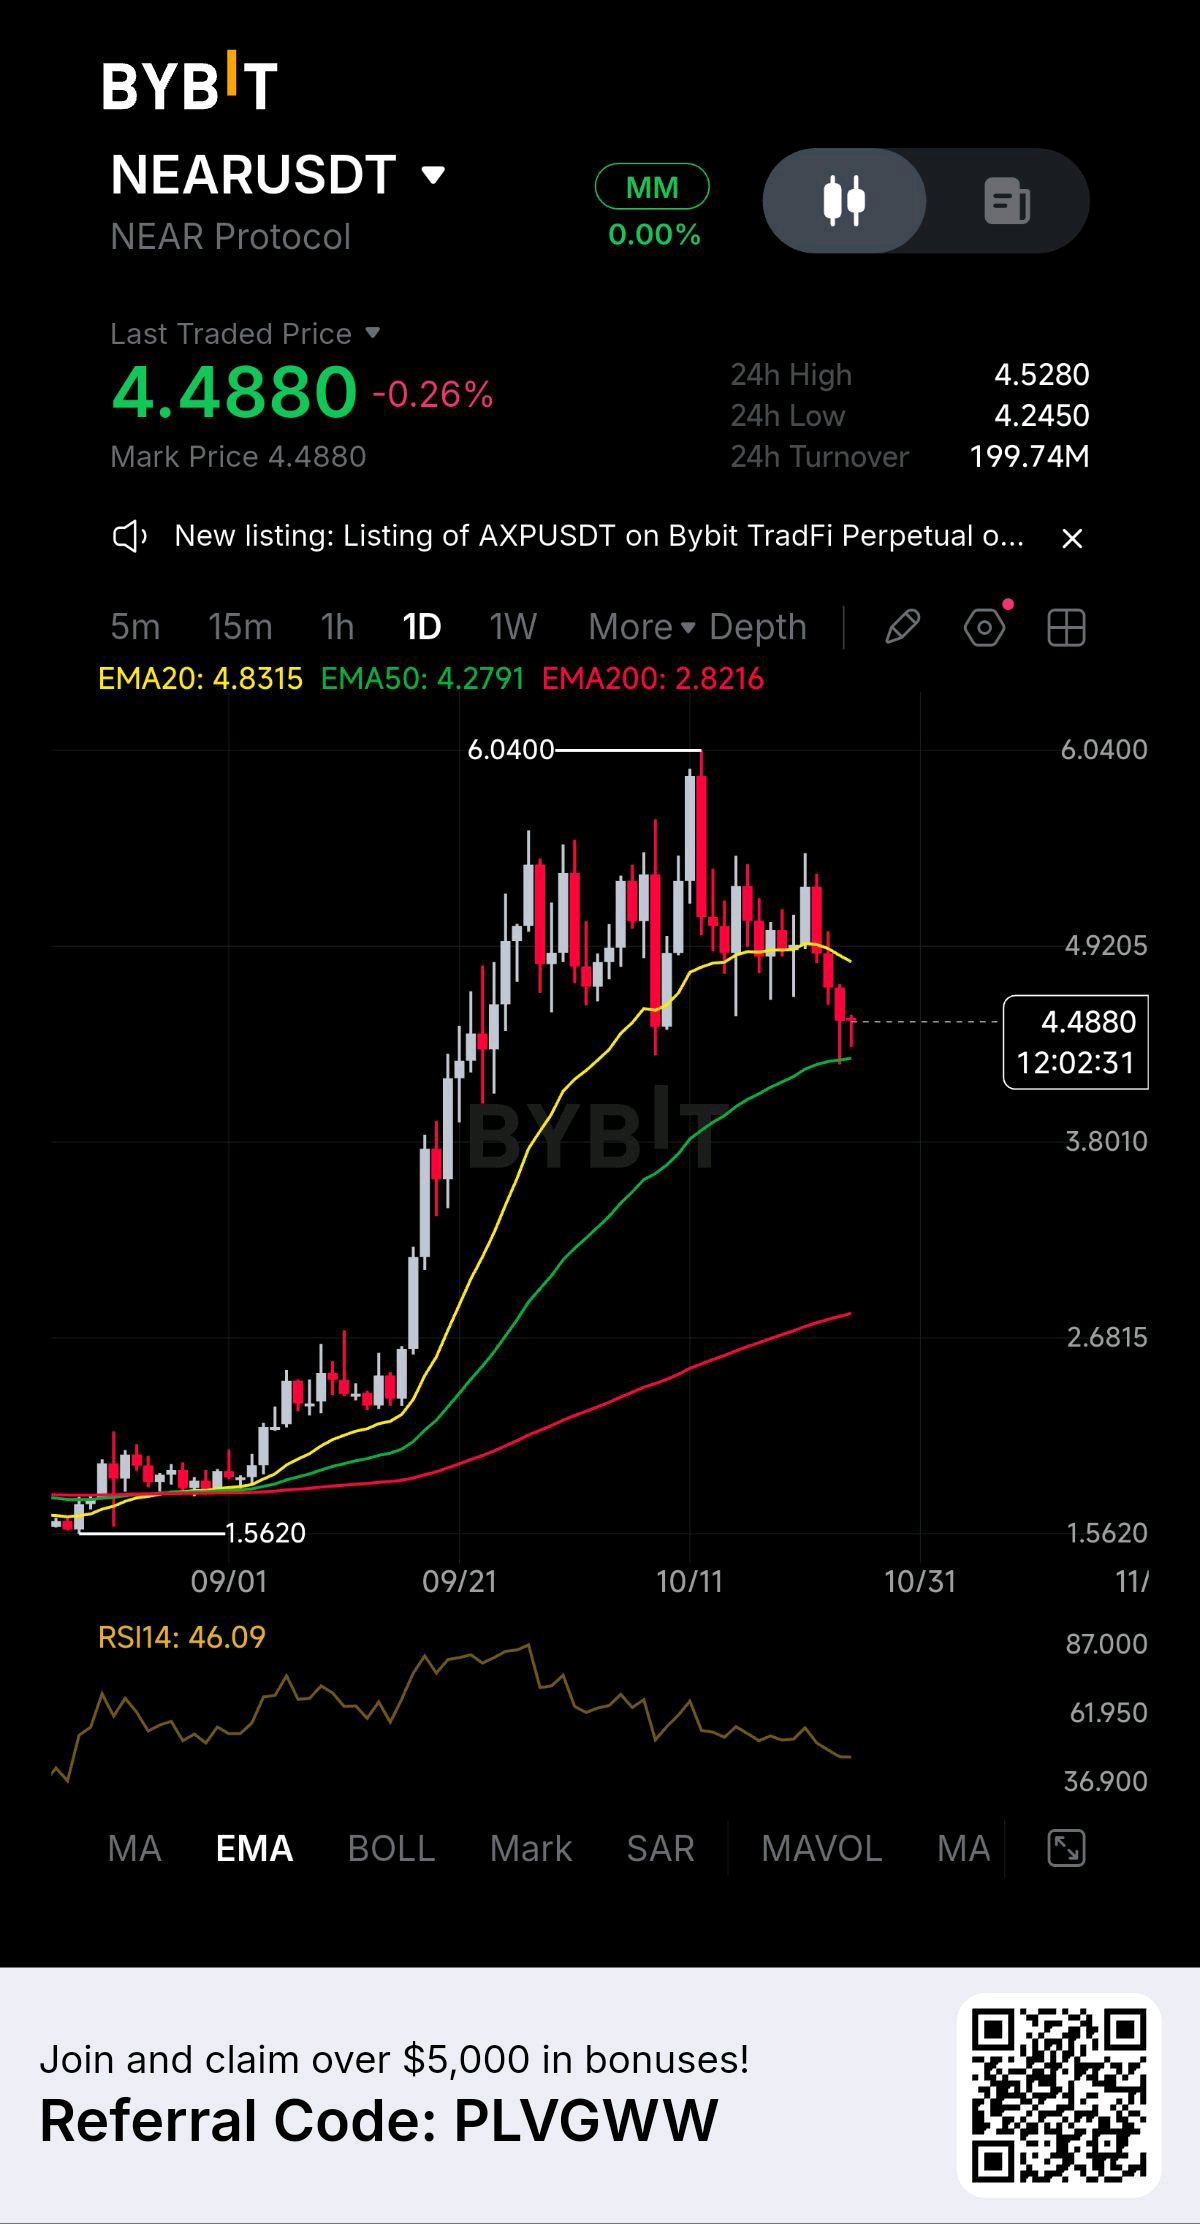
NEAR is testing a critical support zone. 👀 NEAR Protocol is trading around $4.488 on the daily chart after pulling back from its recent high near $6.04. Here's what caught my attention: 🔸 EMA 20: $4.8315 — price is below it, showing short-term weakness. 🔸 EMA 50: $4.2791 — the next key support to watch. 🔸 EMA 200: $2.8216 — the broader trend remains above this long-term average. 🔸 RSI: 46.09 — momentum is weak, with sellers having a slight edge. My levels to watch: 🟢 Support: $4.28, followed by the $4.00 area. 🔴 Resistance: $4.83, then the $4.92 zone. If NEAR holds the EMA 50 and reclaims $4.83, a recovery could develop. But losing $4.28 would increase the risk of a deeper pullback. For now, I'm watching how price reacts around support rather than rushing into a direction. What's your take? Can NEAR recover toward $5, or will sellers push it lower? 👇 DYOR. Not financial advice. #MyByXTake
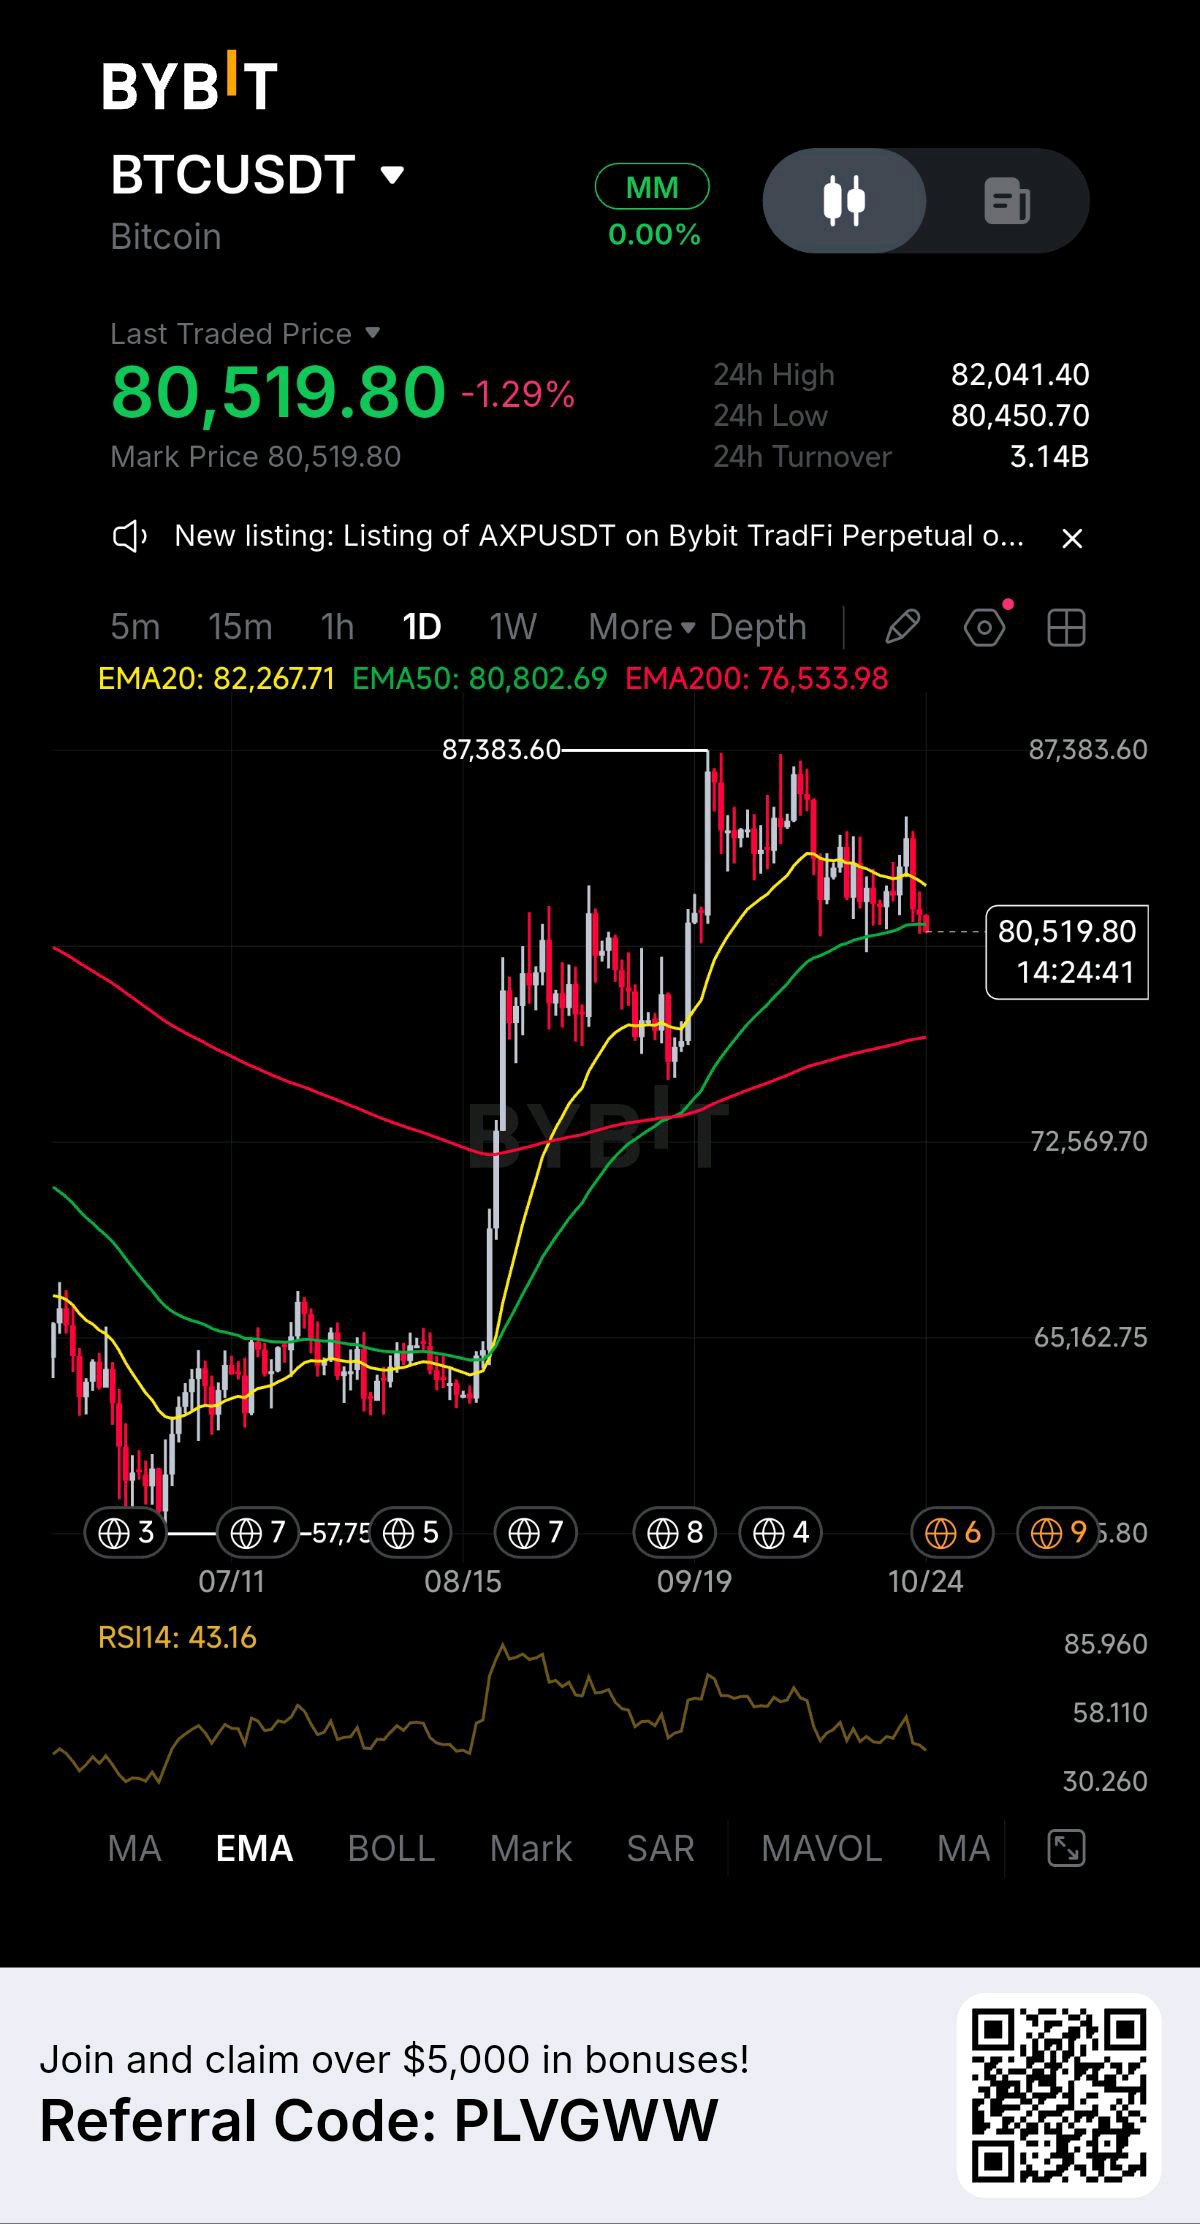
BTC is approaching a critical decision zone. What happens next? 👀 Bitcoin is trading around $80,520 on the daily chart, sitting below both the EMA 20 ($82,267) and EMA 50 ($80,803). Short-term momentum is leaning bearish, with RSI at 43.16. Here are the levels I'm watching: 🔴 Resistance: $82,000–$82,300 🟡 Support: $80,450–$80,000 🟢 Major trend reference: $76,534 (EMA 200) If BTC loses $80,450 and fails to reclaim it, further downside could follow. But if buyers defend support and push price back above $80,800, a recovery toward $82,300 becomes possible. I'm not calling for an immediate crash or rally. I want to see confirmation before taking a bias too far. DYOR. Not financial advice. #MyByXTake
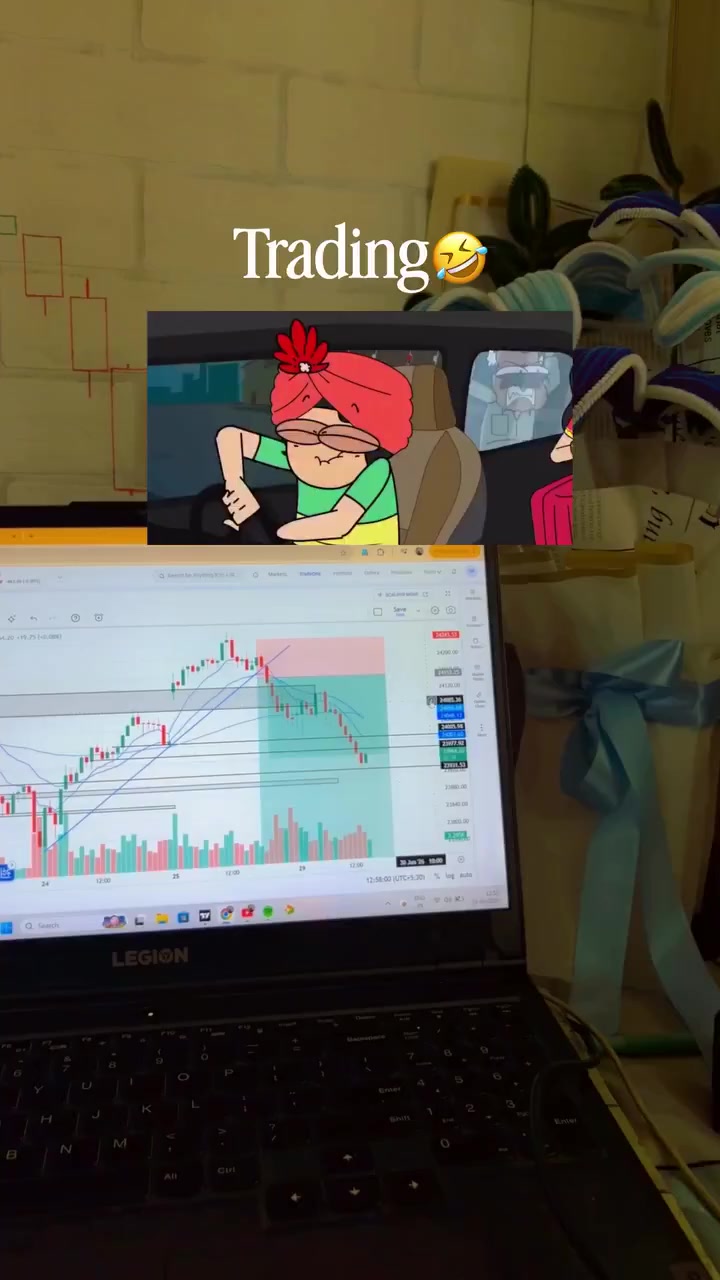
Trading 🤣
Windows users, he’s finally yours....