JABALI
Market Analysis, Content Strategy, Content Writing,
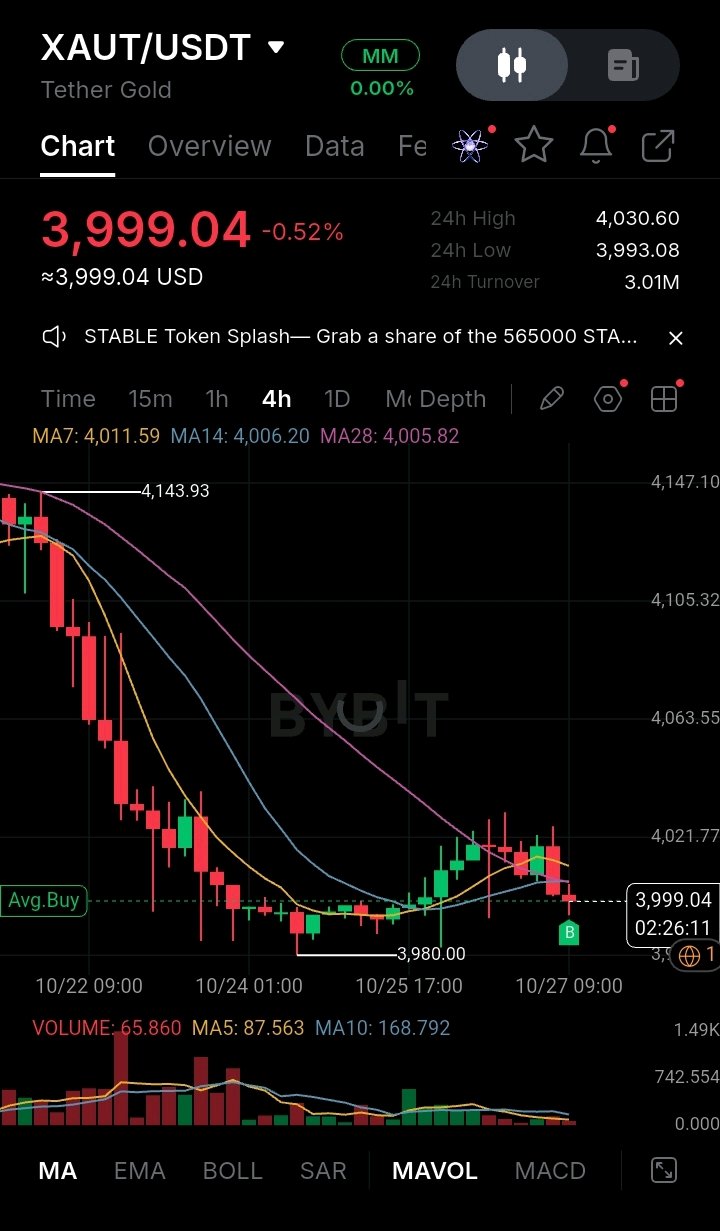
🔍 Market Analysis: $XAUTUSDT Critical Support Test & Range Defense (4h Chart) 📉 XAUT/USDT is holding steady near a key psychological boundary on the 4-hour timeframe, currently down -0.52% and trading at 3,999.04. Following a corrective move from previous highs of 4,143.93 and a structural low test at 3,980.00, the asset is attempting to build a consolidation floor around the 4,000 mark. ▪️ Technical Setup: Price action is compressing tightly against the short-term moving average cluster, defined by the MA7 (4,011.59), MA14 (4,006.20), and MA28 (4,005.82). This convergence highlights a slight downward tilt as sellers probe the immediate support shelf, though the downside momentum shows signs of slowing. ▪️ Indicators: 24h turnover stands robust at 3.01M with a 24h high of 4,030.60 and low of 3,993.08. With the price hovering right at the 3,999 pivot line, sustained buying volume is required to flip the MA cluster back into support and initiate a relief bounce toward upper resistance levels. ▪️ Outlook: Defending the 3,980.00 - 3,990.00 structural support zone is imperative. A decisive recovery above the MA7 at 4,011.59 would signal buyer re-entry, paving the way for a push back toward the 4,030 and 4,063 overhead targets. ⚠️ Risk Disclosure: High-volatility markets can experience rapid price swings. This analysis is for educational purposes only and does not constitute financial advice. #ByXIMPACT #IMPACTbyTrade #MyByXTake

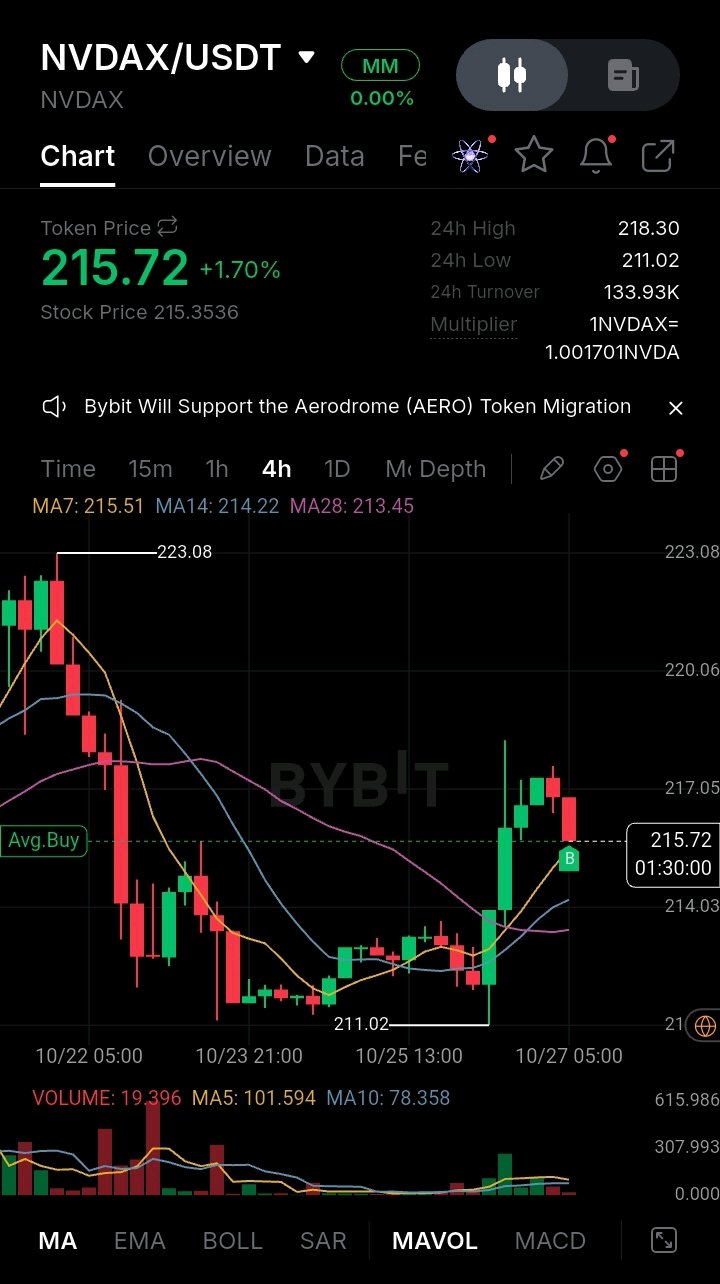
🔍 Market Analysis: $NVDAXUSDT Bullish Rebound & Trend Reversal (4h Chart) 📈 NVDAX/USDT is showing a strong bullish recovery on the 4-hour timeframe, currently up +1.70% and trading at 215.72. After testing a local low of 211.02 and rebounding from previous downward pressure, the asset has established a solid base and is forming an aggressive upward momentum wave. ▪️ Technical Setup: The price action has broken back above its key moving average cluster, trading healthily over the MA7 (215.51), MA14 (214.22), and MA28 (213.45). This short-term convergence and upward crossover signal that buyers have reclaimed control after the earlier correction toward the 211 support zone. ▪️ Indicators: The volume profile reflects renewed buying interest following the successful defense of the 211.02 swing low. With the price holding firmly above the moving average stack, upward pressure remains intact, paving the way for a test of immediate overhead resistance near the 218.30 - 223.08 range. ▪️ Outlook: Maintaining position support above the 214.00 - 215.00 zone is vital for continuation. A sustained breakout past local resistance could trigger an accelerated push toward the 223.08 previous high target. ⚠️ Risk Disclosure: High-volatility markets can experience rapid price swings. This analysis is for educational purposes only and does not constitute financial advice. #ByXIMPACT #IMPACTbyTrade #MyByXTake

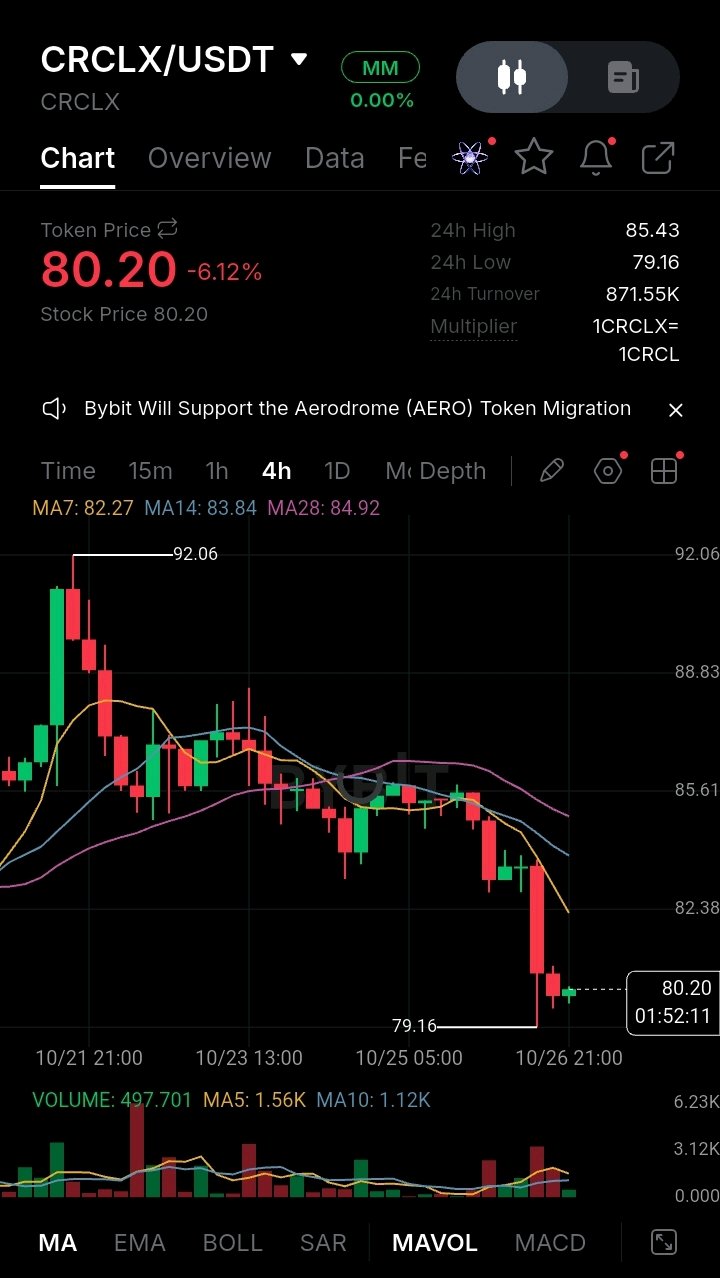
CRCLX: Bearish Downtrend Tests $79.16 Low After Pullback from $92 Peak Will $80 Floor Hold? Circle Stock Token (CRCLX) has experienced a steep downward correction, dropping -6.12% to trade around $80.20 after reaching a recent local high of $92.06[span_0](start_span)[span_0](end_span). As broader tokenized equity market sentiment adjusts, lower-timeframe price action on the 4-hour chart reflects persistent selling pressure that pushed price down to test a local low of $79.16[span_1](start_span)[span_1](end_span). On the 4-hour chart, CRCLX printed a series of strong red breakdown candles, slicing below dynamic support zones and establishing a downward-sloping trajectory[span_2](start_span)[span_2](end_span). The current 4H candle is attempting a minor stabilization above the $79.16 floor, but price remains heavily constrained beneath all key moving average levels[span_3](start_span)[span_3](end_span). 📉 The 4H market structure is firmly bearish, with moving averages stacked above price to act as dynamic resistance zones[span_4](start_span)[span_4](end_span). Key Technical Highlights: • Current Price: $80.20 (-6.12%)[span_5](start_span)[span_5](end_span) • Moving Averages: Price trades significantly below MA7 ($82.27), MA14 ($83.84), and baseline MA28 ($84.92), confirming a dominant short-term downtrend[span_6](start_span)[span_6](end_span). • Volume: Lower-timeframe volume shows selling expansion during the breakdown (497.701 vs MA5 1.56K, MA10 1.12K), indicating aggressive profit-taking before stabilizing near $80[span_7](start_span)[span_7](end_span). Two Scenarios To Watch: 🟢 Bull Case: A sustained relief recovery above $82.27 (MA7) $\rightarrow$ Triggers a retest of overhead dynamic resistance near $83.84 (MA14), with room toward baseline MA28 ($84.92)[span_8](start_span)[span_8](end_span). 🔴 Bear Case: Breakdown below the $79.16 local support floor $\rightarrow$ Opens downside exposure toward lower liquidity targets near the $76.00 – $78.00 demand zone[span_9](start_span)[span_9](end_span). Reclaiming the $82.30 dynamic hurdle is the immediate requirement for buyers to curb the current downward momentum and initiate a reversal setup[span_10](start_span)[span_10](end_span). 💬 What’s your trade plan on CRCLX here? Are you accumulating near the $80 floor or waiting for a confirmed retest of $82.30? $CRCLXUSDT #ByXIMPACT #MyByXTake #IMPACTbyTrade

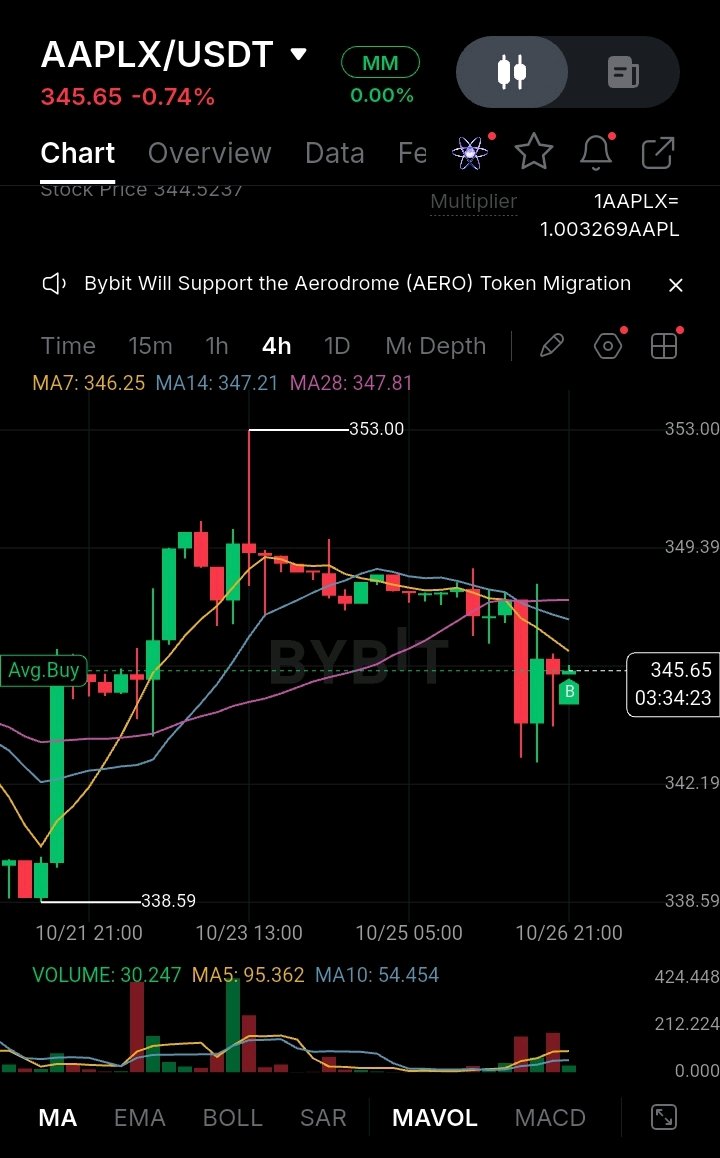
AAPLX: Pullback Retests $345 Floor After $353 Peak Will Baseline Support Trigger Reversal? Apple Stock Token (AAPLX) is down -0.74%, trading around $345.65 after rejecting off its recent high of $353.00[span_0](start_span)[span_0](end_span). Following a period of lower-timeframe distribution, price action on the 4-hour chart has retraced toward dynamic support zones near its previous breakout region[span_1](start_span)[span_1](end_span). On the 4-hour chart, AAPLX printed a sharp red impulse candle that tested lower support around $342.19 before finding immediate buy-side demand[span_2](start_span)[span_2](end_span). The current 4H candle is showing a green recovery attempt, though price remains capped beneath overhead moving average resistance lines[span_3](start_span)[span_3](end_span). 📉 The 4H market structure is in a short-term corrective phase within a broader consolidation range, with moving averages sloping downward to act as dynamic resistance[span_4](start_span)[span_4](end_span). Key Technical Highlights: • Current Price: $345.65 (-0.74%)[span_5](start_span)[span_5](end_span) • Moving Averages: Price is trading below MA7 ($346.25), MA14 ($347.21), and baseline MA28 ($347.81), establishing a immediate overhead resistance zone[span_6](start_span)[span_6](end_span). • Volume: Lower-timeframe volume shows stabilization (30.247 vs MA5 95.362, MA10 54.454), reflecting reduced sell momentum near local demand[span_7](start_span)[span_7](end_span). Two Scenarios To Watch: 🟢 Bull Case: A sustained 4H close above $346.25 (MA7) $\rightarrow$ Triggers a recovery retest toward dynamic resistance at $347.81 (MA28 baseline) and room toward $349.39[span_8](start_span)[span_8](end_span). 🔴 Bear Case: Rejection at $346.25 followed by a drop below $345.00 $\rightarrow$ Re-opens downside exposure to retest the local support floor at $342.19, with broader risk toward $338.59[span_9](start_span)[span_9](end_span). With the broader equity environment maintaining baseline interest, reclaiming the $347.20–$347.80 moving average cluster is essential for buyers to regain full directional control[span_10](start_span)[span_10](end_span). 💬 What’s your trading plan on AAPLX here? Are you accumulating near $345 support or waiting for a confirmed break above $347.80? $AAPLXUSDT #ByXIMPACT #MyByXTake

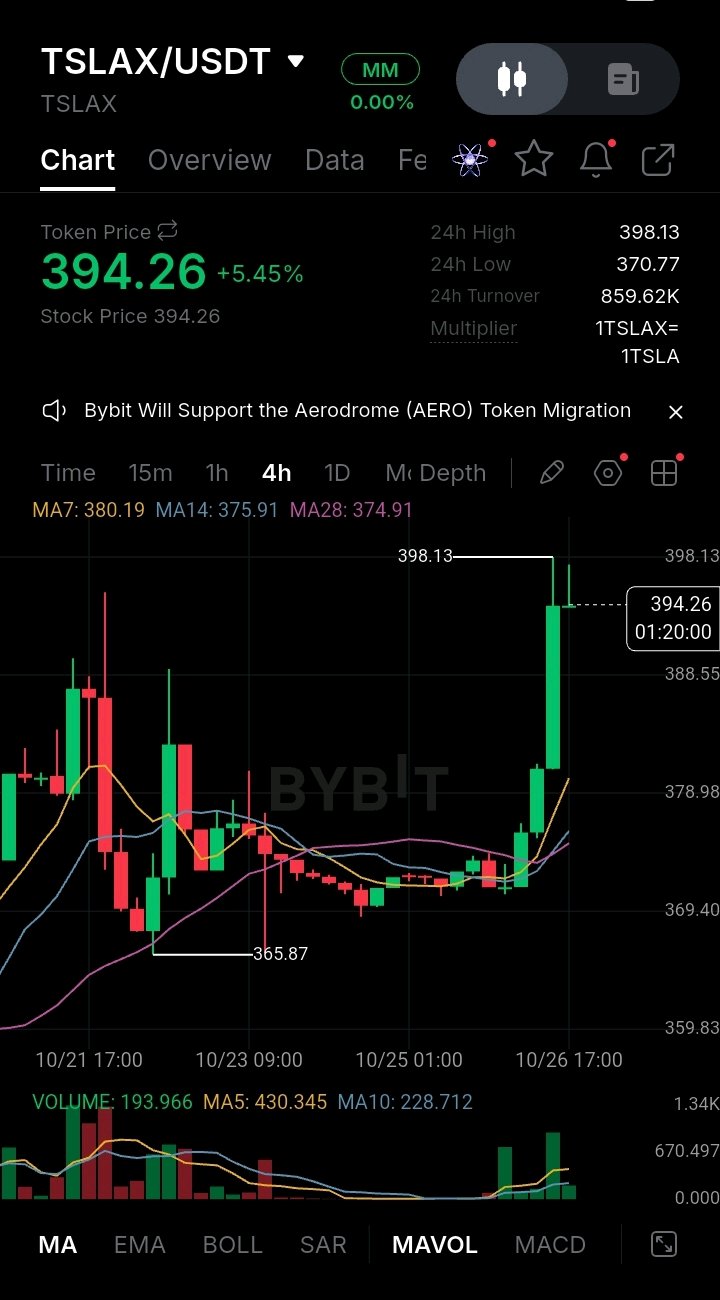
🔍 Market Analysis: $TSLAX/USDT Bullish Momentum & Strong Expansion (4h Chart) 📈 TSLAX/USDT is experiencing a powerful bullish surge on the 4-hour timeframe, currently up +5.45% and trading at 394.26[span_0](start_span)[span_0](end_span). After consolidating along a tight baseline, the asset broke out sharply to reach a local high of 398.13 before settling into its current level near 394.26[span_1](start_span)[span_1](end_span). ▪️ Technical Setup: The price structure has shifted into a strong upward trend, trading well above all key moving averages[span_2](start_span)[span_2](end_span). The dynamic support cluster is formed by the MA7 (380.19), MA14 (375.91), and MA28 (374.91)[span_3](start_span)[span_3](end_span). A clear upward fan in the moving averages reflects accelerating short-term momentum following the successful recovery from the recent swing low at 365.87[span_4](start_span)[span_4](end_span). ▪️ Indicators: Trading volume on this breakout candle expanded significantly to 193.966 TSLAX, staying close to the 10-period volume average (MA10: 228.712) while building momentum[span_5](start_span)[span_5](end_span). The sharp vertical push signals aggressive buyers pushing past key resistance, with volume validating the initial leg of the rally[span_6](start_span)[span_6](end_span). ▪️ Fundamental & News: As a tokenized stock pegged 1:1 to Tesla (TSLA), TSLAX price dynamics closely track underlying equity catalysts[span_7](start_span)[span_7](end_span). Market sentiment has been boosted by Tesla's Q3 financial updates highlighting quarter-over-quarter expansion in unsupervised Robotaxi miles, alongside strategic developments surrounding potential synergy between SpaceX and Tesla board committees. ▪️ Outlook: Maintaining structural support above the 380.00–388.55 region (MA7 alignment zone) is critical for buyers to consolidate recent gains[span_8](start_span)[span_8](end_span). A decisive close above the 398.13 high could clear the path for a retest toward $400.00+ psychological levels, whereas losing 375.91 support would signal a retracement back into the previous consolidation zone[span_9](start_span)[span_9](end_span). ⚠️ Risk Disclosure: High-volatility assets can experience rapid price swings. This analysis is for educational purposes only and not financial advice. $TSLAXUSDT #ByXIMPACT #IMPACTbyTrade #MyByXTake

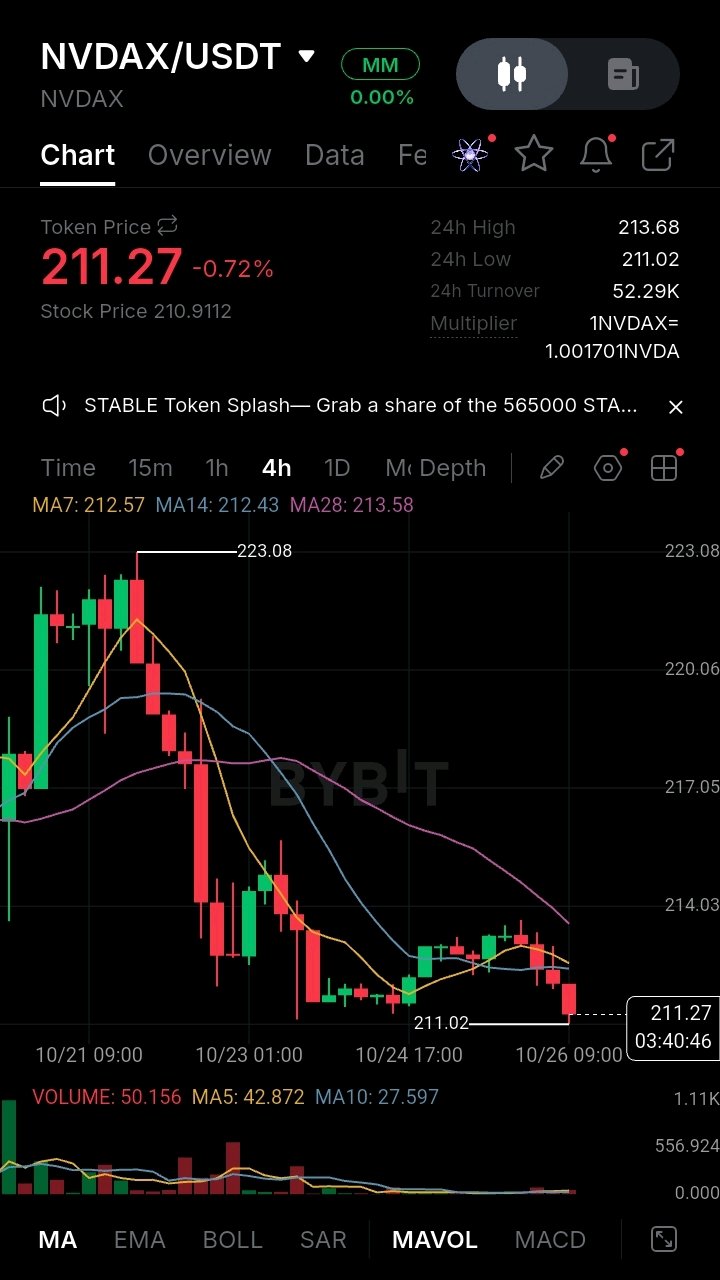
🔍 Market Analysis: $NVDAX/USDT Testing Local Support & Bearish Pressure (4h Chart) 📈 NVDAX/USDT continues to experience downward pressure on the 4-hour timeframe, down -0.72% and trading at 211.27[span_0](start_span)[span_0](end_span). Following a pullback from its recent local peak at 223.08, the asset has steadily drifted downward and is currently retesting its major support base around the 211.02 zone[span_1](start_span)[span_1](end_span). ▪️ Technical Setup: The price structure remains under short-term bearish pressure, trading below all primary moving averages[span_2](start_span)[span_2](end_span). The setup is constrained by the MA7 (212.57), MA14 (212.43), and MA28 (213.58)[span_3](start_span)[span_3](end_span). The short-term moving average cluster (MA7 and MA14) has converged beneath the longer-term MA28, indicating persistent selling pressure and an active consolidation floor near the 211.02 swing low[span_4](start_span)[span_4](end_span). ▪️ Indicators: Trading volume stands at 50.156 NVDAX, staying above the 5-period volume average (MA5: 42.872) and 10-period volume average (MA10: 27.597)[span_5](start_span)[span_5](end_span). The elevated relative volume during this leg down confirms active distribution as sellers push price action directly toward local demand[span_6](start_span)[span_6](end_span). ▪️ Fundamental & News: As a tokenized asset backed 1:1 by NVIDIA equity, NVDAX closely mirrors macro tech sector performance and sentiment around AI hardware infrastructure. Broader macro tech consolidation and risk-off sentiment in equities are directly weighing on the tokenized stock's short-term momentum. ▪️ Outlook: Defending the critical 211.02 local support is essential for buyers to prevent further breakdown[span_7](start_span)[span_7](end_span). A failure to maintain this level could open the door to deeper downside retests, whereas a strong rebound back above the 212.50–213.58 cluster (MA7/MA28) would be needed to signal a short-term trend reversal toward 217.00 and 220.00 resistance zones[span_8](start_span)[span_8](end_span). ⚠️ Risk Disclosure: High-volatility assets can experience rapid price swings. This analysis is for educational purposes only and not financial advice. $NVDAXUSDT #ByXIMPACT #MyByXTake

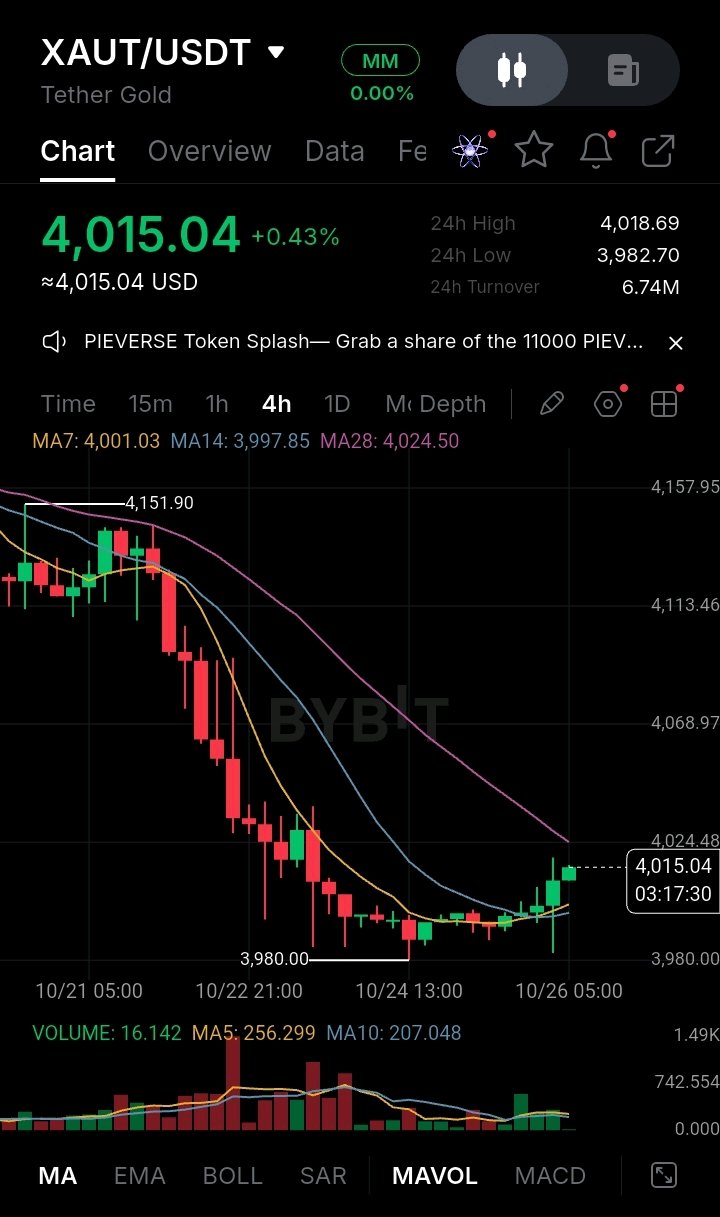
🔍 Market Analysis: $XAUT/USDT Recovery Phase & Moving Average Crossover (4h Chart) 📈 XAUT/USDT is attempting a steady short-term recovery on the 4-hour timeframe, currently up +0.43% and trading at 4,015.04[span_0](start_span)[span_0](end_span). Following a sharp corrective drop from the local peak near 4,151.90 down to a key support bottom at 3,980.00, price action has stabilized[span_1](start_span)[span_1](end_span). The asset is now pushing back above psychological key levels after reclaiming early momentum[span_2](start_span)[span_2](end_span). ▪️ Technical Setup: The price is currently trading above its short-term moving average cluster, supported by the MA7 (4,001.03) and MA14 (3,997.85)[span_3](start_span)[span_3](end_span). A bullish crossover of the MA7 above the MA14 signals early trend reversal from the recent decline, though the overhead MA28 at 4,024.50 remains immediate dynamic resistance[span_4](start_span)[span_4](end_span). Reclaiming and closing above the MA28 is key to sustaining this bounce[span_5](start_span)[span_5](end_span). ▪️ Indicators: Volume on the current bounce remains modest at 16.142 XAUT against a 5-period volume average of 256.299, pointing to conservative buying activity as traders await clear directional signals[span_6](start_span)[span_6](end_span). The recent hold above the 3,980.00 base reflects diminishing downside momentum and strong support around major psychological demand zones[span_7](start_span)[span_7](end_span). ▪️ Fundamental & News: As a token backed 1:1 by physical gold, XAUT price dynamics directly mirror traditional spot gold trends, which are benefiting from broader macroeconomic uncertainty and safe-haven demand. Strong underlying demand during price dips near $4,000 continues to anchor token sentiment. ▪️ Outlook: Holding ground above the 3,980.00–4,000.00 support region is essential for buyers[span_8](start_span)[span_8](end_span). A successful breakout above the 4,024.50 (MA28) level could open the path toward testing higher resistance near 4,068.00 and 4,113.00, whereas losing 3,980.00 would risk invalidating the short-term recovery structure[span_9](start_span)[span_9](end_span). ⚠️ Risk Disclosure: High-volatility assets can experience rapid price swings. This analysis is for educational purposes only and not financial advice. $XAUTUSDT #MyByXTake #ByXIMPACT

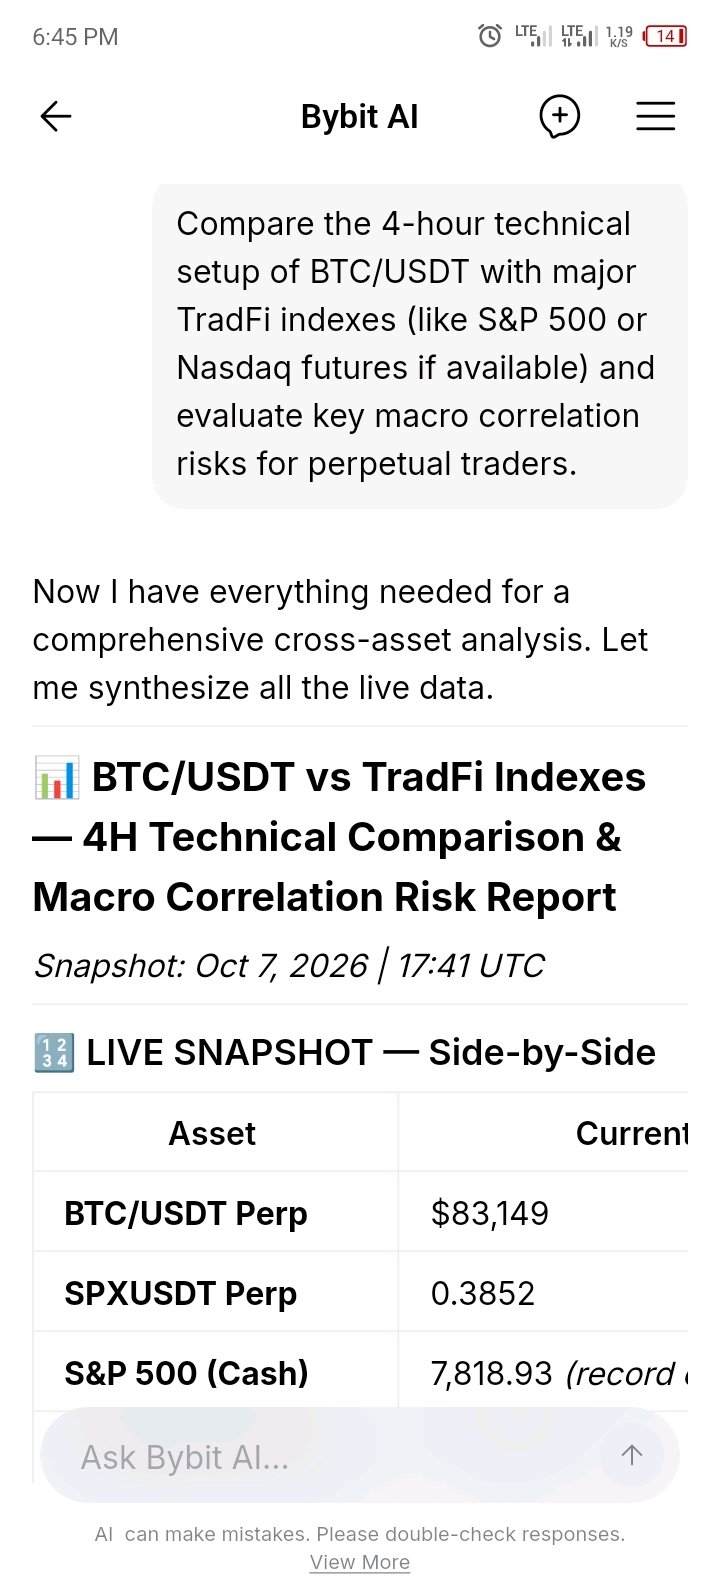
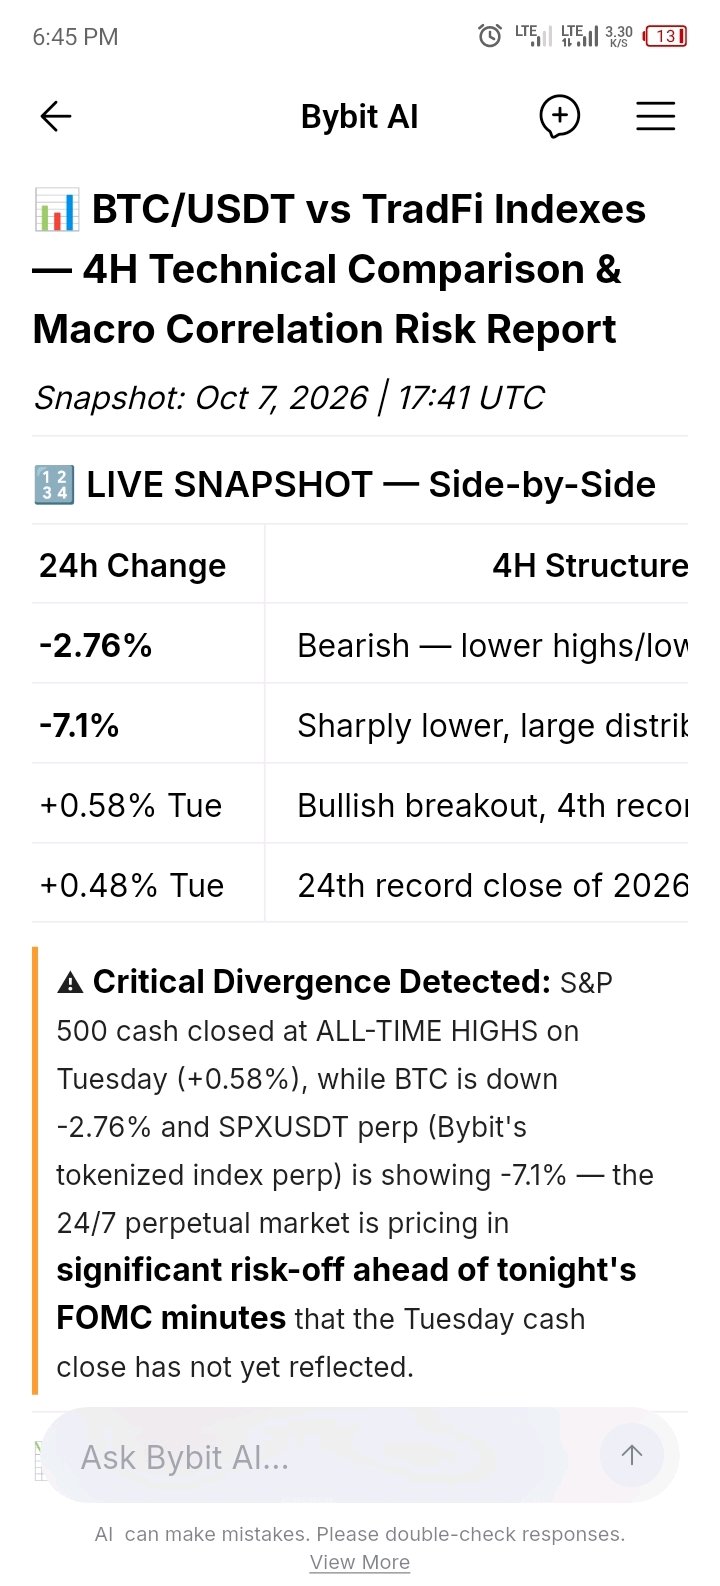
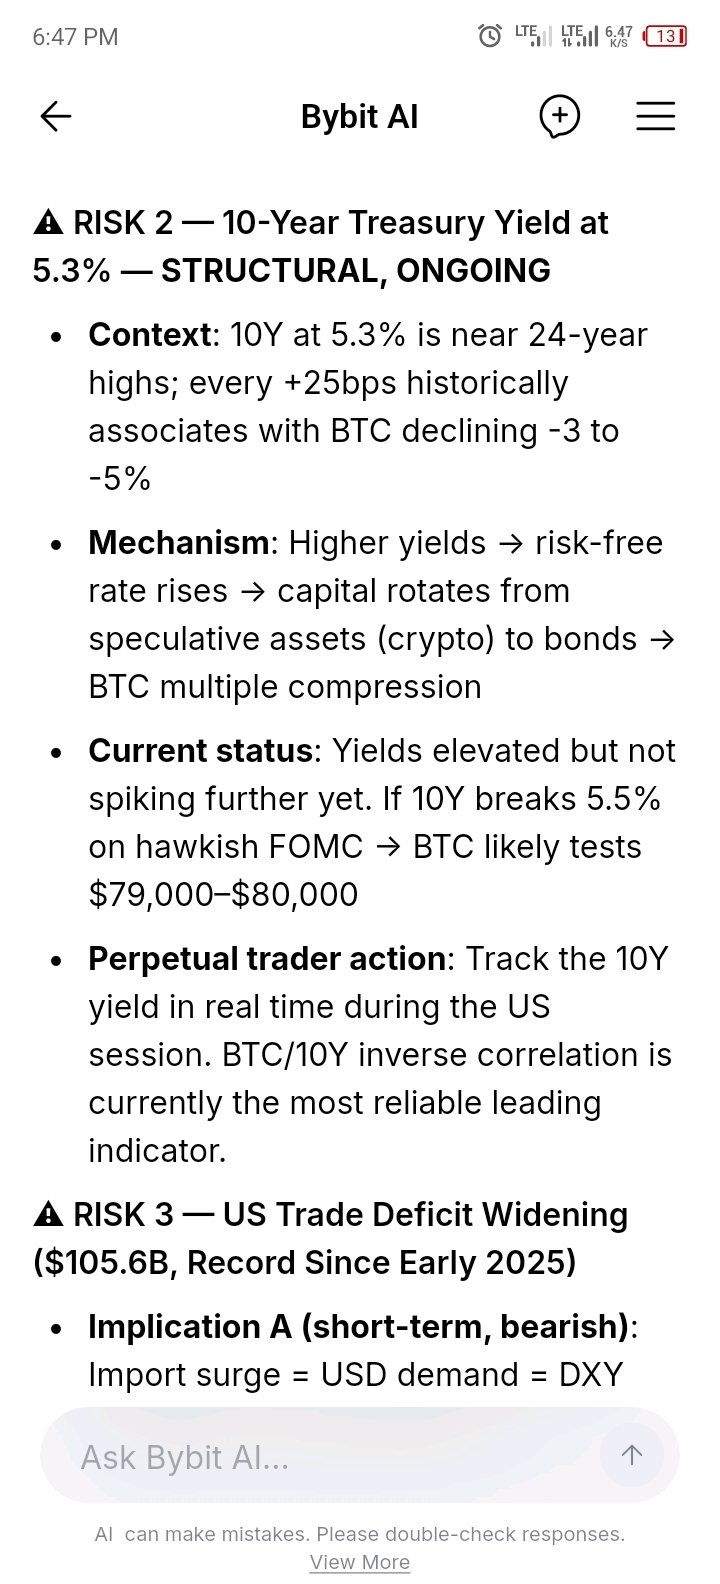
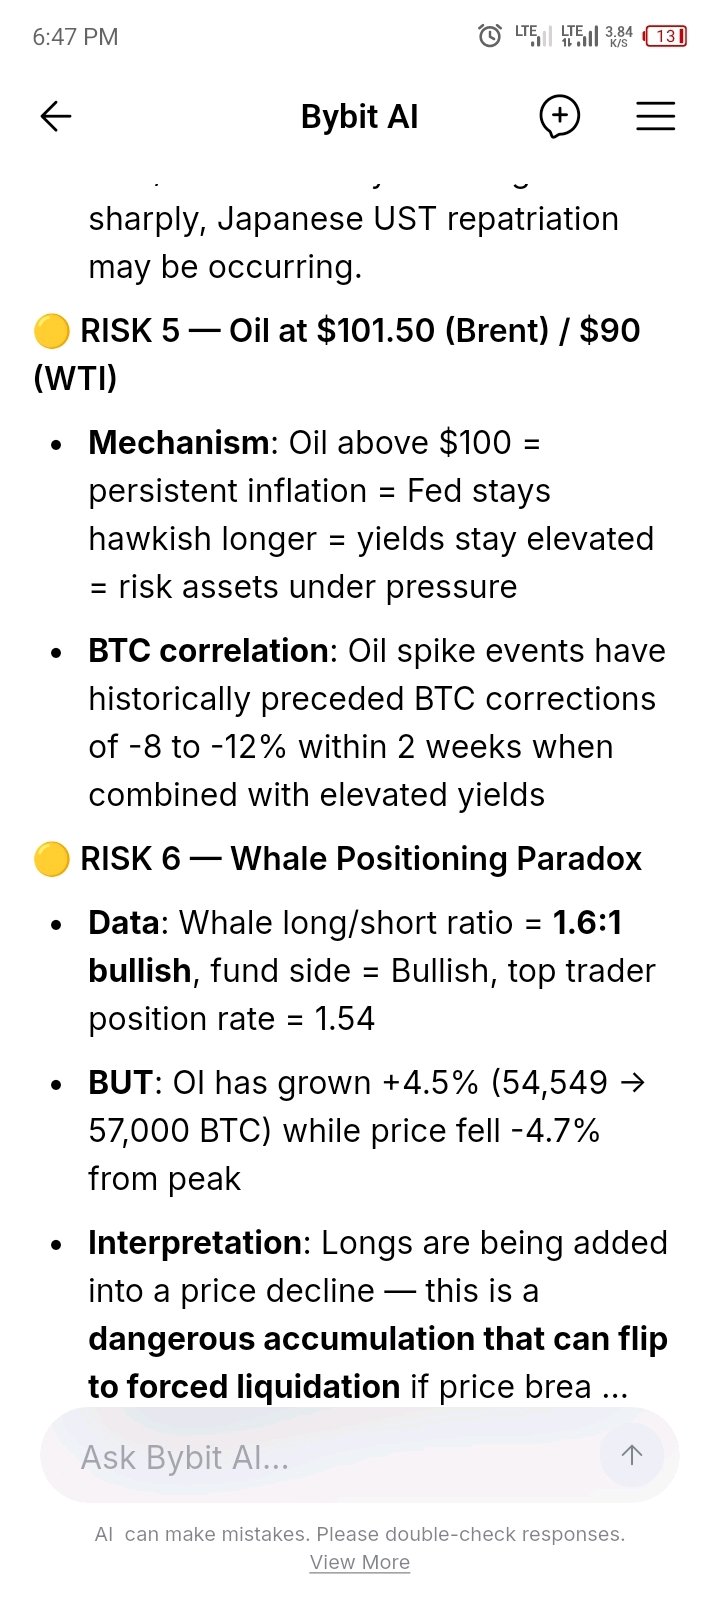
Cross-asset macro intelligence powered by Bybit AI! 🌐📈 I tested Bybit AI with the prompt: "Compare the 4-hour technical setup of BTC/USDT with major TradFi indexes (like S&P 500 or Nasdaq futures if available) and evaluate key macro correlation risks for perpetual traders." Key Insights: Bybit AI spotted a critical divergence: while S&P 500 cash markets hit new highs, 24/7 perpetual markets (BTC/USDT & SPXUSDT perp) priced in pre-FOMC risk-off sentiment! The detailed scenario planning and position sizing rules for perp traders were spot on. Feature Request: Adding a visual Macro Event Timeline widget right on the correlation interface would make tracking macro-driven crypto volatility even smoother for derivative traders! Solid insights, actionable risk management. 💡 #BybitAIBoughtTheDip #BybitAIBestReplies
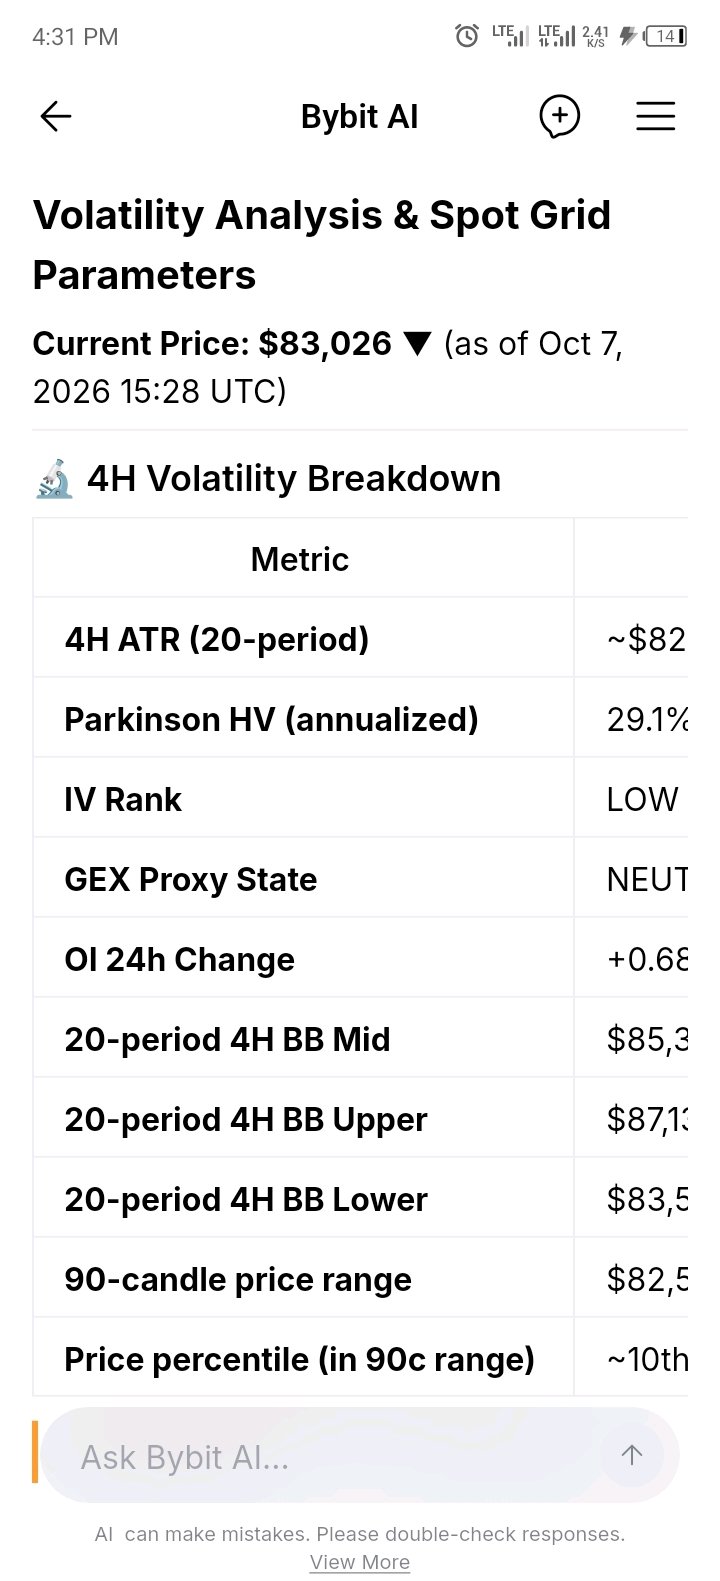
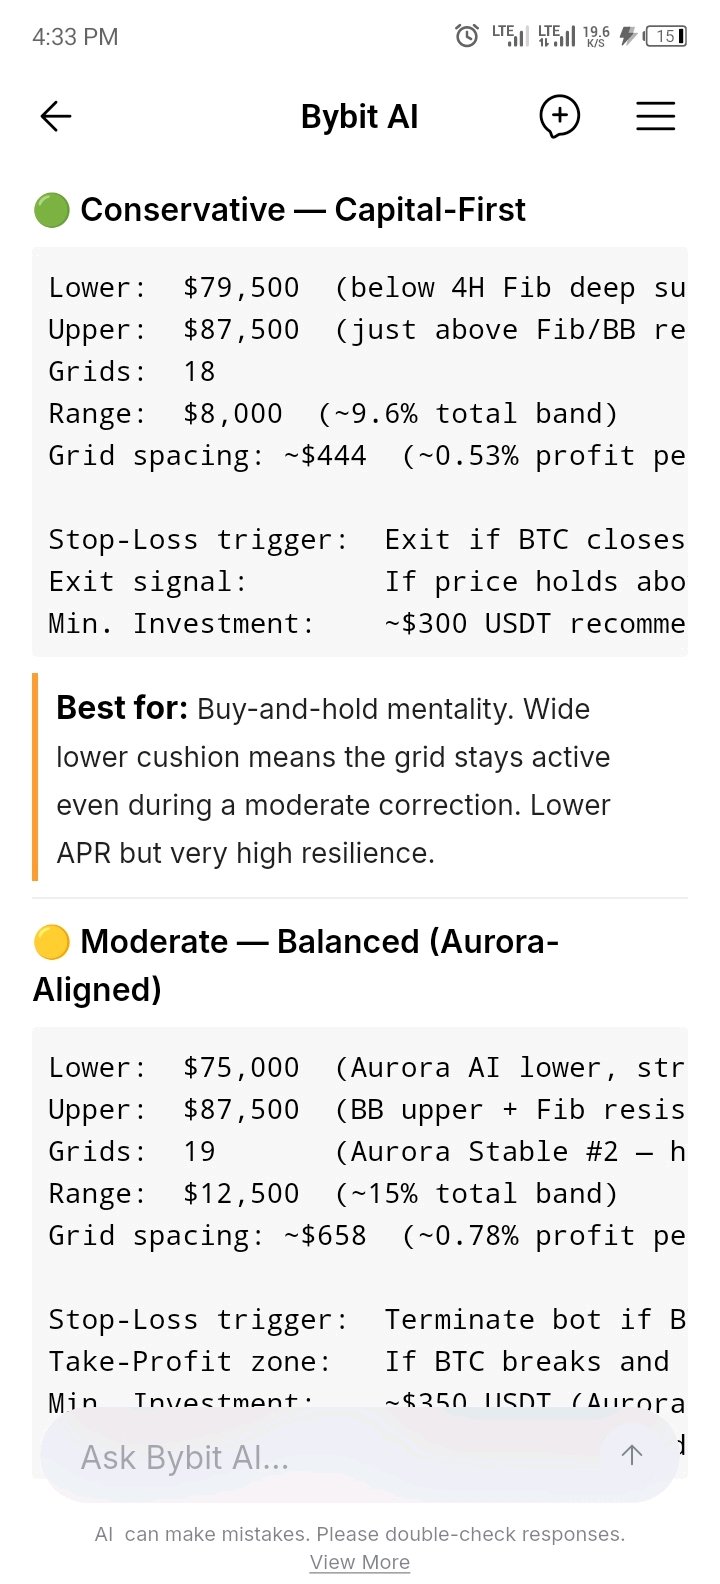
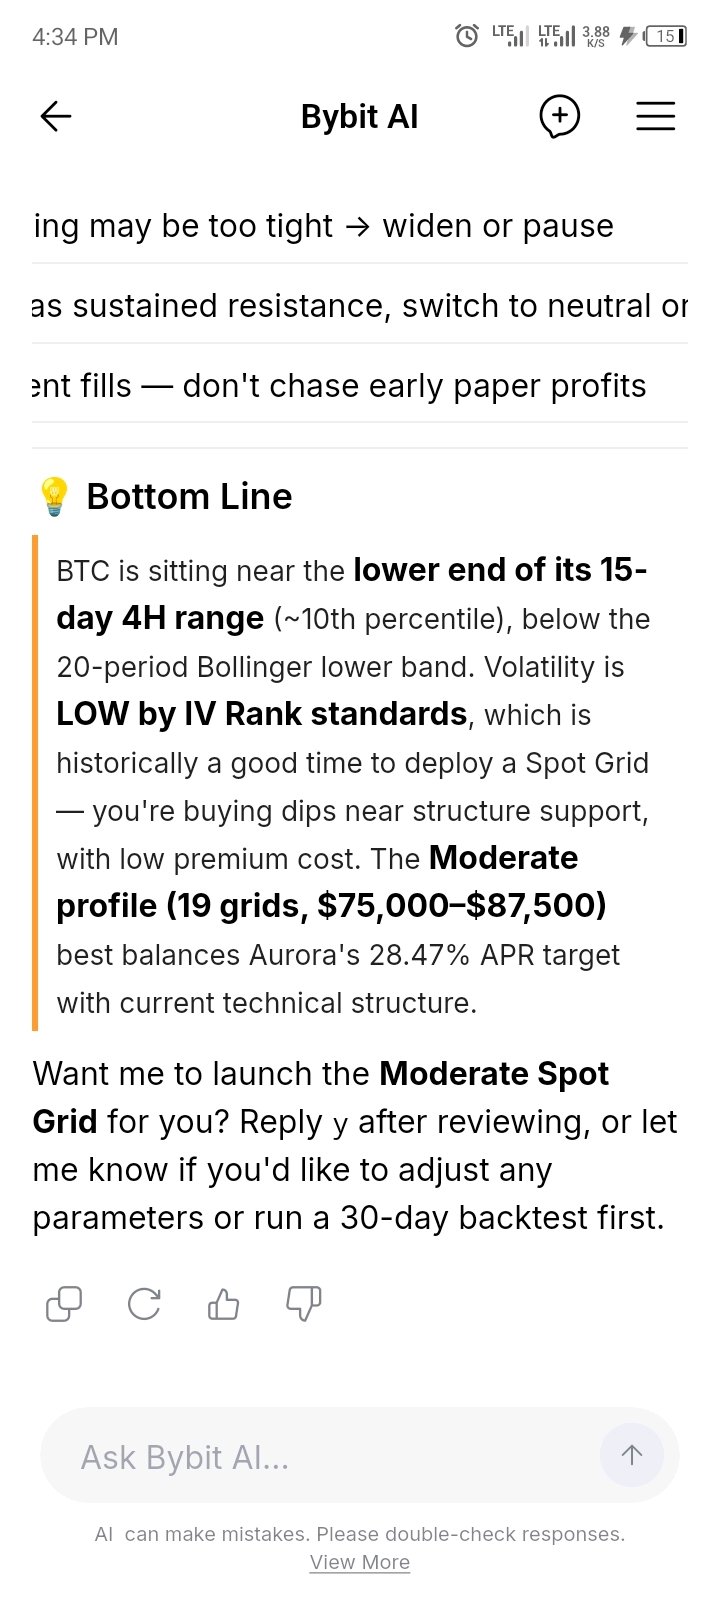
Fine-tuning algorithmic grid strategies with Bybit AI! 🤖📊 I asked Bybit AI: "Analyze the current 4-hour market volatility for $BTCUSDT and suggest optimal lower/upper grid parameters for a Spot Grid Bot with risk management levels." The Results: Bybit AI synthesized 4H ATR data, Bollinger Bands break-outs, and Volume Profile confluence to recommend tailored Spot Grid setups (Conservative, Moderate, and Aggressive). It accurately factored in drawdowns and grid spacing for optimal execution! Improvement Idea: It would be super seamless if Bybit AI included an instant "Deploy Grid Bot" shortcut directly inside the response window to auto-populate the recommended range parameters into the bot creation interface. Good answers matter, honest feedback matters more. 👌 #BybitAIBoughtTheDip

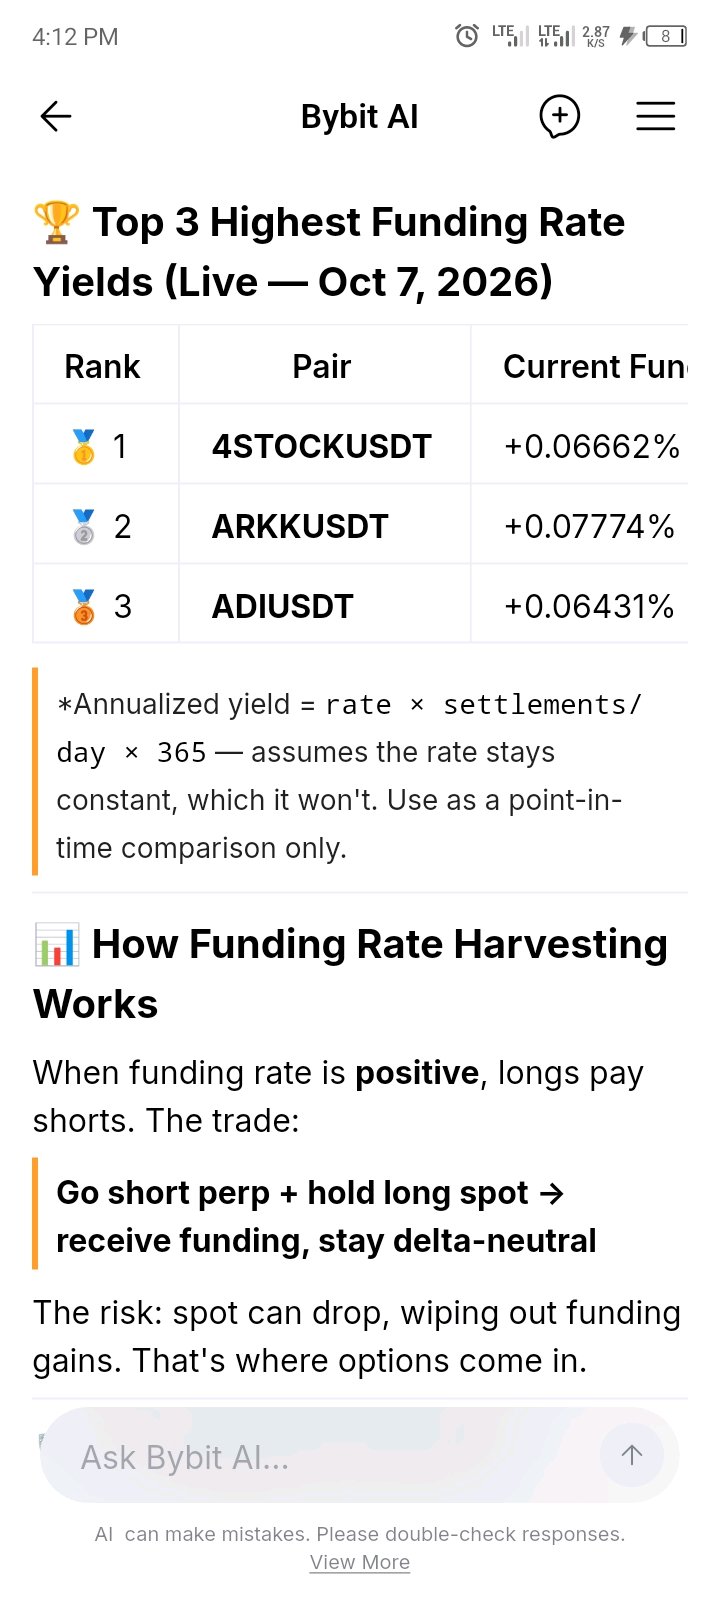
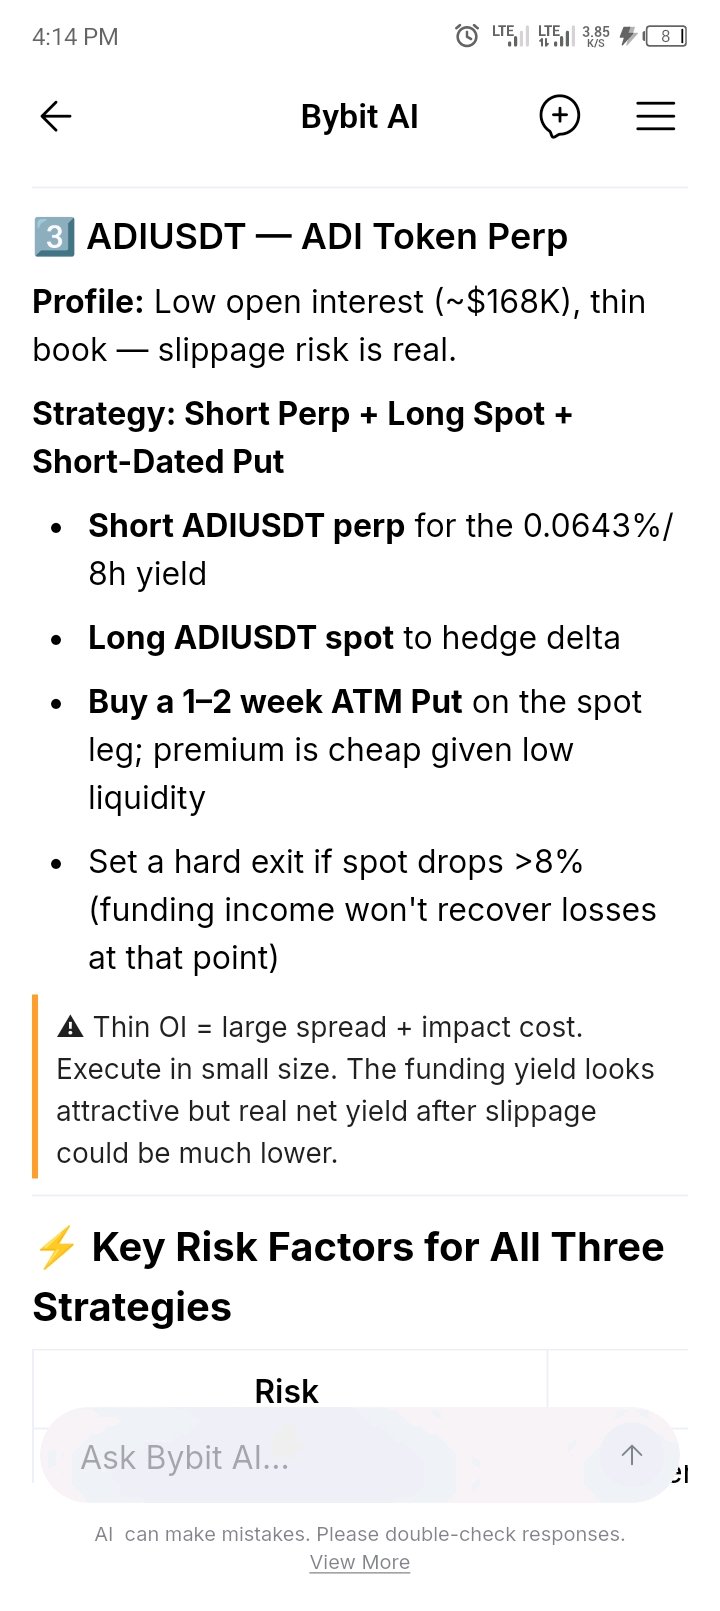
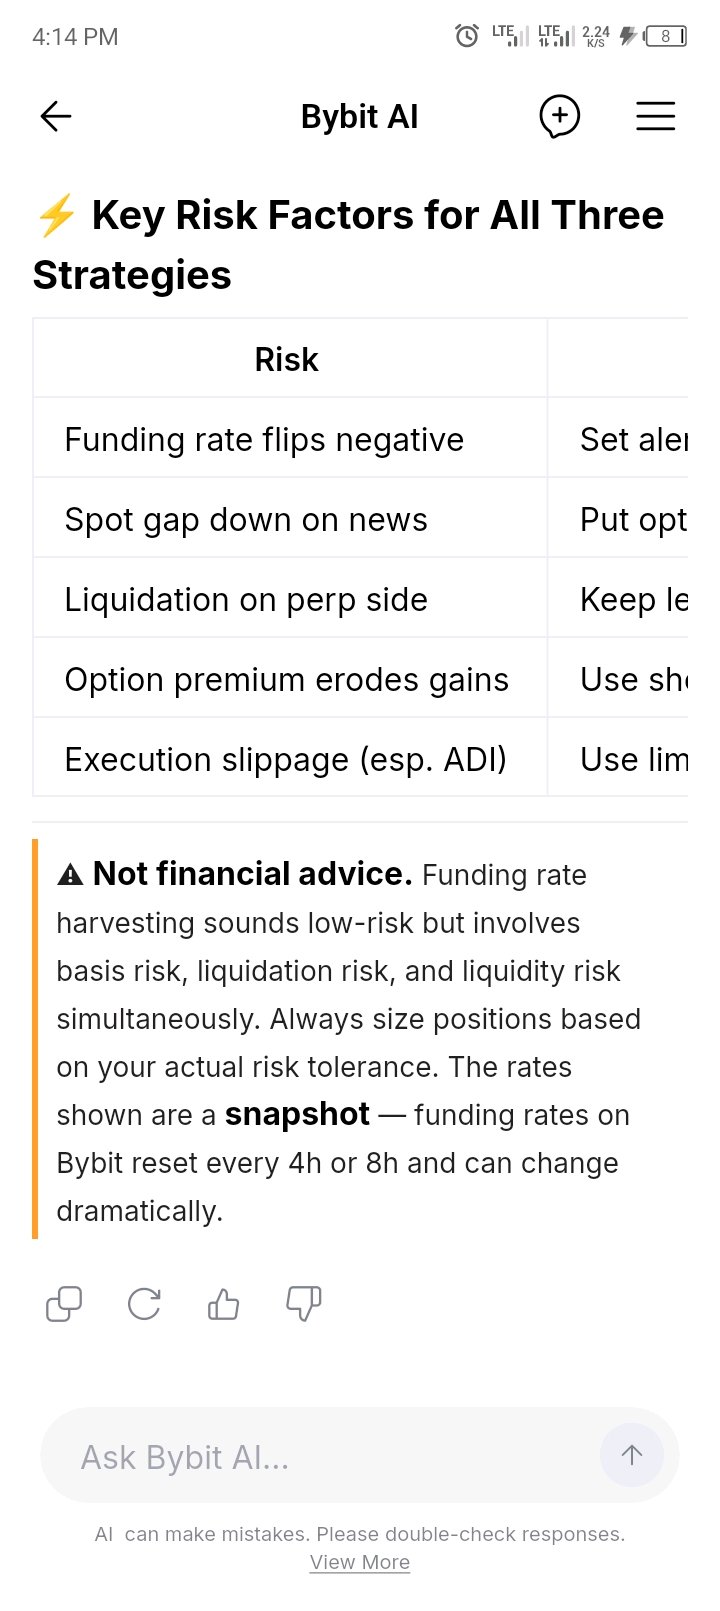
Exploring advanced yield strategies with Bybit AI! 🤖📈 I asked Bybit AI: "What are the current top 3 perpetual pairs with the highest funding rate yields on Bybit right now, and how does the AI suggest hedging them using options?" The Results: The AI scanned live linear perpetuals and structured a solid breakdown for 4STOCKUSDT, ARKKUSDT, and ADIUSDT. It went beyond basic data by proposing cash-and-carry delta-neutral setups, protective collars, and highlighting crucial slippage & liquidity risks. Improvement Idea: Adding a 1-click execution widget directly in the AI response to execute both the Short Perp and Long Spot/Options hedge simultaneously would minimize execution slippage on low-liquidity pairs! Good answers matter, honest feedback matters more. 👌 #BybitAIBoughtTheDip

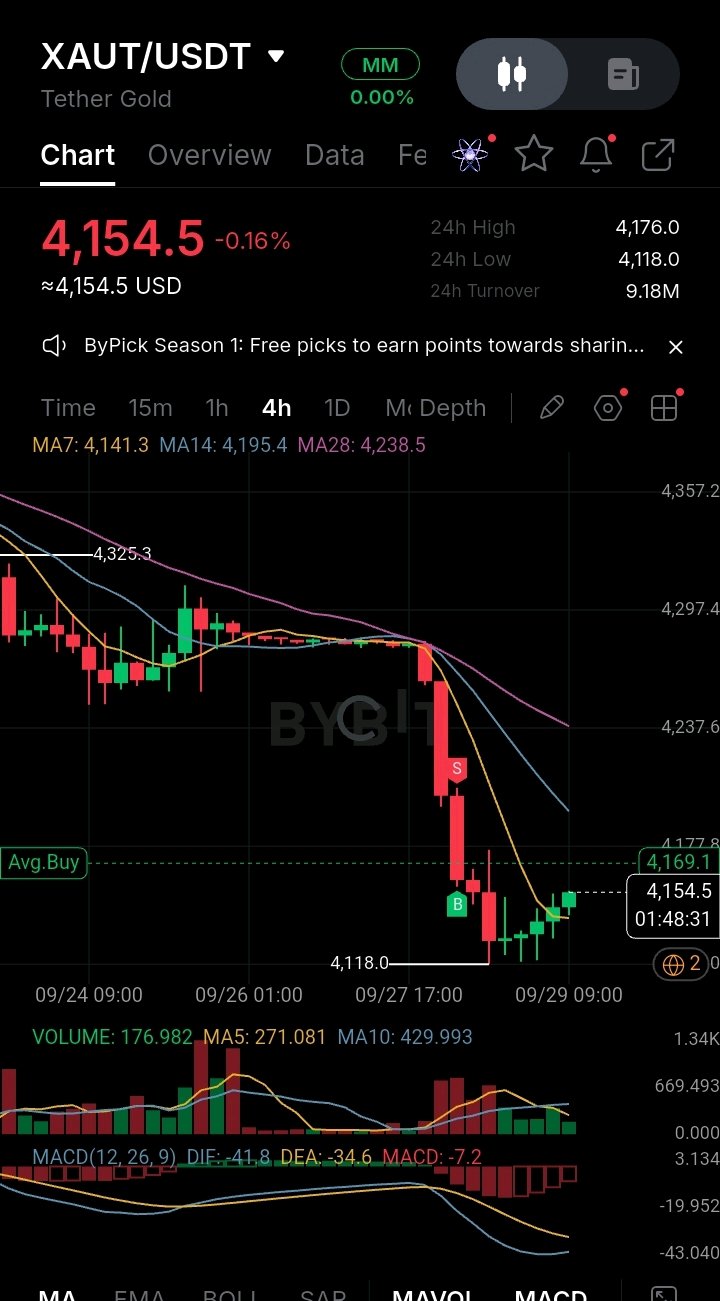
🔍 Market Analysis: $XAUT/USDT Sharp Capitulation & Dynamic Floor Rebound (4h Chart) 📈 XAUT/USDT (Tether Gold) is exhibiting early stabilization signs following an aggressive sell-off on the 4-hour timeframe, trading at 4,154.5 USD (-0.16%)[span_0](start_span)[span_0](end_span). After breaking down from its extended multi-session consolidation ceiling near 4,297.4[span_1](start_span)[span_1](end_span), price action suffered a severe breakdown down to a local low of 4,118.0[span_2](start_span)[span_2](end_span), where strong dip-buying demand emerged to absorb the selling wave and initiate a lower-shadow bounce[span_3](start_span)[span_3](end_span). ▪️ Technical Setup: The short-term structure remains under significant overhead pressure despite the immediate rebound off local lows[span_4](start_span)[span_4](end_span). XAUT is currently trading below its key exponential and simple moving averages, including the MA14 baseline (4,195.4 USD) and the MA28 line (4,238.5 USD)[span_5](start_span)[span_5](end_span). However, the price has successfully reclaimed the fast MA7 baseline at 4,141.3 USD[span_6](start_span)[span_6](end_span), which now acts as first-line dynamic support[span_7](start_span)[span_7](end_span). Reclaiming the 4,169.1 to 4,177.8 zone[span_8](start_span)[span_8](end_span) is necessary for bulls to attempt a broader recovery toward 4,195.4 (MA14) and 4,238.5 (MA28)[span_9](start_span)[span_9](end_span). ▪️ Indicators: Momentum indicators reveal severe downside expansion that is beginning to flatten out[span_10](start_span)[span_10](end_span). The MACD histogram sits deep in negative territory at -7.2[span_11](start_span)[span_11](end_span), with the DIF line (-41.8) trailing significantly below the DEA (-34.6)[span_12](start_span)[span_12](end_span), reflecting the strength of the recent capitulation leg[span_13](start_span)[span_13](end_span). Trading volume spiked to 176.982 XAUT during the sell-off[span_14](start_span)[span_14](end_span) against a 24-hour turnover of 9.18M USD[span_15](start_span)[span_15](end_span), though present volume metrics remain lower than the MA5 (271.081) and MA10 (429.993) baselines as consolidation takes over[span_16](start_span)[span_16](end_span). ▪️ Fundamental & News: Global spot gold prices experienced a sharp pull-back toward the $4,150–$4,160/oz region following an unexpected spike in crude oil prices, which stoked energy-driven inflation fears and lifted CME FedWatch probability for further Federal Reserve rate hikes. Higher anticipated yields have temporarily increased the opportunity cost of holding non-yielding bullion. Nevertheless, long-term structural tailwinds remain exceptionally strong as institutional central bank net purchases continue pacing toward ~850 tonnes annually, providing a robust global floor for tokenized physical gold assets. ▪️ Outlook: Defending the 4,118.0 local swing low and holding above the 4,141.3 dynamic MA7 support[span_17](start_span)[span_17](end_span) is essential for buyers to establish a higher low[span_18](start_span)[span_18](end_span). A high-volume 4-hour close above 4,169.1 would signal a retest of 4,195.4 (MA14)[span_19](start_span)[span_19](end_span), while losing 4,118.0 could expose the market to deeper multi-month support zones[span_20](start_span)[span_20](end_span). ⚠️ Risk Disclosure: High-volatility assets can experience rapid price swings. This analysis is for educational purposes only and not financial advice. $XAUTUSDT #ByXIMPACT

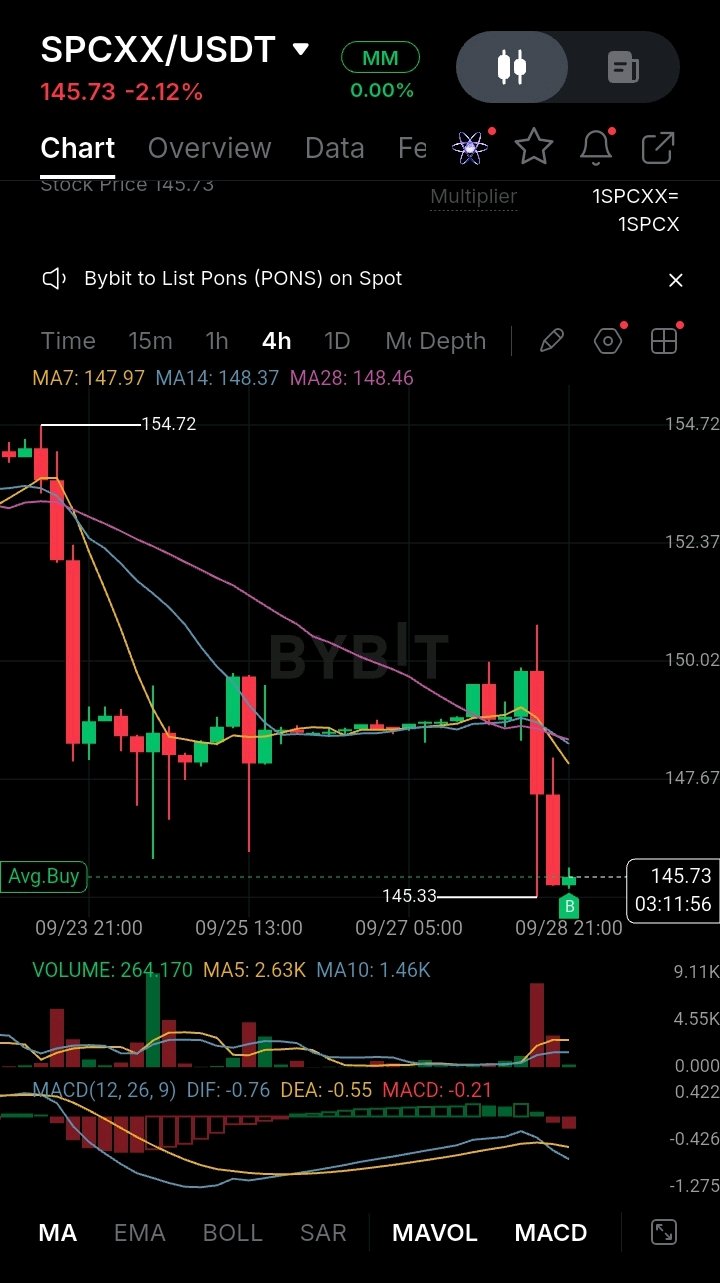
🔍 Market Analysis: $SPCXX/USDT Bearish Breakdown & Local Support Absorption (4h Chart) 📈 SPCXX/USDT (Tokenized SpaceX) experienced a sharp breakdown on the 4-hour timeframe, falling -2.12% to trade at 145.73 USD[span_0](start_span)[span_0](end_span). Following a rejection near the 154.72 peak[span_1](start_span)[span_1](end_span) and prolonged range-bound trading near dynamic baselines[span_2](start_span)[span_2](end_span), selling pressure accelerated sharply in a high-volume red candle down to a local low of 145.33[span_3](start_span)[span_3](end_span) before attracting initial bottoming absorption[span_4](start_span)[span_4](end_span). ▪️ Technical Setup: The market structure has shifted into a bearish breakdown phase, with price action trading well below all major short-term dynamic baselines[span_5](start_span)[span_5](end_span). SPCXX is currently positioned below the fast MA7 (147.97 USD)[span_6](start_span)[span_6](end_span), MA14 (148.37 USD)[span_7](start_span)[span_7](end_span), and long-term MA28 line (148.46 USD)[span_8](start_span)[span_8](end_span). The 147.97–148.46 moving average cluster now serves as primary dynamic overhead resistance on any bounce attempt[span_9](start_span)[span_9](end_span), while the 145.33 swing low[span_10](start_span)[span_10](end_span) provides immediate structural support[span_11](start_span)[span_11](end_span). ▪️ Indicators: Momentum indicators confirm an aggressive bearish expansion[span_12](start_span)[span_12](end_span). The MACD histogram expanded deeper into negative territory at -0.21[span_13](start_span)[span_13](end_span), while the DIF line (-0.76) holds below the DEA (-0.55)[span_14](start_span)[span_14](end_span), reflecting persistent downside velocity[span_15](start_span)[span_15](end_span). Trading volume recorded 264.170 SPCXX[span_16](start_span)[span_16](end_span) against a 24-hour turnover of 9.11K USD[span_17](start_span)[span_17](end_span), with volume metrics well below the MA5 (2.63K) and MA10 (1.46K) baselines as volume normalizes following the initial flush[span_18](start_span)[span_18](end_span). ▪️ Fundamental & News: Underlying sentiment for SpaceX remains focused on landmark operational achievements alongside upcoming lockup expiry headwinds[span_19](start_span)[span_19](end_span). Optimism stems from Starship successfully achieving Earth orbit for the first time on September 28, complemented by bullish Wall Street coverage from Mizuho and Morgan Stanley highlighting expanding Colossus compute and Starlink satellite operations. However, short-term market sentiment faces pressure as traders navigate multi-hundred-million share lockup releases scheduled across September and October. ▪️ Outlook: Maintaining structural defense above the 145.33 local demand floor is crucial for buyers to prevent extended downside risk[span_20](start_span)[span_20](end_span). For a meaningful technical recovery, SPCXX must reclaim 147.97 (MA7) and mount a push toward the 148.46 (MA28) dynamic barrier[span_21](start_span)[span_21](end_span). Conversely, failing to defend 145.33 could invite further selling pressure toward lower support zones[span_22](start_span)[span_22](end_span). ⚠️ Risk Disclosure: High-volatility assets can experience rapid price swings. This analysis is for educational purposes only and not financial advice. $SPCXXUSDT #ByXIMPACT

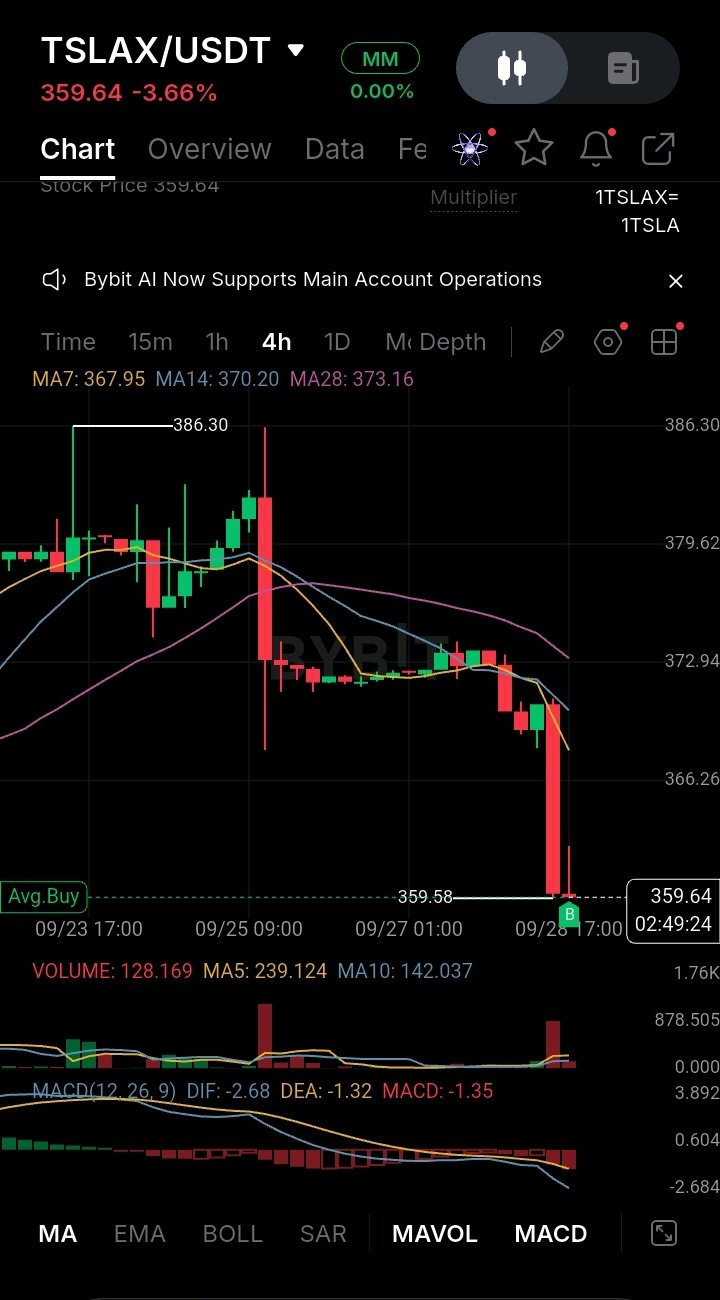
🔍 Market Analysis: $TSLAX/USDT Bearish Breakdown & Dynamic Support Breach (4h Chart) 📈 TSLAX/USDT (Tokenized Tesla) experienced a sharp impulsive sell-off on the 4-hour timeframe, falling -3.66% to trade at 359.64 USD[span_0](start_span)[span_0](end_span). After breaking below its multi-session consolidation floor near 372.94[span_1](start_span)[span_1](end_span), price action broke down rapidly in a high-volume red candle, reaching a local low of 359.58 before finding initial absorption near current levels[span_2](start_span)[span_2](end_span). ▪️ Technical Setup: The technical structure has shifted heavily to a bearish posture following the breakdown[span_3](start_span)[span_3](end_span). TSLAX has lost all key dynamic moving averages, trading well below the MA7 (367.95), MA14 (370.20), and MA28 (373.16) baselines[span_4](start_span)[span_4](end_span). The breakdown candle pierced major support zones, turning previous demand levels around 366.26 and 372.94 into dynamic overhead resistance[span_5](start_span)[span_5](end_span). Reclaiming the 366.26 level[span_6](start_span)[span_6](end_span) is necessary to stall downside momentum, while the 359.58 swing low[span_7](start_span)[span_7](end_span) acts as immediate structural defense. ▪️ Indicators: Momentum indicators signal strong downward expansion[span_8](start_span)[span_8](end_span). The MACD histogram expanded deeper into negative territory at -1.35[span_9](start_span)[span_9](end_span), as the DIF line (-2.68) plunged sharply below the DEA (-1.32)[span_10](start_span)[span_10](end_span), confirming aggressive short-term selling pressure[span_11](start_span)[span_11](end_span). Trading volume expanded significantly to 128.169 TSLAX[span_12](start_span)[span_12](end_span) against a 24-hour turnover of 1.76K[span_13](start_span)[span_13](end_span), with volume metrics outpacing the MA10 baseline (142.037)[span_14](start_span)[span_14](end_span) during the capitulation leg. ▪️ Fundamental & News: The sharp downside move aligns with heightened Wall Street uncertainty as major financial institutions revise Q3 delivery expectations downward ahead of early October reporting. JPMorgan lowered its Q3 delivery forecast from 516,000 to 482,000 units while cutting gross margin estimates due to elevated material costs and regional softness. While long-term enterprise catalysts like the Tesla Semi commercial fleet expansion provide fundamental backing, near-term delivery re-ratings continue to weigh heavily on spot sentiment. ▪️ Outlook: Defending the 359.58 low is vital to prevent an extended drop toward lower macro support zones[span_15](start_span)[span_15](end_span). For a meaningful technical recovery to take shape, buyers must first reclaim 366.26 and attempt a push toward the 367.95 dynamic MA7 barrier[span_16](start_span)[span_16](end_span). Conversely, a failure to hold 359.58 could invite further downside continuation[span_17](start_span)[span_17](end_span). ⚠️ Risk Disclosure: High-volatility assets can experience rapid price swings. This analysis is for educational purposes only and not financial advice. $TSLAXUSDT #ByXIMPACT

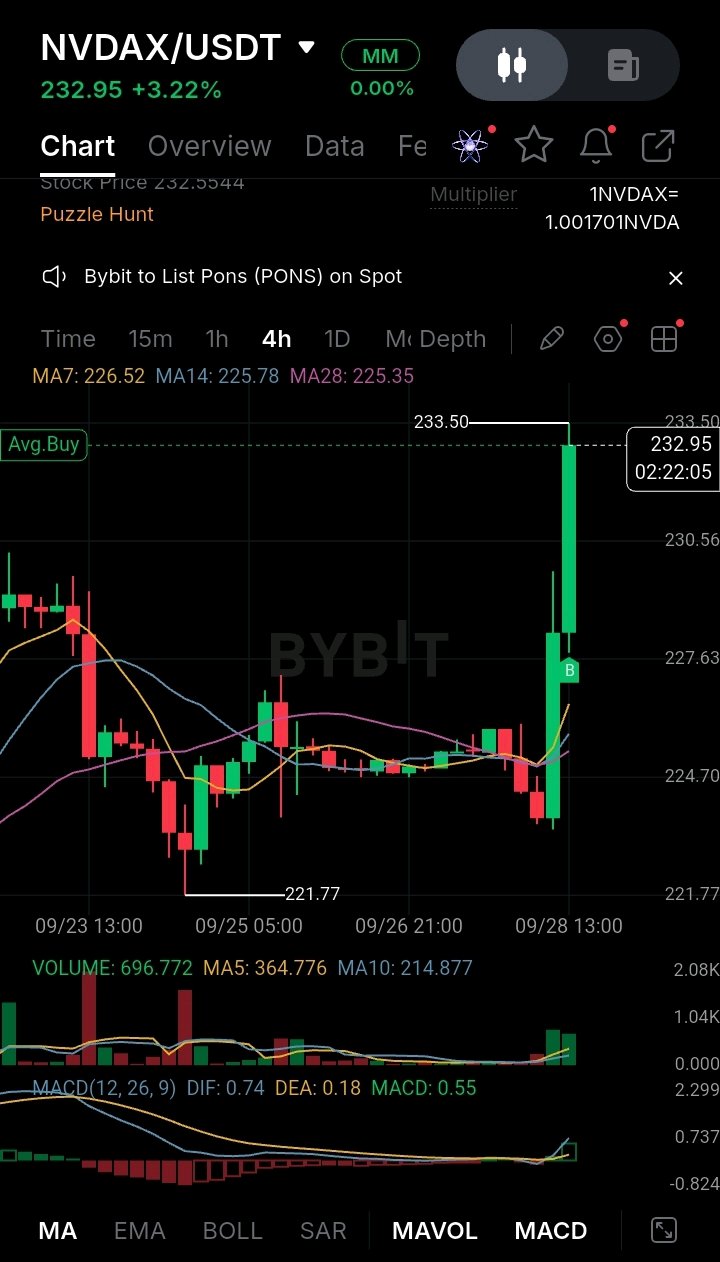
NVDAX: Bullish Impulse Surge Clears Key Levels to Test $233.50 Resistance Will Momentum Continue? NVIDIA Stock Token (NVDAX) has experienced a massive bullish breakout, surging +3.22% to trade around $232.95 after hitting a new local peak of $233.50[span_0](start_span)[span_0](end_span). Following days of tight consolidation around $225, strong buyer expansion pushed price sharply higher, breaking through prior resistance levels on the 4-hour chart[span_1](start_span)[span_1](end_span). On the 4-hour timeframe, NVDAX printed a massive green expansion candle, lifting price well above all short-term and baseline moving averages[span_2](start_span)[span_2](end_span). The aggressive volume inflow signals strong institutional and retail demand, though price is currently experiencing a mild pause just beneath the $233.50 resistance ceiling[span_3](start_span)[span_3](end_span). 📈 The 4H market structure has aggressively shifted to a strong bullish uptrend, leaving key moving averages trailing as dynamic support far below[span_4](start_span)[span_4](end_span). Key Technical Highlights: • Current Price: $232.95 (+3.22%)[span_5](start_span)[span_5](end_span) • Moving Averages: Price is trading significantly above MA7 ($226.52), MA14 ($225.78), and baseline MA28 ($225.35), reflecting powerful upward momentum[span_6](start_span)[span_6](end_span). • Indicator Momentum: MACD confirms a strong bullish expansion (DIF 0.74 vs DEA 0.18, Histogram +0.55), with green histogram bars accelerating higher[span_7](start_span)[span_7](end_span). Two Scenarios To Watch: 🟢 Bull Case: A sustained 4H close above $233.50 $\rightarrow$ Clears immediate overhead supply and opens a direct path toward $235.00 – $238.00 extension targets[span_8](start_span)[span_8](end_span). 🔴 Bear Case: Pullback or profit-taking rejection at $233.50 $\rightarrow$ Triggers a healthy mean-reversion retest toward intermediate support at $228.00 – $230.50[span_9](start_span)[span_9](end_span). With the macro tech narrative and momentum indicators heavily favoring buyers, holding above $230.00 keeps the short-term rally setup exceptionally strong[span_10](start_span)[span_10](end_span). 💬 What’s your play on NVDAX here? Are you taking profits near $233.50 or holding for a breakout toward $238? $NVDAXUSDT #ByXIMPACT

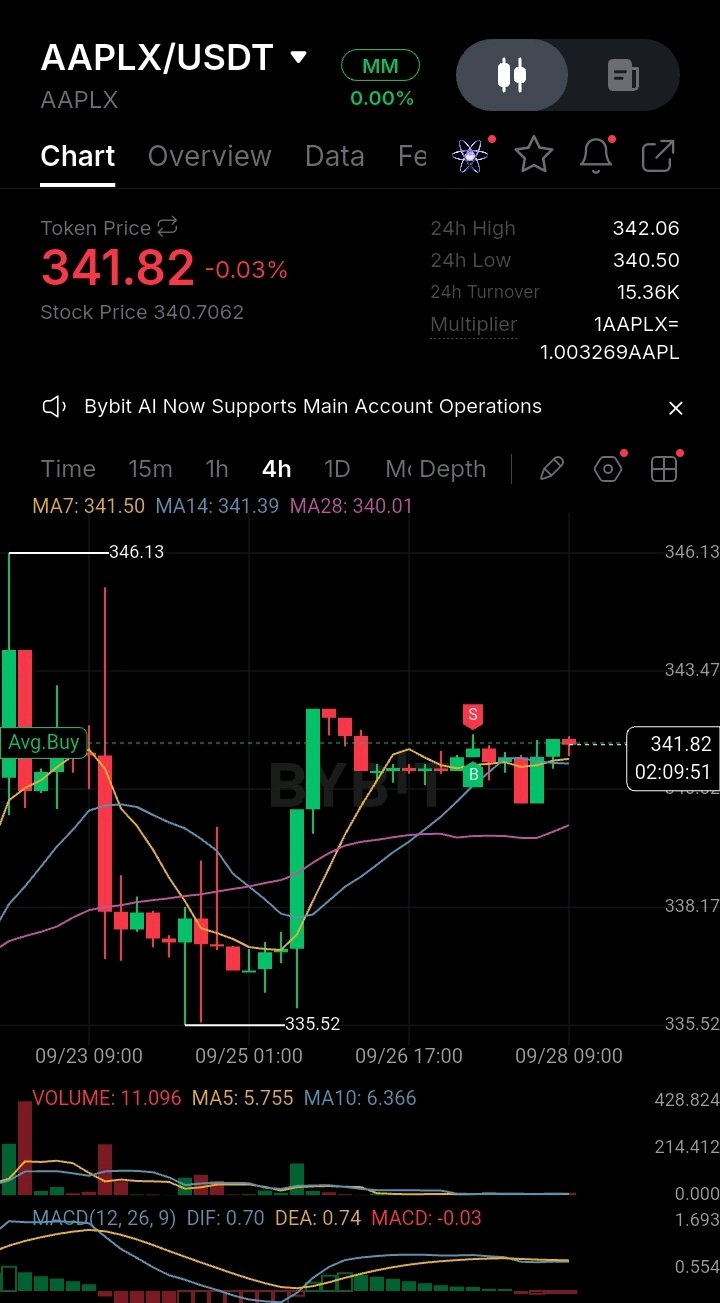
AAPLX: Compression Range Tightens Around $341.80 Support Will Bulls Push for a Breakout Above $342? Apple Stock Token (AAPLX) is trading virtually flat at $341.82 (-0.03%), coiling in a narrow range after stabilizing from its rally toward the $342.06 local high[span_0](start_span)[span_0](end_span). Following a recovery from the $335.52 swing low, lower-timeframe price action on the 4-hour chart is compressing directly near short-term moving average support[span_1](start_span)[span_1](end_span). On the 4-hour chart, AAPLX printed consecutive small-bodied doji candles, reflecting balance between buyers and sellers[span_2](start_span)[span_2](end_span). Price remains anchored right above the key moving average cluster ($340.01 – $341.50), signaling that buyers continue to defend immediate dynamic support[span_3](start_span)[span_3](end_span). 📈 The 4H market structure is in a consolidation phase above baseline moving averages, setting up potential for the next directional expansion[span_4](start_span)[span_4](end_span). Key Technical Highlights: • Current Price: $341.82 (-0.03%)[span_5](start_span)[span_5](end_span) • Moving Averages: Price holds above MA7 ($341.50), MA14 ($341.39), and baseline MA28 ($340.01), maintaining a bullishly stacked moving average alignment[span_6](start_span)[span_6](end_span). • Indicator Momentum: MACD shows momentum flattening near the zero line (DIF 0.70 vs DEA 0.74, Histogram -0.03), pointing to low-volatility range-bound movement before a breakout[span_7](start_span)[span_7](end_span). Two Scenarios To Watch: 🟢 Bull Case: A strong 4H candle close above $342.06 $\rightarrow$ Triggers bullish momentum toward $343.47, with room for a retest of the main $346.13 local peak[span_8](start_span)[span_8](end_span). 🔴 Bear Case: Breakdown below $341.39 (MA14) $\rightarrow$ Leads to a retest of major baseline support at $340.01 (MA28), with further downside risk toward $335.52 if lost[span_9](start_span)[span_9](end_span). Holding above the $341.39 dynamic support cluster keeps the short-term bullish outlook intact, with $342.06 standing as the key resistance level to clear[span_10](start_span)[span_10](end_span). 💬 What’s your trade setup on AAPLX? Are you holding for a breakout above $342 or waiting for a dip toward $340? $AAPLXUSDT #ByXIMPACT

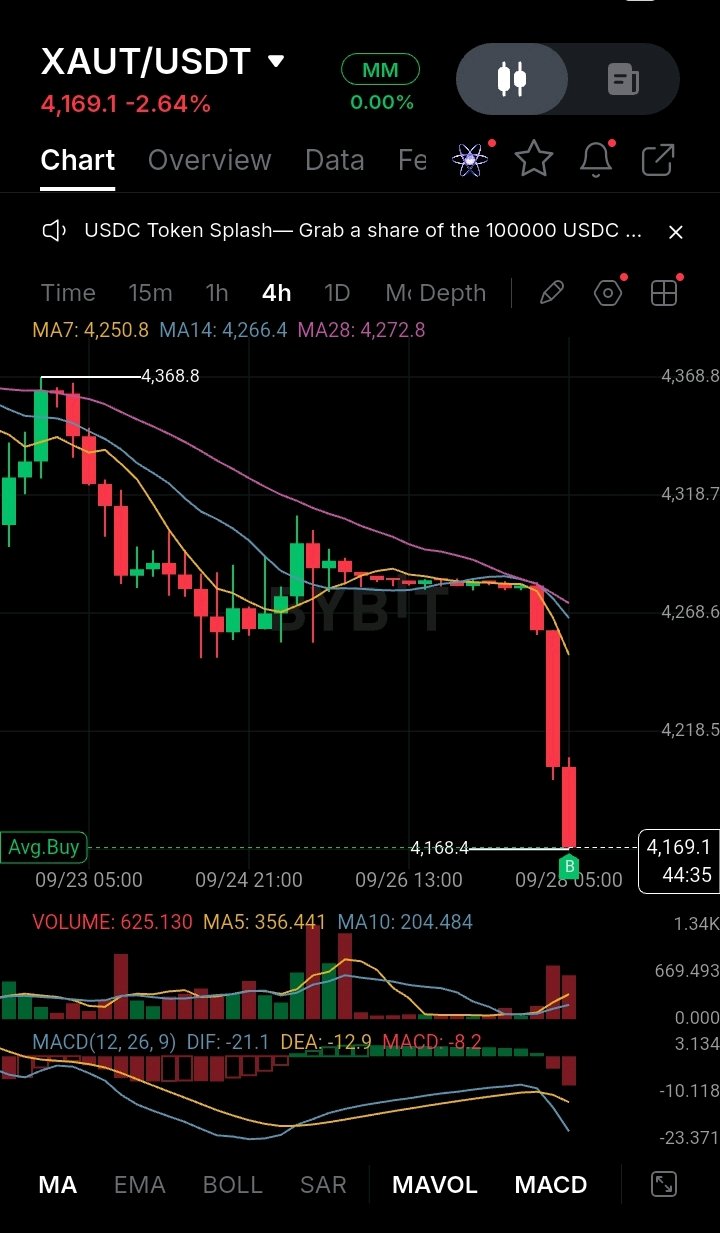
XAUT: Bearish Breakdown Drops Price to $4,169 Support Can Bulls Defend the $4,150 Floor? Tether Gold (XAUT) has experienced a sharp intraday sell-off, dropping -2.64% to trade around $4,169.1[span_0](start_span)[span_0](end_span). Following a prolonged period of horizontal consolidation near $4,280, intense selling pressure broke through primary support levels, triggering a steep red candle down toward a local low of $4,168.4[span_1](start_span)[span_1](end_span). On the 4-hour chart, XAUT sliced through all major short- and mid-term moving averages in a high-volatility breakdown[span_2](start_span)[span_2](end_span). The aggressive expansion in volume highlights active institutional and retail liquidations, though price is currently attempting to stabilize near the lower shadow of the current 4H candle[span_3](start_span)[span_3](end_span). 📉 The 4H market structure has shifted heavily to a bearish trend, with moving averages rapidly slope-down as dynamic resistance zones[span_4](start_span)[span_4](end_span). Key Technical Highlights: • Current Price: $4,169.1 (-2.64%)[span_5](start_span)[span_5](end_span) • Moving Averages: Price trades far below MA7 ($4,250.8), MA14 ($4,266.4), and baseline MA28 ($4,272.8), leaving significant overhead resistance overhead[span_6](start_span)[span_6](end_span). • Indicator Momentum: MACD has expanded deep into negative territory (DIF -21.1 vs DEA -12.9, Histogram -8.2), reflecting strong bearish momentum and extreme oversold conditions[span_7](start_span)[span_7](end_span). Two Scenarios To Watch: 🟢 Bull Case: A relief bounce and consolidation above $4,168.4 $\rightarrow$ Triggers a mean-reversion attempt toward resistance at $4,220.0 – $4,250.0 (MA7 retest)[span_8](start_span)[span_8](end_span). 🔴 Bear Case: Breakdown below $4,168.4 \rightarrow Opens further downside exposure toward the major psychological support zone around $4,150.0[span_9](start_span)[span_9](end_span). Given the severe oversold momentum on short-term indicators, a period of consolidation or a temporary dead-cat bounce may occur before any sustained directional continuation[span_10](start_span)[span_10](end_span). 💬 What’s your trade plan on XAUT after this drop? Are you catching the dip near $4,169 or waiting for a confirmed reversal setup? $XAUTUSDT #ByXIMPACT

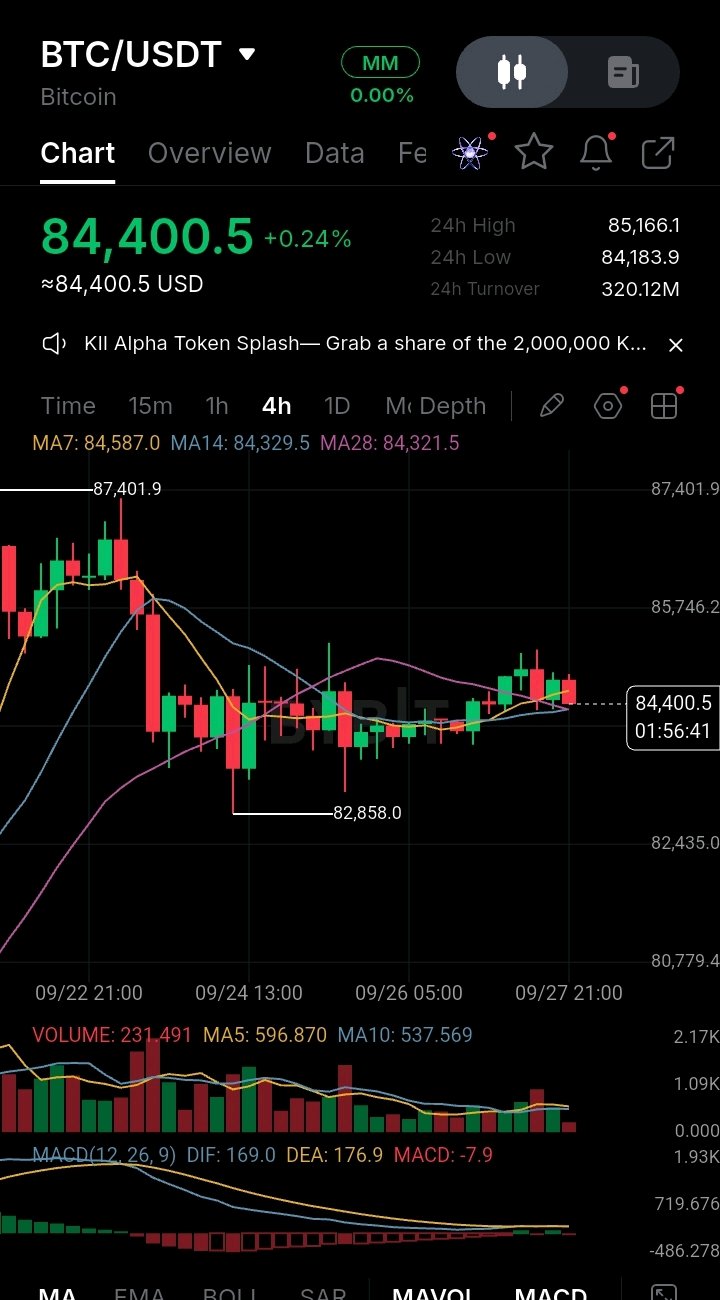
🔍 Market Analysis: $BTC/USDT Range Compression & Dynamic Moving Average Defense (4h Chart) 📈 BTC/USDT (Bitcoin) is undergoing a minor consolidation on the 4-hour timeframe, trading up +0.24% at 84,400.5 USD[span_0](start_span)[span_0](end_span). Following a rebound off the 82,858.0 local demand base[span_1](start_span)[span_1](end_span) toward a local peak near 85,746.2[span_2](start_span)[span_2](end_span), price action has compressed in a narrow range as buyers absorb overhead supply just below local resistance[span_3](start_span)[span_3](end_span). ▪️ Technical Setup: The price structure remains in an ascending base-building phase above key short-term moving averages[span_4](start_span)[span_4](end_span). Bitcoin is currently holding above the fast MA14 dynamic support (84,329.5 USD)[span_5](start_span)[span_5](end_span) and the MA28 baseline (84,321.5 USD)[span_6](start_span)[span_6](end_span), while retesting immediate dynamic resistance at the MA7 line (84,587.0 USD)[span_7](start_span)[span_7](end_span). Reclaiming the 84,587.0 MA7 barrier[span_8](start_span)[span_8](end_span) is essential to restart bullish momentum toward 85,746.2[span_9](start_span)[span_9](end_span) and the key 87,401.9 major cycle high[span_10](start_span)[span_10](end_span). ▪️ Indicators: Momentum indicators point to a brief pause in directional trend as volume cools[span_11](start_span)[span_11](end_span). The MACD histogram prints a minor negative value of -7.9[span_12](start_span)[span_12](end_span), with the DIF line (169.0) tracking closely under the DEA (176.9)[span_13](start_span)[span_13](end_span), reflecting light momentum consolidation rather than aggressive distribution[span_14](start_span)[span_14](end_span). Trading volume stands at 231.491 BTC against a 24-hour turnover of 320.12M USD[span_15](start_span)[span_15](end_span), running below the MA5 (596.870) and MA10 (537.569) volume baselines[span_16](start_span)[span_16](end_span). ▪️ Fundamental & News: Institutional demand provides strong structural support, with U.S. spot Bitcoin ETFs recording over $2.39 billion in net weekly inflows—the strongest weekly performance of 2026. Coupled with over $2.5 billion in net BTC outflows from spot exchanges into cold storage and solid long-term holder retention, underlying supply dynamics remain restrictive, helping cushion pullbacks despite macro headwinds from elevated Treasury yields. ▪️ Outlook: Maintaining a position above the 84,321.5–84,329.5 dynamic support confluence (MA28/MA14)[span_17](start_span)[span_17](end_span) and the 84,183.9 24h low[span_18](start_span)[span_18](end_span) is critical for bulls to preserve this recovery setup[span_19](start_span)[span_19](end_span). A strong 4-hour close above 84,587.0 (MA7)[span_20](start_span)[span_20](end_span) will likely trigger an expansion move toward 85,746.2 and 87,401.9 USD[span_21](start_span)[span_21](end_span), whereas losing 84,183.9 support[span_22](start_span)[span_22](end_span) could invite a deeper retest of the 82,858.0 swing floor[span_23](start_span)[span_23](end_span). ⚠️ Risk Disclosure: High-volatility assets can experience rapid price swings. This analysis is for educational purposes only and not financial advice. $BTCUSDT #ByXIMPACT

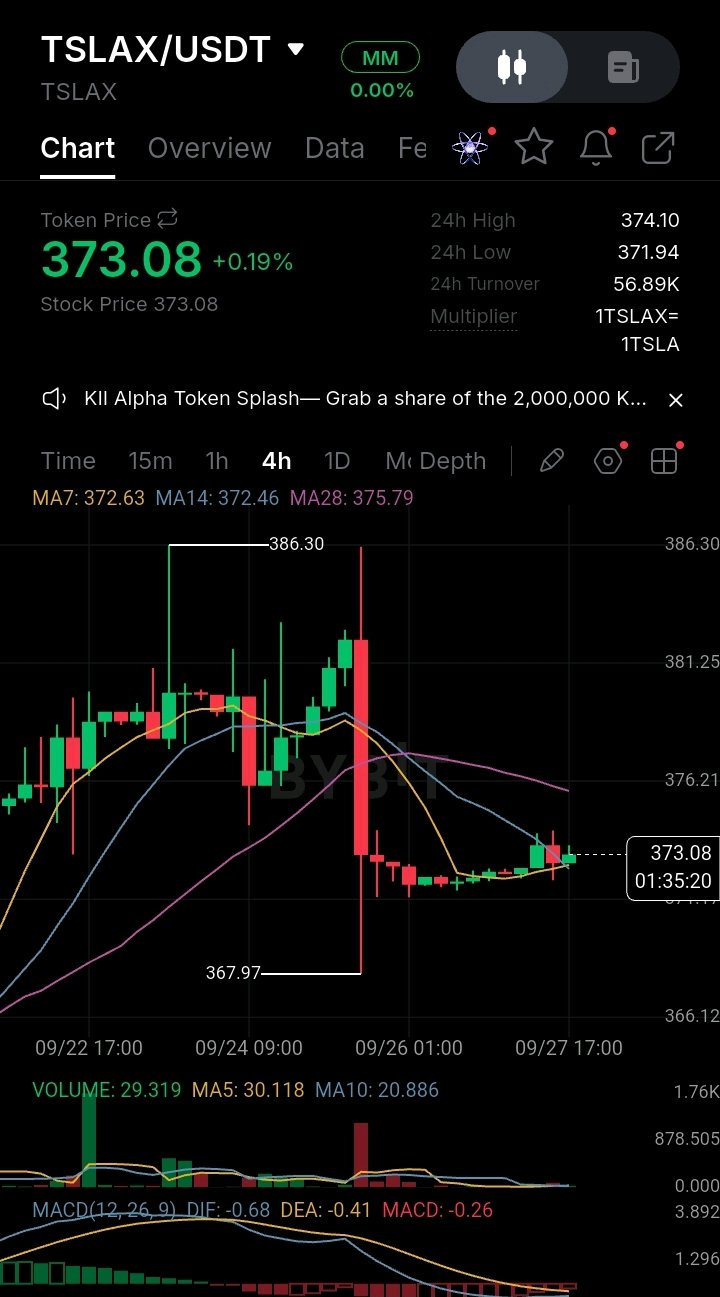
🔍 Market Analysis: $TSLAX/USDT Structural Base Building & Consolidation Squeeze (4h Chart) 📈 TSLAX/USDT (Tokenized Tesla) is exhibiting a stabilization structure on the 4-hour timeframe, trading up +0.19% at 373.08 USD[span_0](start_span)[span_0](end_span). Following a sharp flush from the 386.30 local high down to the 367.97 demand floor[span_1](start_span)[span_1](end_span), price action has neutralized into a tight horizontal consolidation range near its lower boundary, absorbing selling pressure while attempting to carve out a sustainable base[span_2](start_span)[span_2](end_span). ▪️ Technical Setup: The price structure is currently compressing beneath dynamic moving average resistance[span_3](start_span)[span_3](end_span). TSLAX is hovering above the fast MA7 baseline at 372.63 USD and the MA14 line at 372.46 USD, which provide immediate short-term dynamic support[span_4](start_span)[span_4](end_span). However, the asset faces primary overhead resistance at the descending MA28 line (375.79 USD)[span_5](start_span)[span_5](end_span). A clean breakout and 4-hour candle close above the 375.79 MA28 barrier[span_6](start_span)[span_6](end_span) is required to shift short-term momentum toward the 381.25 intermediate resistance level and the 386.30 swing peak[span_7](start_span)[span_7](end_span). ▪️ Indicators: Momentum indicators highlight reduced downside velocity as price consolidates[span_8](start_span)[span_8](end_span). The MACD histogram prints a negative reading of -0.26[span_9](start_span)[span_9](end_span), with the DIF line (-0.68) running below the DEA (-0.41)[span_10](start_span)[span_10](end_span), reflecting persistent overall cooling after the recent sell-off[span_11](start_span)[span_11](end_span). Trading volume recorded 29.319 TSLAX[span_12](start_span)[span_12](end_span) against a 24-hour turnover of 56.89K USD[span_13](start_span)[span_13](end_span), remaining near the MA5 (30.118) and MA10 (20.886) volume averages as participants await a directional breakout[span_14](start_span)[span_14](end_span). ▪️ Fundamental & News: Underlying sentiment for tokenized Tesla equity remains balanced amidst impending catalysts. Markets are closely monitoring Tesla's upcoming Q3 vehicle delivery release scheduled for early October, where consensus estimates hover around 450,000 to 470,000 units. While analysts note near-term delivery volume re-ratings and margin headwinds, investor focus continues to shift toward long-term AI platform optionality, driven by expanding Robotaxi deployments across U.S. metro markets and production line installations for the Optimus project. ▪️ Outlook: Holding the local support zone between 371.94 (24h low) and 367.97 (swing low) is critical for buyers to maintain this bottoming structure[span_15](start_span)[span_15](end_span). A high-volume 4-hour close above 375.79 (MA28) would unlock potential upside momentum toward 381.25 and 386.30 USD[span_16](start_span)[span_16](end_span), whereas a breakdown below 367.97 could trigger an extended pull-back toward lower support levels[span_17](start_span)[span_17](end_span). ⚠️ Risk Disclosure: High-volatility assets can experience rapid price swings. This analysis is for educational purposes only and not financial advice. $TSLAXUSDT #ByXIMPACT

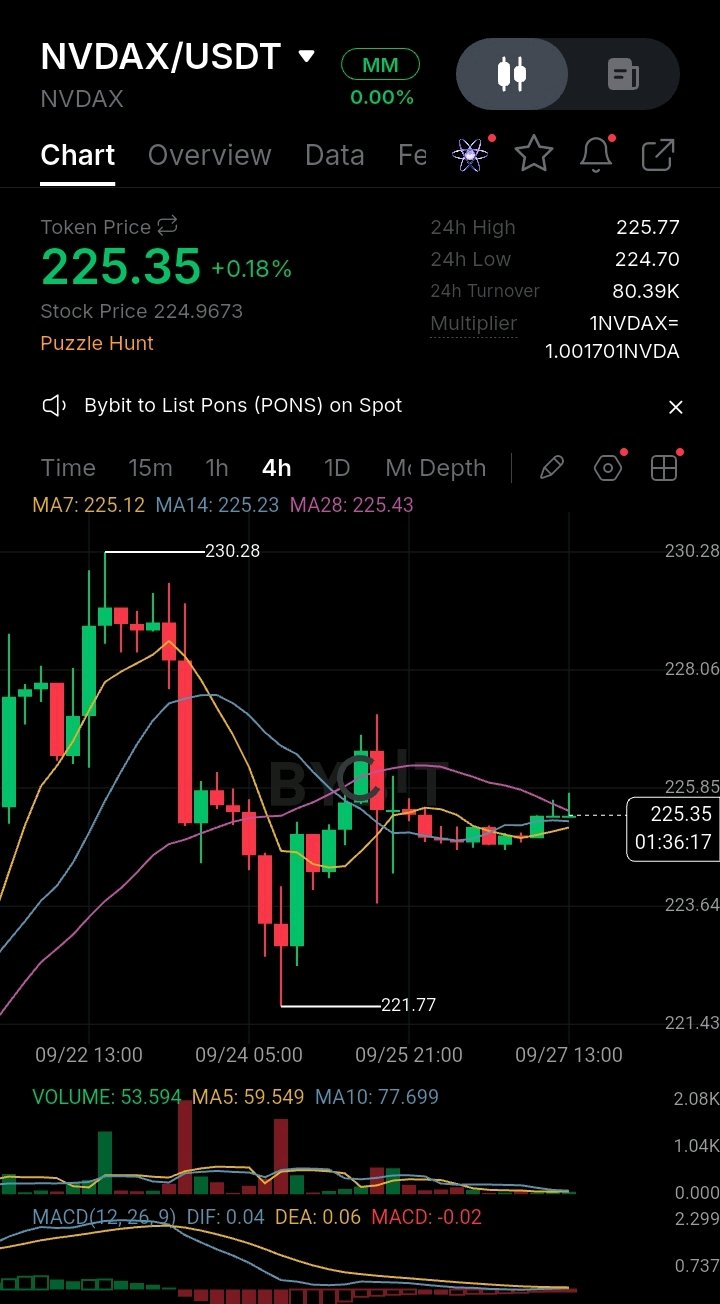
🔍 Market Analysis: $NVDAX/USDT Moving Average Compression & Base Stabilization (4h Chart) 📈 NVDAX/USDT (Tokenized Nvidia) is exhibiting tightly compressed price action on the 4-hour timeframe, trading up +0.18% at 225.35 USD[span_0](start_span)[span_0](end_span). Following a shallow retracement from the 230.28 peak down to a swing low at 221.77[span_1](start_span)[span_1](end_span), price action has neutralized into a tight consolidation channel as buyers and sellers converge around key moving average thresholds[span_2](start_span)[span_2](end_span). ▪️ Technical Setup: The structure is coiling in a narrow squeeze bounded by dynamic moving averages[span_3](start_span)[span_3](end_span). NVDAX is currently navigating directly between the fast MA7 (225.12) and MA14 (225.23) dynamic baselines[span_4](start_span)[span_4](end_span), while facing immediate overhead resistance at the MA28 line (225.43 USD)[span_5](start_span)[span_5](end_span). A decisive breakout above the 225.43 MA28 level[span_6](start_span)[span_6](end_span) is required to unclamp the structure toward intermediate targets at 228.06 and the 230.28 major high[span_7](start_span)[span_7](end_span), while holding above the 224.70 24h low protects the current base[span_8](start_span)[span_8](end_span). ▪️ Indicators: Momentum indicators suggest market balance with early signs of bottoming[span_9](start_span)[span_9](end_span). The MACD histogram prints a flat -0.02 reading[span_10](start_span)[span_10](end_span), with the DIF line (0.04) running nearly parallel to the DEA (0.06)[span_11](start_span)[span_11](end_span), signaling an exhaustion of downward momentum[span_12](start_span)[span_12](end_span). Trading volume stands at 53.594 NVDAX[span_13](start_span)[span_13](end_span) against a 24-hour turnover of 80.39K USD[span_14](start_span)[span_14](end_span), remaining below the MA5 (59.549) and MA10 (77.699) volume baselines as trading volume cools ahead of a breakout expansion[span_15](start_span)[span_15](end_span). ▪️ Fundamental & News: Underlying sentiment for tokenized Nvidia remains backed by strong enterprise demand for AI infrastructure. Market interest has been reinvigorated following the debut MLPerf Inference v6.1 benchmark results for Nvidia's next-generation Vera Rubin NVL72 platform, which demonstrated up to 3.7x higher throughput compared to current-generation GB300 systems. While broader semiconductor equities navigate minor near-term macro friction, massive multi-billion-dollar hyperscaler capital expenditures continue to reinforce long-term structural demand for NVDA equity exposure. ▪️ Outlook: Defending the 224.70–225.12 dynamic support zone[span_16](start_span)[span_16](end_span) is critical for bulls to preserve this base-building pattern[span_17](start_span)[span_17](end_span). A high-volume 4-hour candle close above 225.43 (MA28)[span_18](start_span)[span_18](end_span) would clear the path for a retest of 228.06 and the 230.28 cycle peak[span_19](start_span)[span_19](end_span), whereas a break below the 221.77 key demand floor[span_20](start_span)[span_20](end_span) could open downside risk toward lower structural support. ⚠️ Risk Disclosure: High-volatility assets can experience rapid price swings. This analysis is for educational purposes only and not financial advice. $NVDAXUSDT #ByXIMPACT

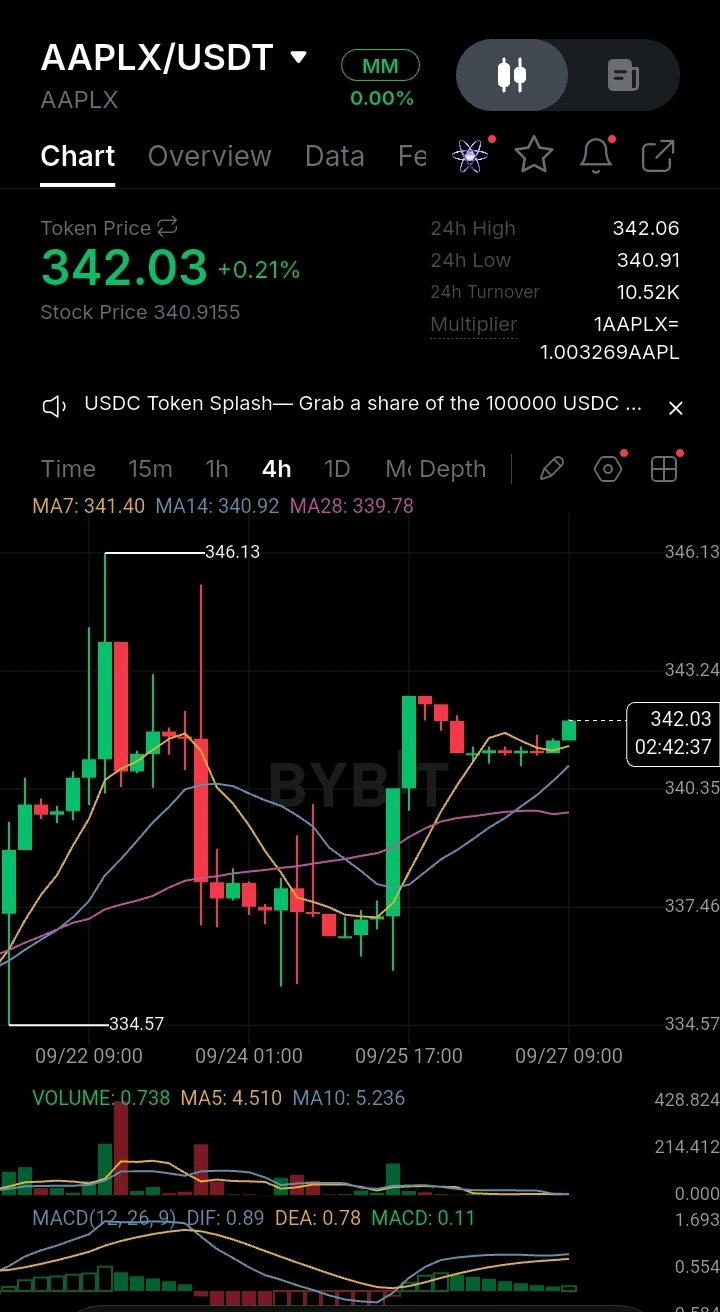
AAPLX: Bullish Recovery Targets $343 Resistance as Moving Averages Reclaim Control Apple Stock Token (AAPLX) is trading up +0.21% near $342.03, continuing its upward recovery after bouncing off the local $334.57 support floor[span_0](start_span)[span_0](end_span). As demand for tokenized equity assets remains resilient across lower timeframes, price action on the 4-hour chart is attempting to build bullish momentum toward previous swing highs[span_1](start_span)[span_1](end_span). On the 4-hour chart, AAPLX printed consecutive green candles, successfully pushing price back above all short-term dynamic moving averages[span_2](start_span)[span_2](end_span). Price is currently testing local supply near the $342.06 daily high, supported by higher lows on the lower-timeframe structure[span_3](start_span)[span_3](end_span). 📈 The 4H market structure has shifted back to a short-term bullish trend, with moving averages aligned in favor of the buyers[span_4](start_span)[span_4](end_span). Key Technical Highlights: • Current Price: $342.03 (+0.21%)[span_5](start_span)[span_5](end_span) • Moving Averages: Price trades cleanly above MA7 ($341.40), MA14 ($340.92), and baseline MA28 ($339.78), establishing a solid dynamic support cluster[span_6](start_span)[span_6](end_span). • Indicator Momentum: MACD reflects a bullish crossover with positive expansion (DIF 0.89 vs DEA 0.78, Histogram +0.11), confirming momentum is turning back in favor of upside continuation[span_7](start_span)[span_7](end_span). Two Scenarios To Watch: 🟢 Bull Case: A sustained 4H close above $342.10 $\rightarrow$ Triggers upside expansion toward $343.25, with a potential retest of the major $346.13 local peak[span_8](start_span)[span_8](end_span). 🔴 Bear Case: Rejection at current resistance leading to a drop below MA7 ($341.40) $\rightarrow$ Triggers a retest of primary moving average support at MA28 ($339.78)[span_9](start_span)[span_9](end_span). With technical indicators signaling a shift back to positive momentum, holding above $340.90 keeps the immediate bullish thesis fully intact[span_10](start_span)[span_10](end_span). 💬 What’s your play on AAPLX here? Are you riding this momentum toward $346 or waiting for a pullback to $340? $AAPLXUSDT #ByXIMPACT