ICaty
Crypto Trader 📈 | Market Researcher 🔍 Trading market structure, liquidity & narratives. No hype — just charts, data & real setups. 🎯
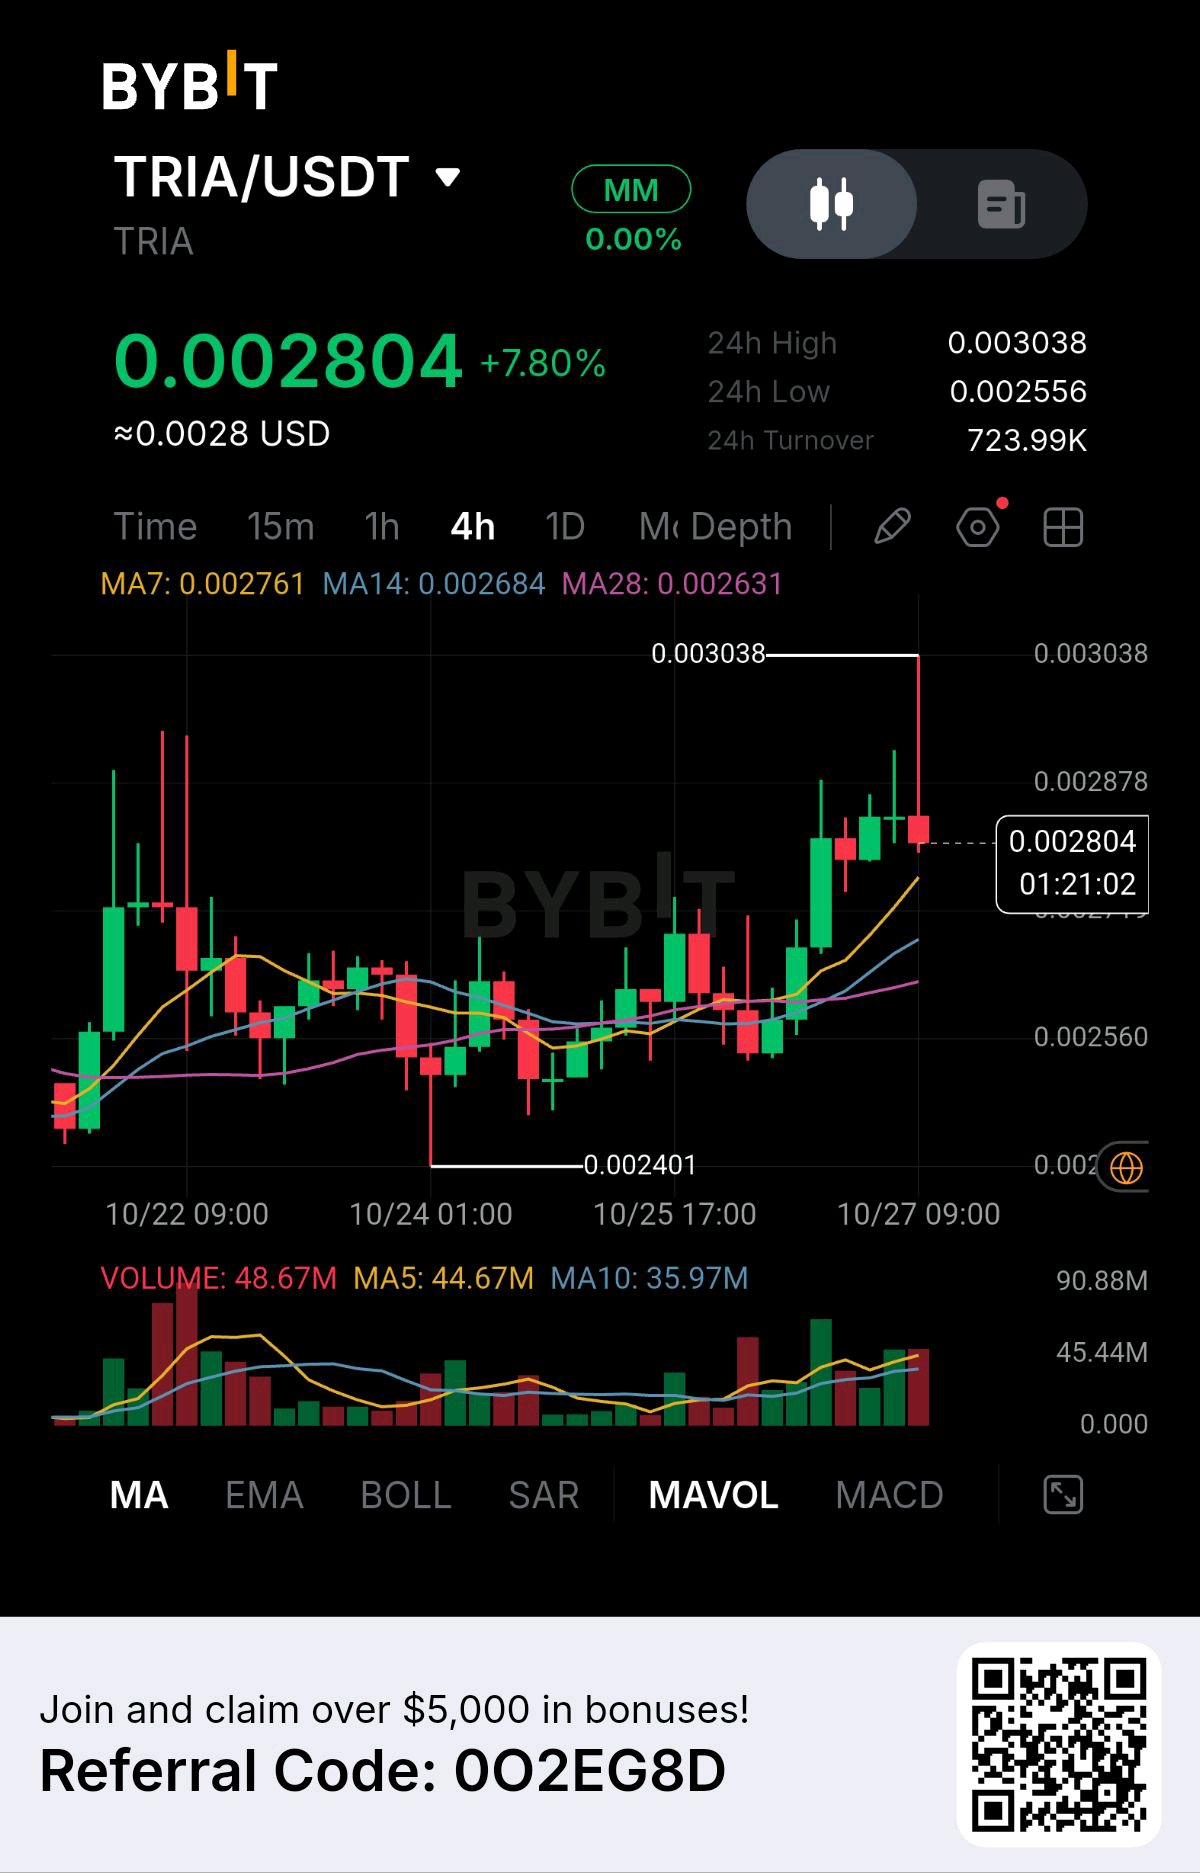
TRIA is showing a move that deserves attention for a reason beyond its 7.80% gain: buyers pushed price above the recent trading range, but the latest candle has already rejected the $0.003038 high. The next question is whether this is a healthy retest or the beginning of a failed breakout. At the time of the chart, TRIA is trading at $0.002804, up 7.80%, with a displayed 24-hour high of $0.003038, low of $0.002556, and turnover of approximately $723.99K. The 4H structure shows TRIA recovering from the $0.002401 low and spending time consolidating around $0.00256–$0.00265. Buyers then pushed through that range, lifting price above $0.00270 and toward $0.003038. That sequence matters because the market has moved from sideways trading into an attempted expansion. The moving averages support the recovery. MA7 is around $0.002761, MA14 at $0.002684, and MA28 at $0.002631. Price remains above all three, and the averages are stacked in a constructive order. This suggests the short-term trend has improved even though the latest candle is red. Volume provides additional evidence. The displayed volume is 48.67M, compared with MA5 at 44.67M and MA10 at 35.97M. Participation is elevated relative to those averages, which supports the idea that the breakout attracted meaningful activity. However, volume alone cannot tell me whether that activity represents sustained buying or profit-taking near resistance. My read is that TRIA's recovery remains intact, but $0.003038 is the level buyers must reclaim to confirm continuation. The rejection makes chasing the current candle less attractive. Bullish trigger: A 4H close above $0.003038, ideally followed by a successful retest. Entry: $0.00304–$0.00308 after confirmation. SL/invalidation: Around $0.00276, below the short-term MA7 area. TP1: $0.00320 TP2: $0.00340 TP3: $0.00360 These are conditional technical targets, not guaranteed outcomes. The bearish alternative is a loss of $0.002684, followed by a move below $0.002631. That would put price back beneath the MA14 and MA28 structure and weaken the breakout thesis. If selling accelerates, I would monitor the $0.002556 support area. Bearish invalidation: A sustained recovery above $0.003038. My thesis is that TRIA has improved its 4H structure, but the breakout is not fully confirmed while price remains below $0.003038. The elevated volume and bullish moving-average alignment support the recovery, while the rejection at the high warns that sellers are still active. A clean reclaim could open the next leg higher; losing the moving-average support zone would suggest the move needs a deeper reset. $TRIAUSDT #IMPACTbyTrade #ByXIMPACT
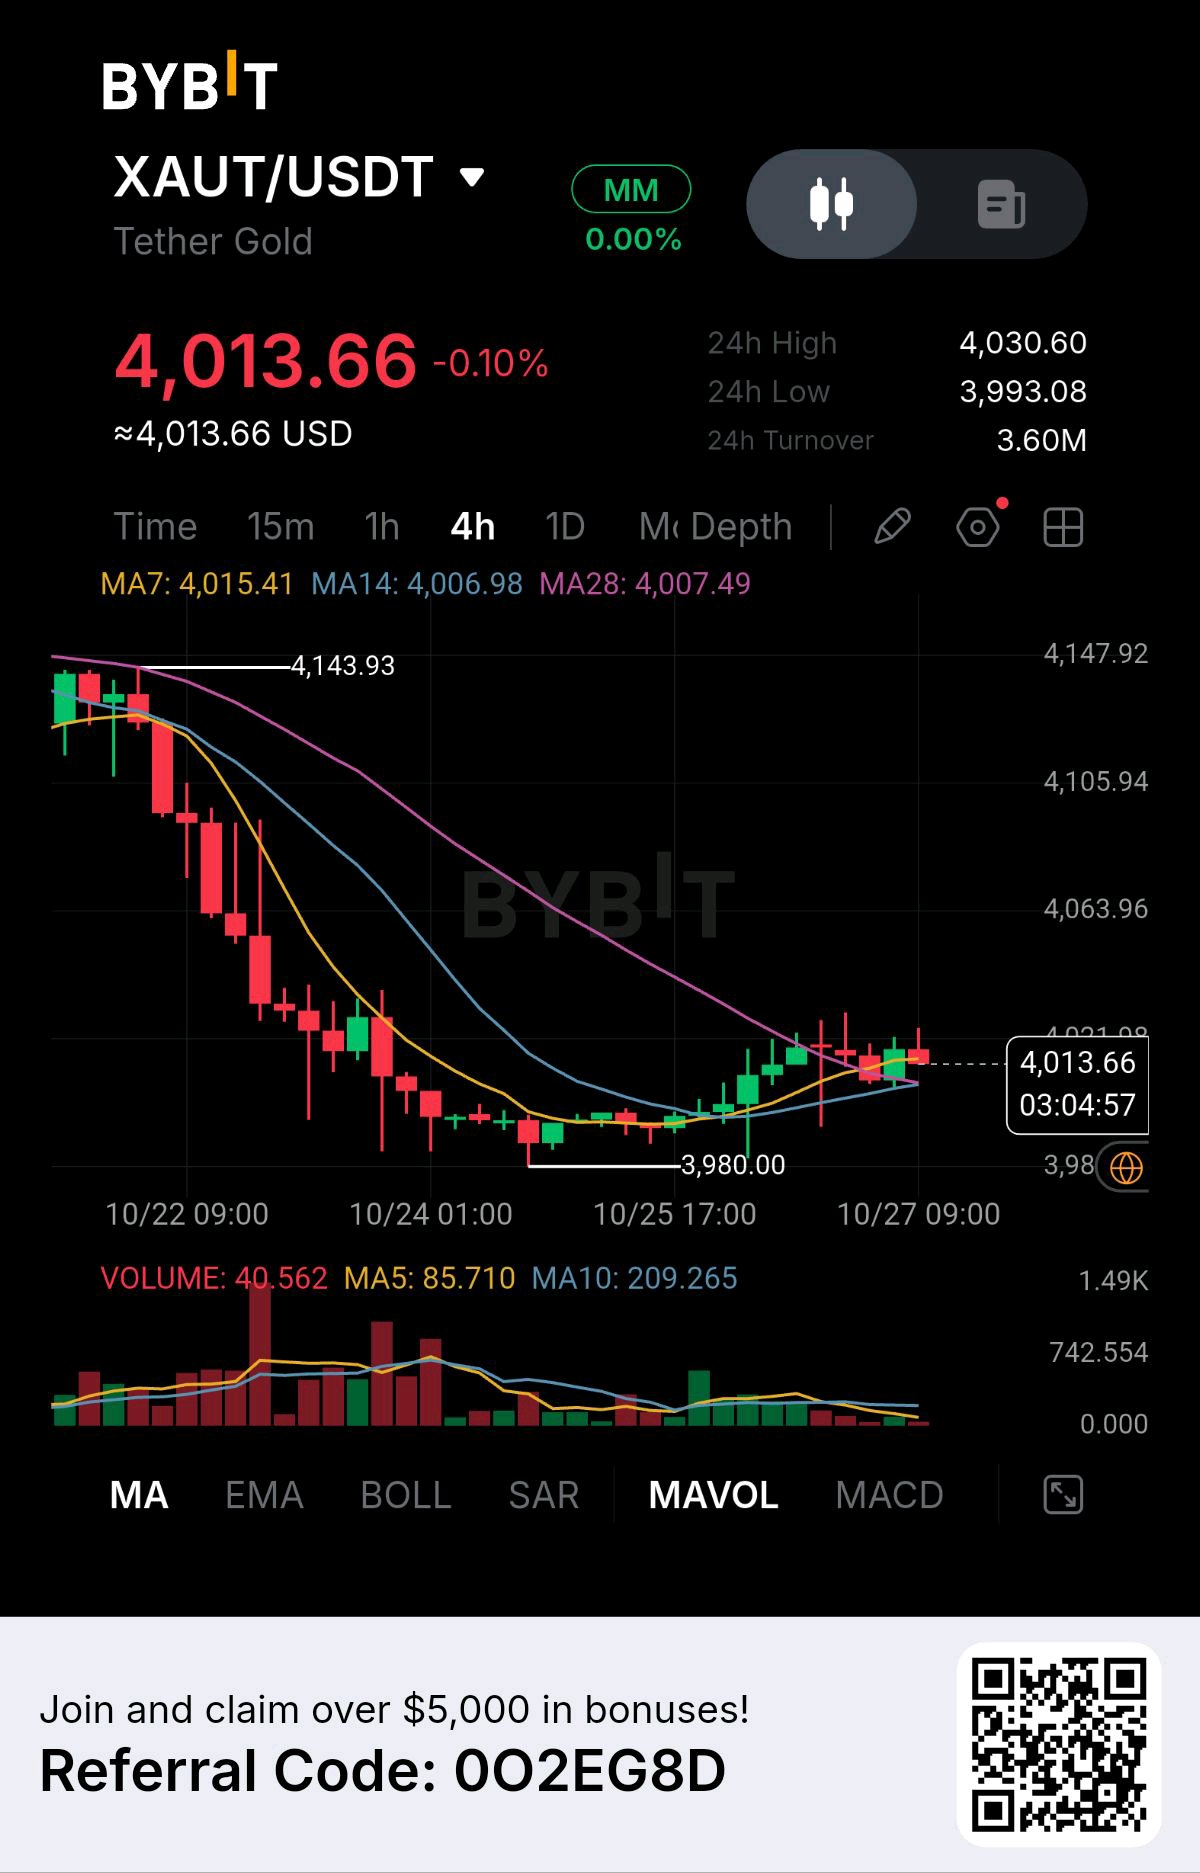
XAUT is showing a potential transition from aggressive selling to short-term stabilization, but the recovery is approaching a resistance zone that buyers have not convincingly reclaimed yet. What caught my attention is the sequence: a sharp decline from $4,143.93, a base near $3,980, and then a recovery toward $4,020 without a comparable surge in volume. That suggests selling pressure may be easing, but it does not yet confirm a sustained reversal. According to the uploaded Bybit 4H chart, XAUT is trading at $4,013.66, down 0.10%. The displayed 24-hour high is $4,030.60, the low is $3,993.08, and turnover is approximately $3.60 million. The moving averages are beginning to converge around the current price. MA7 is $4,015.41, MA14 is $4,006.98, and MA28 is $4,007.49. Price is sitting almost directly on this cluster after recovering from the recent low. That matters because the earlier downtrend had pushed price well below its moving averages. The current convergence suggests the immediate market structure is becoming less directional, although the longer-term decline visible on the chart has not been decisively reversed. Volume provides another clue. The displayed volume is approximately 40,562, compared with MA5 at 85,710 and MA10 at 209,265. The strongest selling activity occurred earlier in the decline, while recent candles show lower participation. The latest candle may still be incomplete, so I would not treat these figures as final. My interpretation is that XAUT is attempting to establish a base around $4,000. The key question is whether buyers can turn the $4,020–$4,032 region into support, or whether this recovery stalls beneath resistance. Bullish trigger: A confirmed 4H close above $4,032, followed by a successful retest. Entry: $4,033–$4,045 after confirmation. SL/invalidation: Around $4,005. TP1: $4,064 TP2: $4,106 TP3: $4,144 For the bearish scenario, a decisive 4H close below $3,993 would weaken the immediate recovery. A break of the visible $3,980 swing low would be a more significant signal that the previous downtrend is resuming. Bearish invalidation: A sustained recovery above $4,032–$4,045. I would not force a risk-to-reward estimate before a confirmed breakout or breakdown provides a more reliable entry structure. My thesis is that XAUT is moving from a strong sell-off into a possible stabilization phase, but the recovery remains unproven. The converging moving averages and declining recent volume suggest the market is losing some of its earlier directional momentum. A confirmed break above $4,032 would strengthen the recovery case, while losing $3,980 would indicate that buyers have failed to establish a durable base. $XAUTUSDT #ByXIMPACT

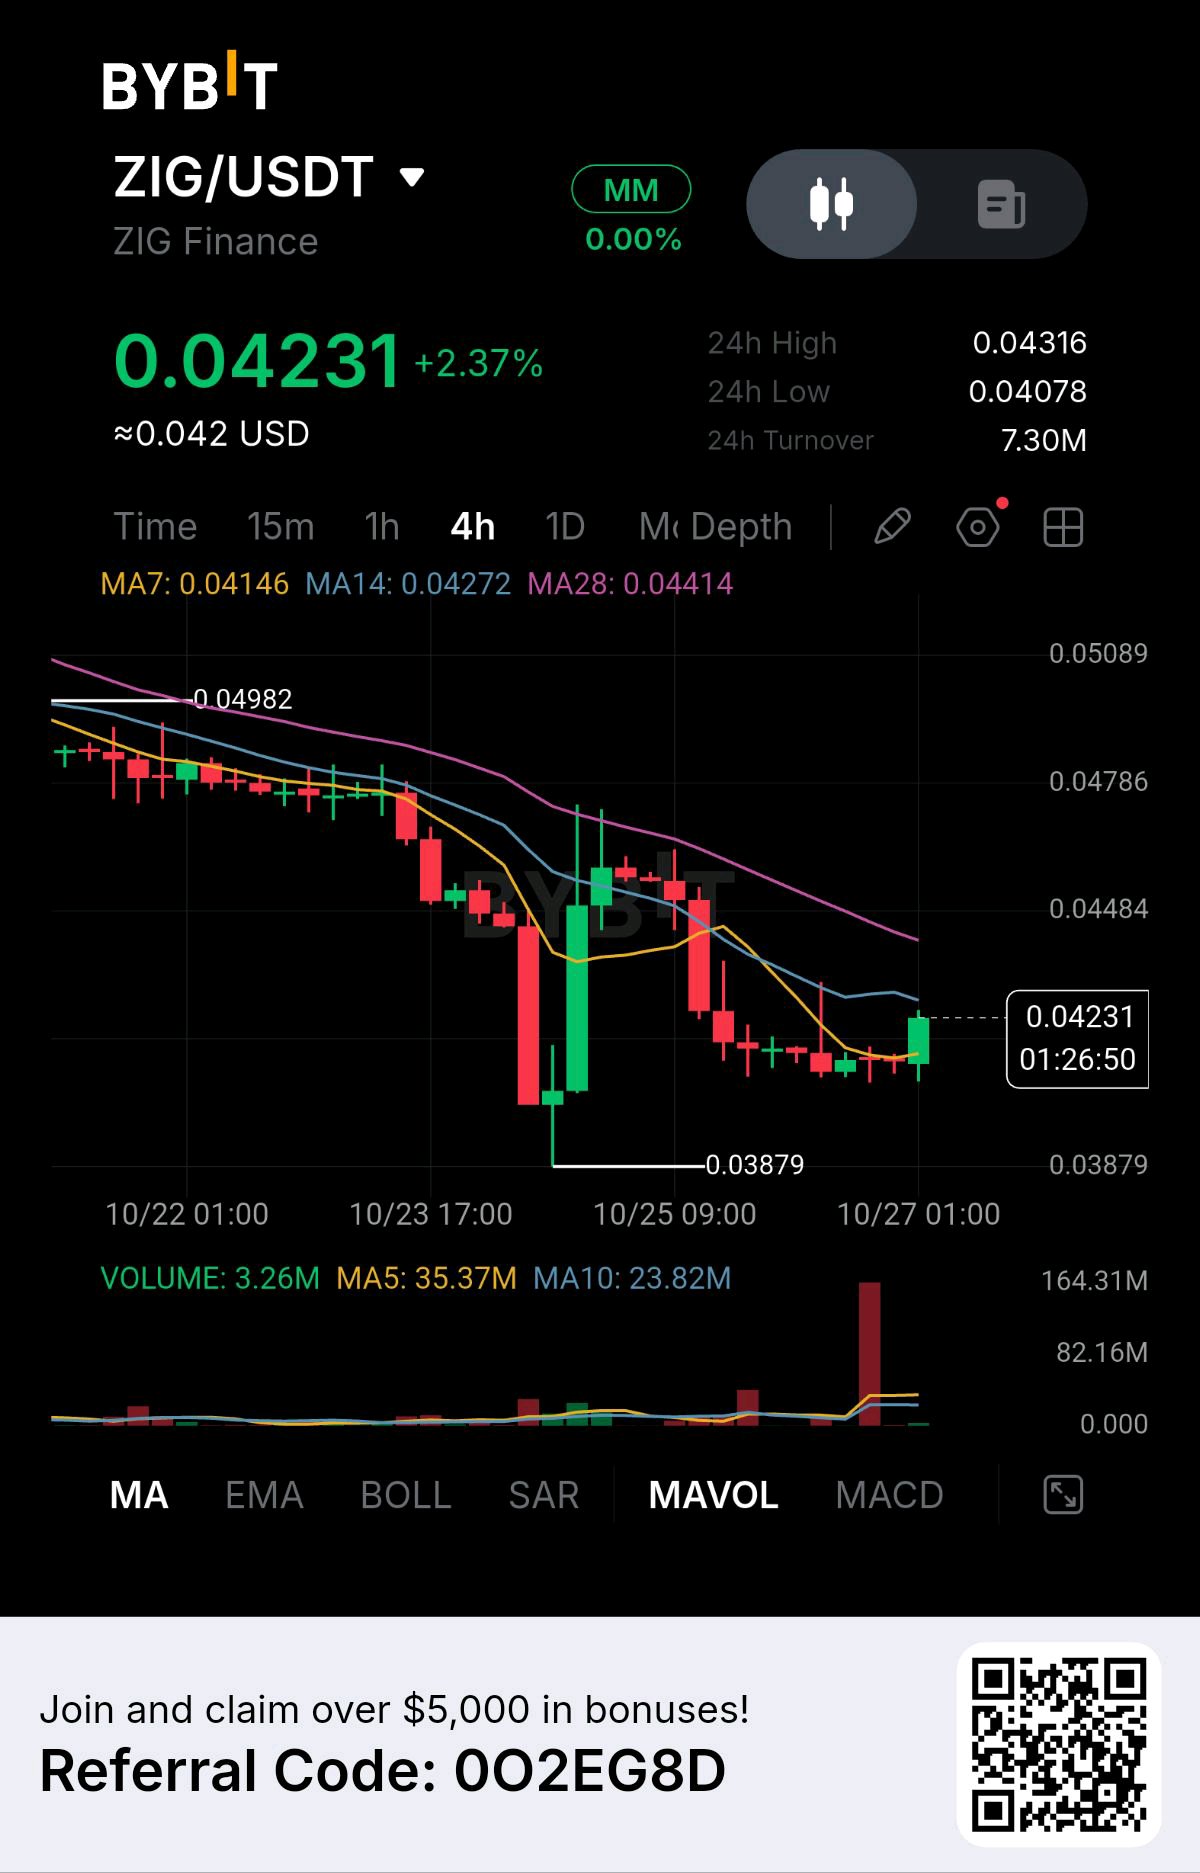
ZIG has bounced from $0.03879, but the recovery is running into a bigger problem: price is attempting to stabilize while the broader 4H trend remains bearish. I’m more interested in whether this bounce can reclaim resistance than in the current +2.37% gain. At the time of the chart, ZIG is trading at $0.04231, with a displayed 24-hour high of $0.04316, low of $0.04078, and turnover of approximately $7.30M. The chart shows a gradual decline from the $0.04982 region, followed by an aggressive sell-off toward $0.03879. Buyers responded with a sharp rebound, but that recovery failed to establish a sustained uptrend. Price subsequently drifted sideways around $0.041–$0.042 before the latest green candle. This is the key distinction: a bounce after a sharp sell-off can indicate demand, but it does not automatically mean sellers have lost control. The moving averages reinforce that caution. MA7 sits at $0.04146, MA14 at $0.04272, and MA28 at $0.04414. Price has recovered above MA7 but remains below MA14 and MA28. The longer average is still declining, consistent with the broader downtrend. Volume also needs careful interpretation. The displayed reading is 3.26M, compared with MA5 at 35.37M and MA10 at 23.82M. The chart contains one exceptionally large volume spike during the recent volatility. That could reflect concentrated trading activity, but this screenshot alone cannot establish whether it represented accumulation or distribution. The latest candle may also be incomplete. My read is that ZIG is attempting a short-term recovery, but the market still needs to reclaim the $0.0427–$0.0441 resistance zone before I would consider the reversal more convincing. Bullish trigger: A 4H close above $0.04316, followed by a successful retest. Entry: $0.0432–$0.0436 after confirmation. SL/invalidation: Around $0.0414. TP1: $0.04484 TP2: $0.0460 TP3: $0.04786 These are conditional chart levels, not predictions. A breakout without sustained volume would be less convincing. For the bearish scenario, I would watch the $0.04078 level first. A decisive 4H close below it would indicate that the current consolidation is failing. Bearish invalidation: A sustained recovery above $0.04316–$0.04414. If the downside break develops, the visible $0.03879 swing low becomes the next major reference. My thesis is that ZIG is at a recovery-versus-continuation decision point. The rebound from $0.03879 has improved the immediate price action, but the moving-average structure still favors caution. A sustained move above $0.04316, followed by a reclaim of $0.04414, would strengthen the recovery case. Until then, I would treat this as a potential relief bounce inside a broader decline rather than a confirmed trend reversal. $ZIGUSDT #IMPACTbyTrade #ByXIMPACT
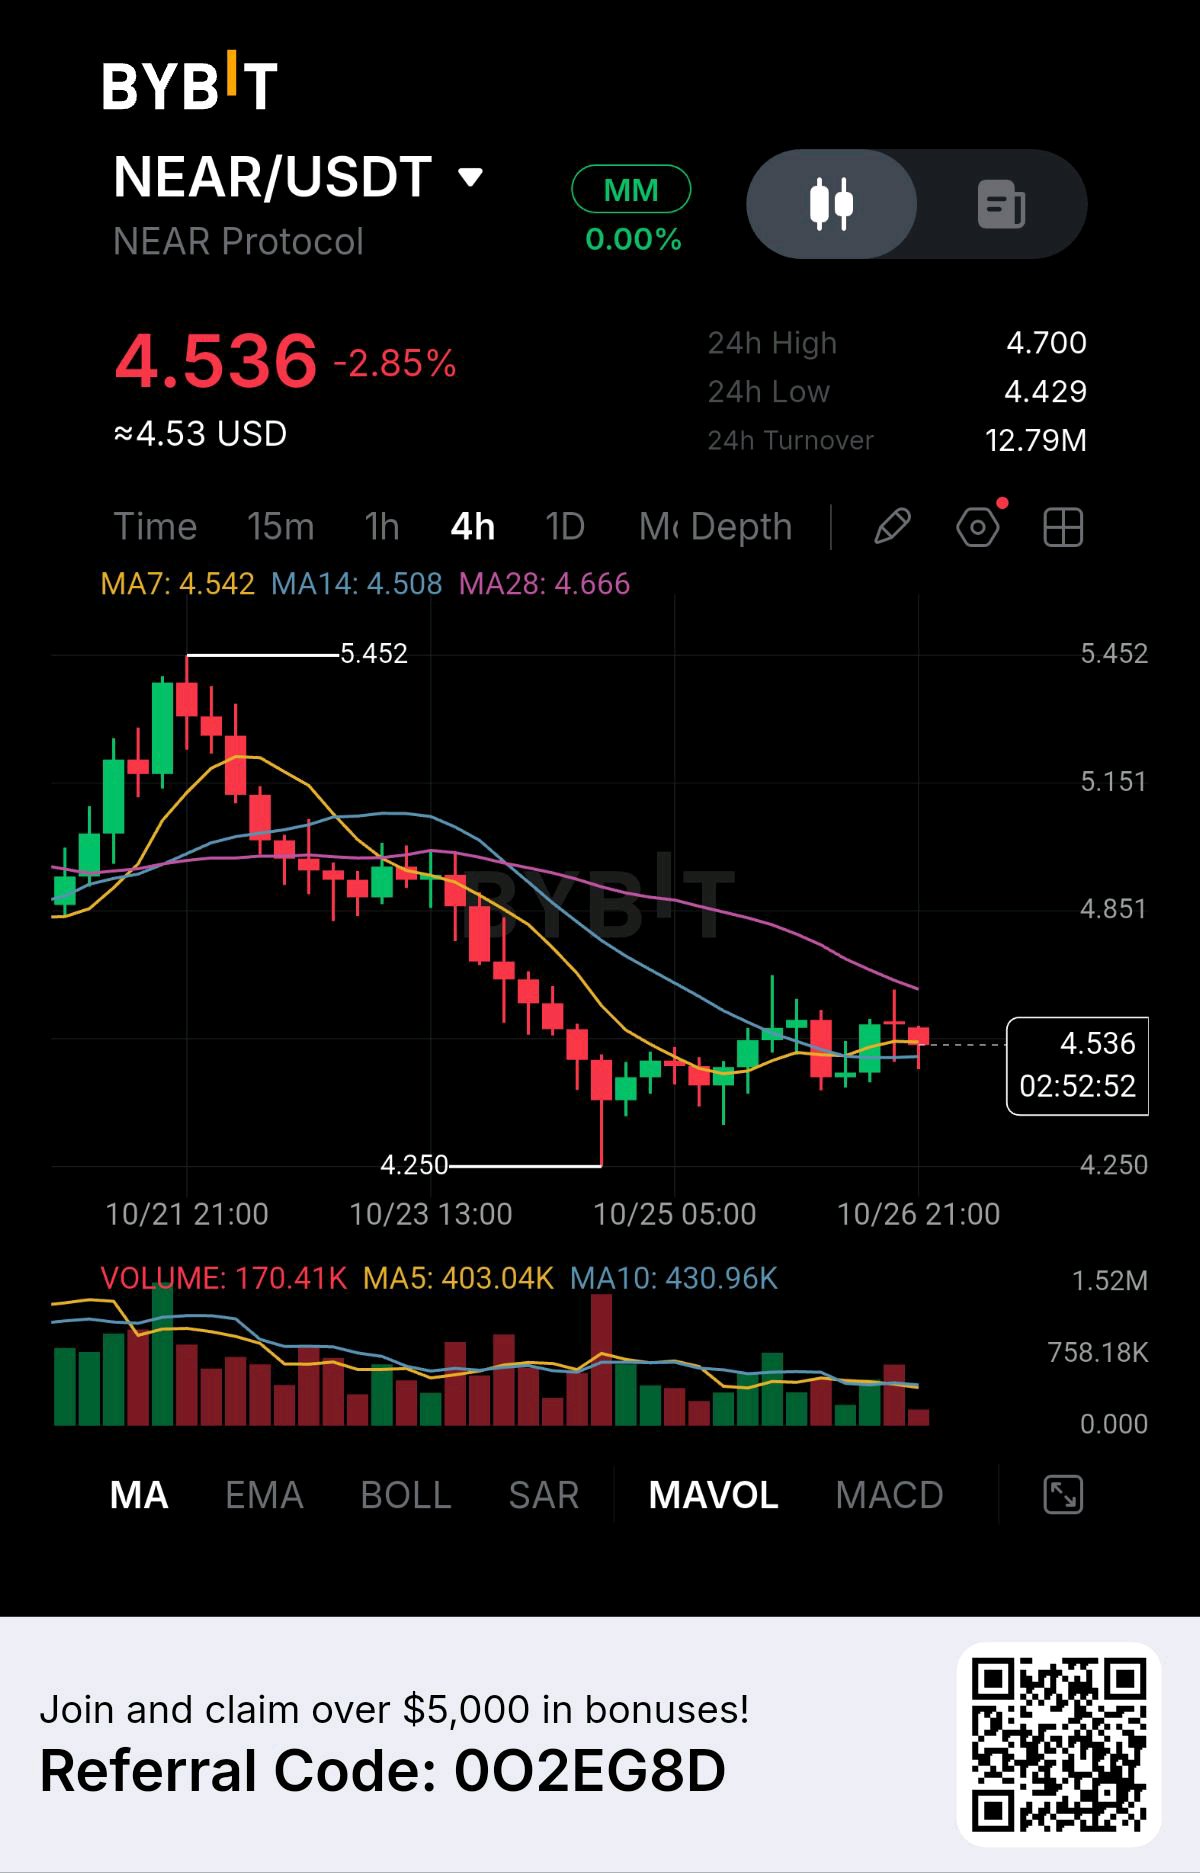
NEAR is showing a problem that often appears after a strong rally: the first recovery attempt is struggling to turn into a genuine trend reversal. Price has bounced from $4.25, but the latest candles are clustering around $4.53 while the longer-term moving average remains overhead. According to the uploaded Bybit 4H chart, NEAR is trading at $4.536, down 2.85%. The displayed 24-hour high is $4.700, the low is $4.429, and turnover is approximately $12.79 million. The interesting part is the change in market structure. NEAR previously reached $5.452 before entering a sustained decline, producing a sequence of lower highs and lower lows. The sell-off eventually reached $4.25, where buyers stepped in and triggered a rebound. However, that rebound has not yet reclaimed the previous structure. Price remains well below the earlier $4.85 area, and the recovery toward $4.70 has encountered resistance. The moving averages explain why I am cautious. MA7 is around $4.542, MA14 at $4.508, and MA28 at $4.666. Price is hovering around the short-term averages but remains below MA28. This suggests the immediate selling pressure has eased, but the broader 4H trend has not clearly turned bullish. Volume adds another clue. The latest displayed volume is approximately 170.41K, compared with MA5 at 403.04K and MA10 at 430.96K. Participation has cooled from earlier activity, which fits the current consolidation. The latest candle may still be incomplete, so I would not treat this volume reading as final. My interpretation is that NEAR is trying to establish a base after a sharp decline, but the market needs to reclaim resistance before I would consider the recovery confirmed. Bullish trigger: A 4H close above $4.70, followed by a successful retest. Entry: $4.71–$4.76 after confirmation. SL/invalidation: Around $4.50. TP1: $4.85 TP2: $5.15 TP3: $5.45 The bearish alternative is a decisive 4H close below $4.429, the displayed 24-hour low. That would weaken the current base and raise the possibility of another test of the $4.25 swing low. Bearish invalidation: A sustained recovery above $4.70–$4.85. I would avoid forcing a risk-to-reward estimate until a confirmed breakout or breakdown provides a clearer entry and invalidation point. My thesis is that NEAR is at a transition point between stabilization and continued weakness. The bounce from $4.25 shows that buyers are active, but the declining price structure and overhead MA28 still favor caution. A reclaim of $4.70 would be the first meaningful sign that buyers are regaining control; a break below $4.429 would suggest the recovery has failed. $NEARUSDT #IMPACTbyTrade #ByXIMPACT

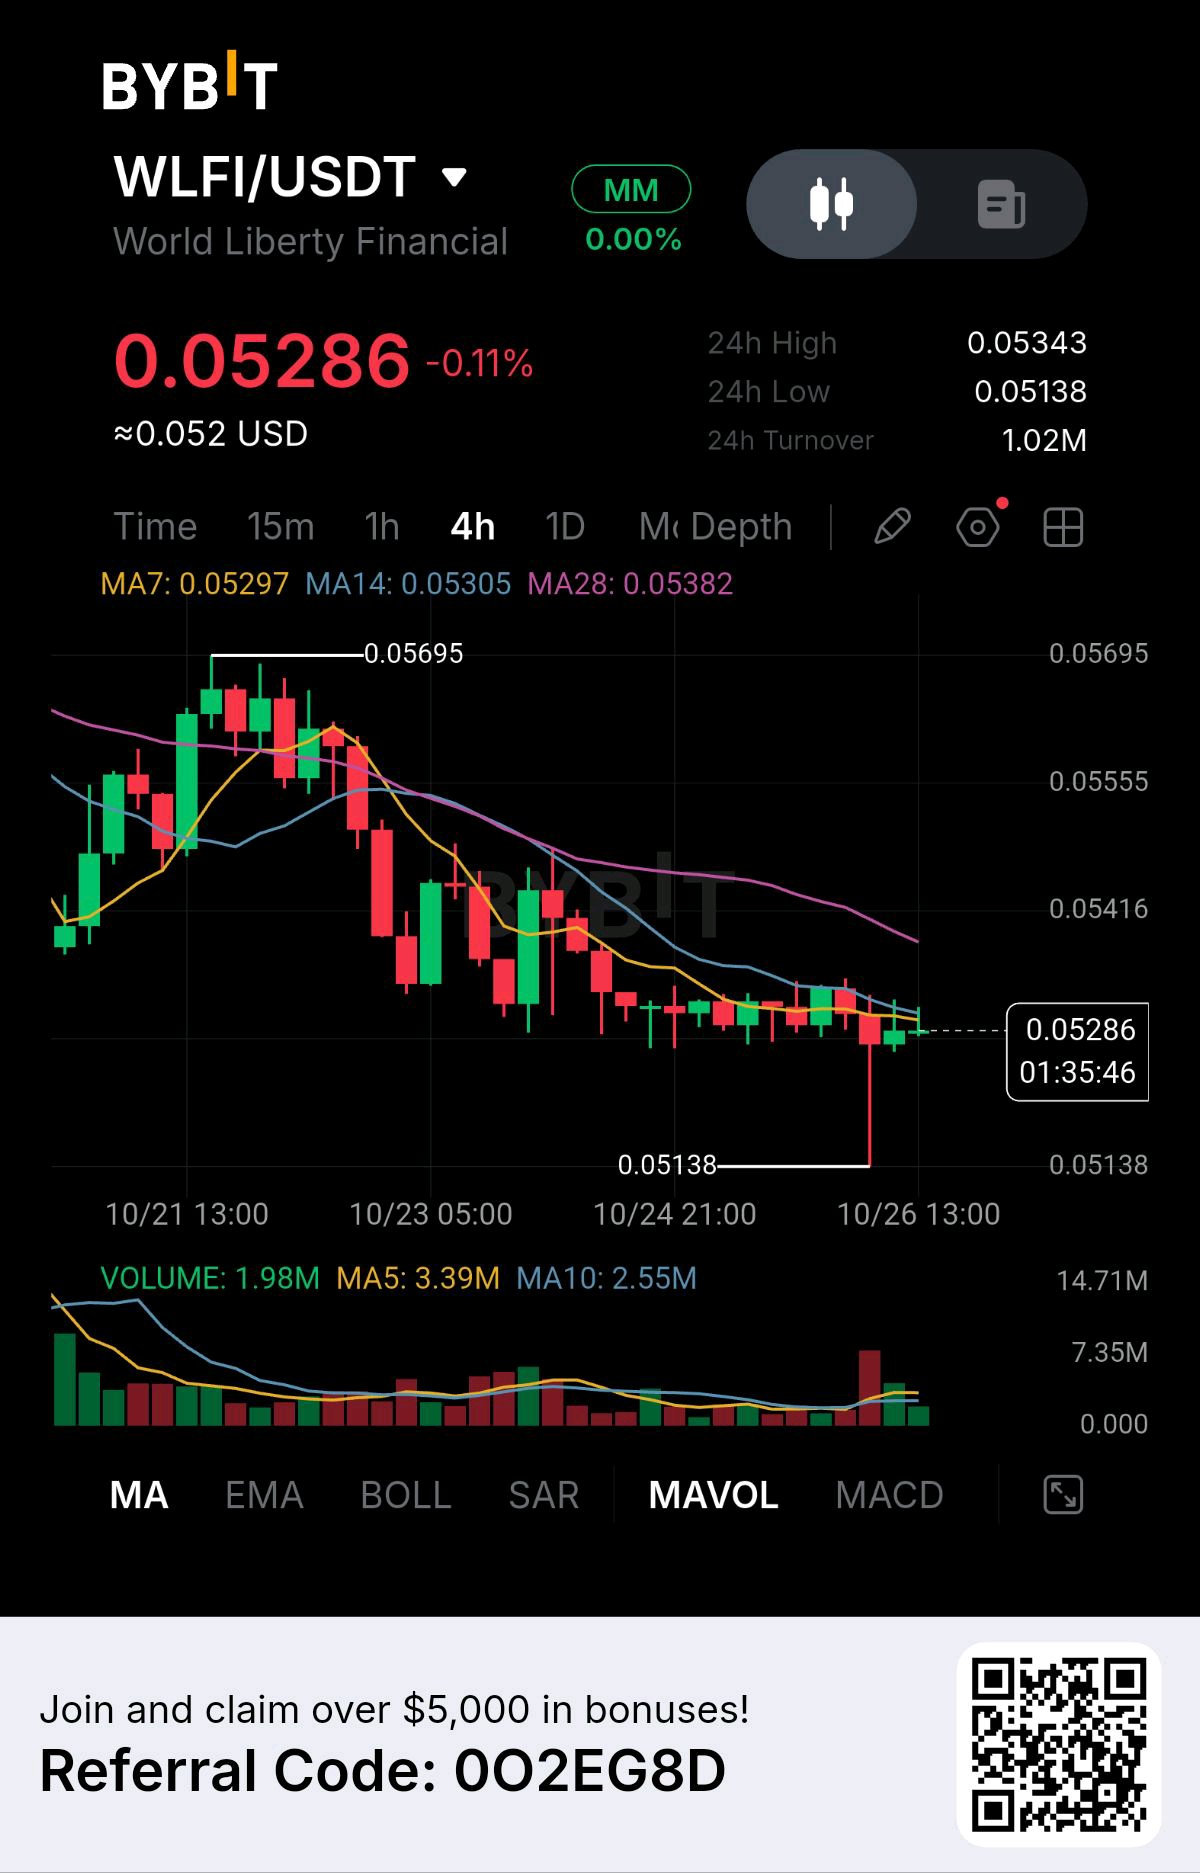
The most important signal on WLFI right now isn't the small daily loss — it's the failed recovery structure after the rejection from $0.05695. Buyers have managed to stabilize price near $0.0525, but they haven't yet reclaimed the moving averages that would indicate a stronger reversal. WLFI is trading around $0.05286, down 0.11% in the uploaded Bybit screenshot. The displayed 24-hour high is $0.05343, the low is $0.05138, and turnover is approximately $1.02 million. The 4H chart shows a clear sequence: WLFI peaked near $0.05695, formed lower highs, and sold off toward the $0.052 area. Since then, price has moved sideways in a narrow range. That pause could be a base for recovery, but it could also be consolidation before another leg down. The moving averages currently favor caution. MA7 is around $0.05297, MA14 at $0.05305, and MA28 at $0.05382. Price is below all three, with the longer average still sitting noticeably higher. This means buyers have not yet reclaimed the broader short-term trend structure. Volume is also subdued. The displayed reading is 1.98M, compared with MA5 at 3.39M and MA10 at 2.55M. The current candle may still be incomplete, but the chart suggests participation has faded compared with earlier selling activity. One detail matters: price briefly wicked down to $0.05138 and recovered. That shows buyers responded at the low, but a single wick does not confirm durable support. I would want to see whether subsequent candles continue holding above that level. My trading setup Bullish trigger: A 4H close above $0.05343, followed by a successful retest. Entry: $0.0535–$0.0538 after confirmation. SL/invalidation: Around $0.0520. TP1: $0.05416 TP2: $0.05555 TP3: $0.05695 For the bearish side, a decisive 4H close below $0.05138, ideally with expanding volume, would suggest the current base has failed. Bearish invalidation: A sustained recovery above $0.05343–$0.05382. My thesis is that WLFI is attempting to stabilize after a clear 4H decline, but stabilization alone is not a trend reversal. The $0.05138 low is the key downside boundary, while $0.05343–$0.05382 is the resistance zone buyers need to reclaim. Until one side breaks with confirmation, I see a range-bound market with a slight bearish structural bias rather than a high-conviction directional trade. $WLFIUSDT #IMPACTbyTrade #ByXIMPACT
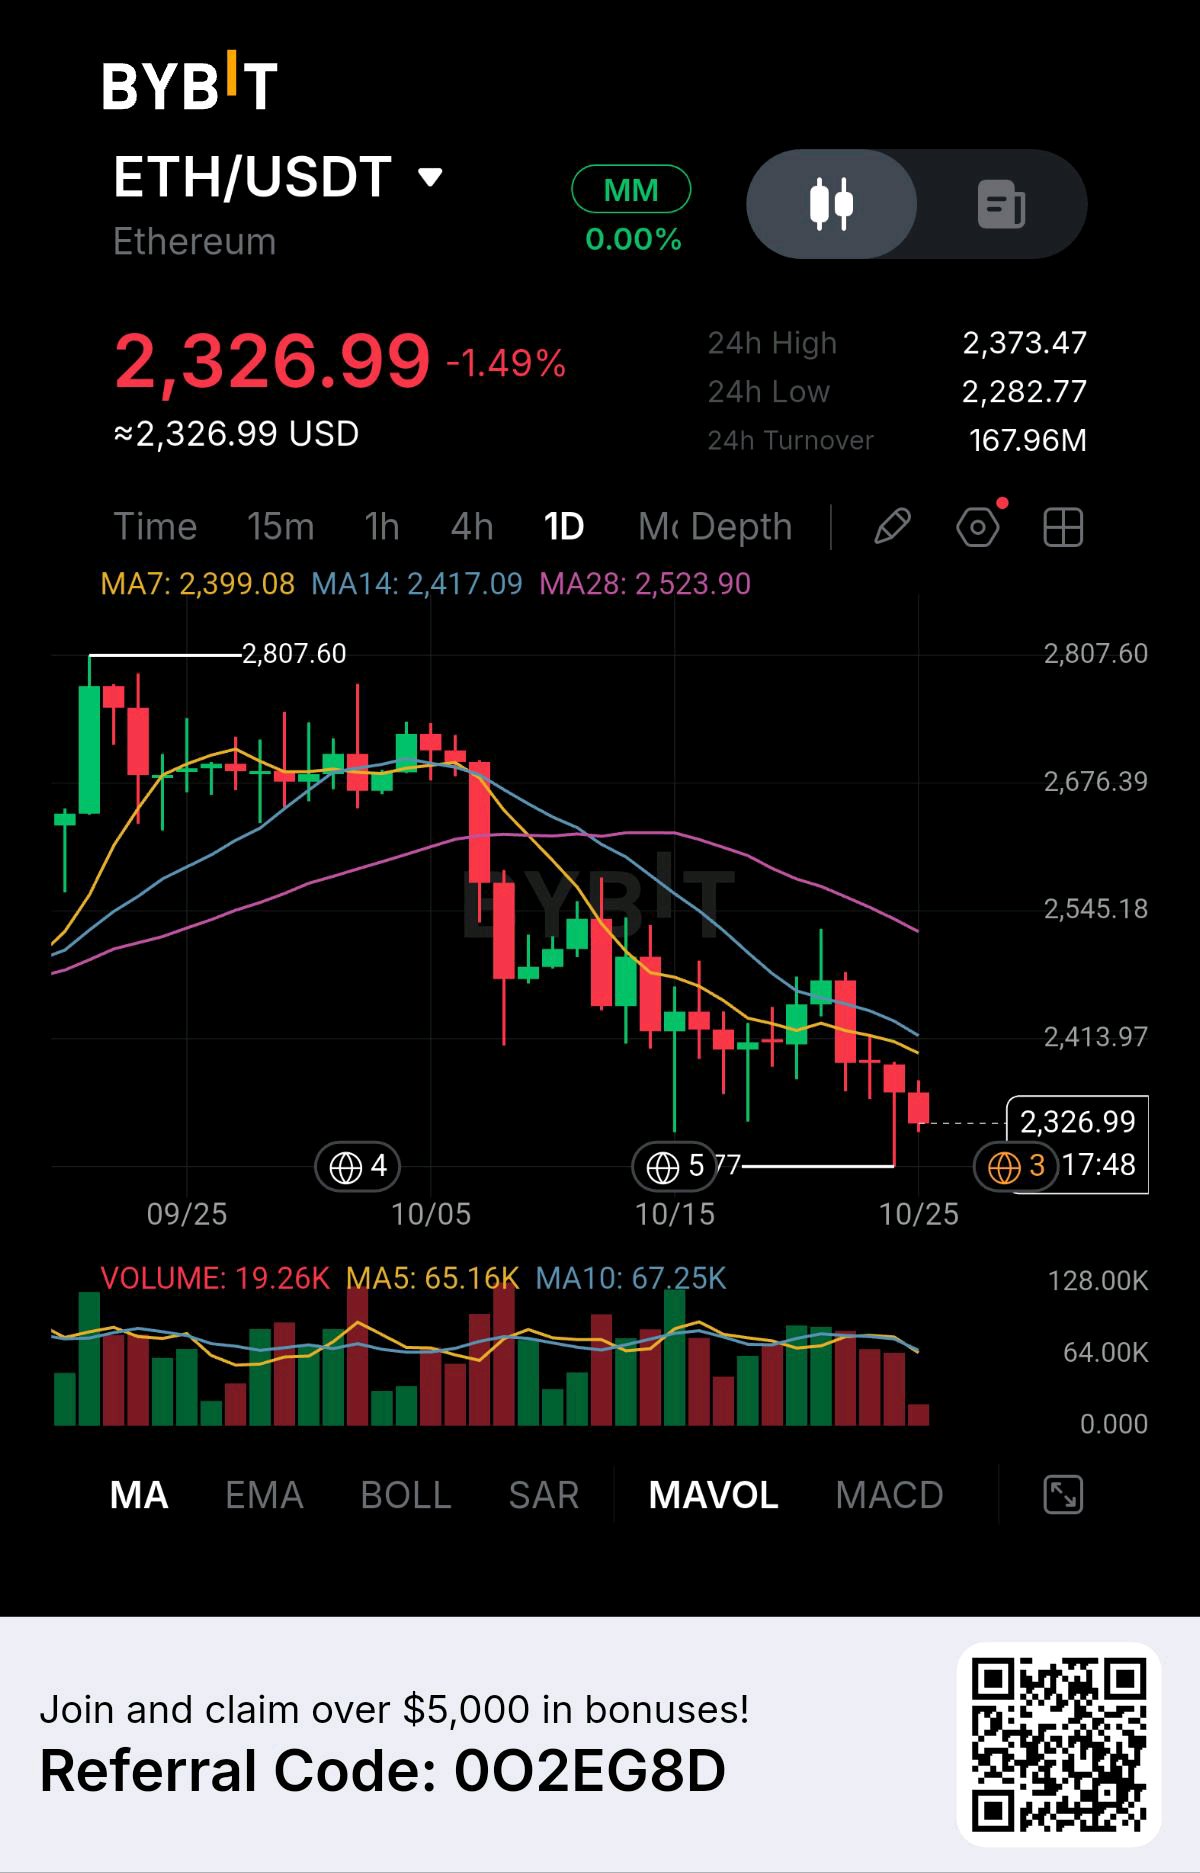
Ethereum is approaching a level where the next daily candle could matter more than the recent rebounds. What stands out to me is that ETH keeps making lower highs while price remains below all three major moving averages. Buyers have attempted recoveries, but none has yet changed the broader daily structure. According to the uploaded Bybit chart, ETH is trading at $2,326.99, down 1.49%. The displayed 24-hour high is $2,373.47, the low is $2,282.77, and turnover is approximately $167.96 million. The daily chart shows a clear deterioration from the $2,800 region. After trading sideways around $2,670–$2,720, ETH broke lower and began forming successive lower highs and lower lows. Attempts to recover toward $2,500 and $2,450 failed to establish a sustained reversal. Now price is approaching the lower end of the visible range. The moving averages reinforce this weakness. MA7 is around $2,399, MA14 around $2,417, and MA28 around $2,524. ETH is trading below all three, with the short-term average also below the medium-term average. That alignment suggests sellers still have the structural advantage. But I wouldn't automatically open a short simply because the trend is bearish. Price is already near a visible support area around $2,283, and selling directly into support can produce poor entries if a relief bounce develops. Volume adds another detail. The latest displayed volume is approximately 19.26K, compared with MA5 at 65.16K and MA10 at 67.25K. The current candle may be incomplete, so this isn't a final volume comparison. Still, the screenshot doesn't show a fresh surge in selling participation on the latest candle. I would want confirmation before assuming that support will break. My trading setup Bullish trigger: A daily recovery above $2,417, followed by a successful hold above that level. Entry: $2,420–$2,445 after confirmation. SL/invalidation: Around $2,370. TP1: $2,475 TP2: $2,525 TP3: $2,600 This would be a counter-trend recovery trade, not confirmation that the broader downtrend has ended. Bearish trigger: A decisive daily close below $2,282, ideally accompanied by increasing volume. Invalidation: A recovery above $2,417 that holds rather than immediately reversing. If support breaks, I would look for the next reaction zone to develop instead of inventing a downside target unsupported by the visible chart. My thesis is that ETH is facing a test of support inside an established daily downtrend. The moving-average structure favors sellers, but the proximity to $2,283 makes chasing the downside unattractive without confirmation. A break below support would strengthen the continuation case; a reclaim of $2,417 would suggest that buyers are finally challenging the sequence of lower highs. $ETHUSDT #ByXIMPACT
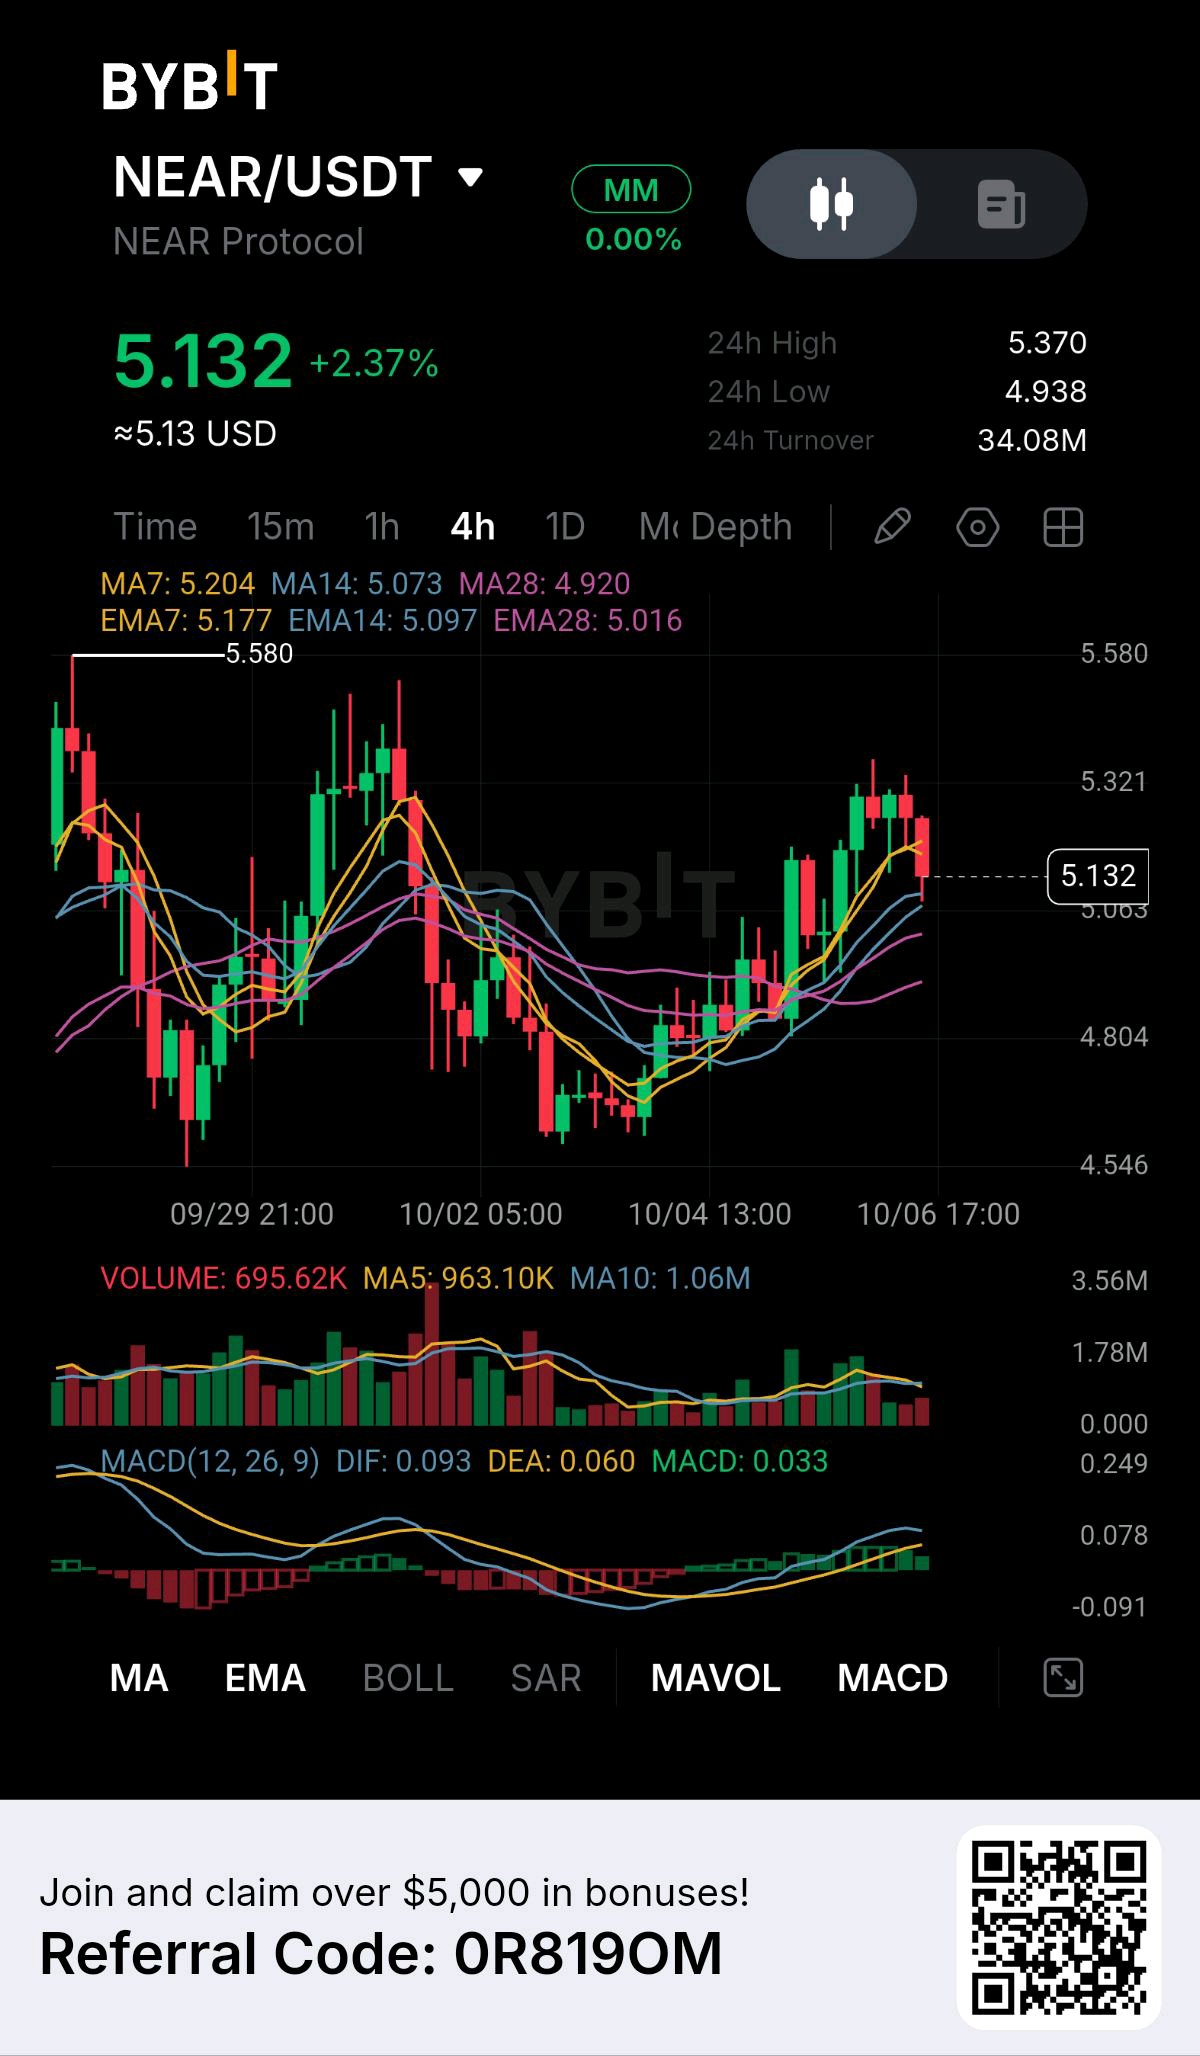
NEAR is showing a more interesting setup than the +2.37% headline suggests: the token has recovered strongly from the $4.55 area, but the latest candles are now struggling directly beneath $5.32, creating a clear test between continuation and rejection. NEAR/USDT is trading around $5.132, with a visible 24H high of $5.370, low of $4.938, and turnover of approximately $34.08M. The unusual part is how the structure has changed over the last few sessions. NEAR previously dropped toward the $4.55 region and spent time building a base. From there, buyers gradually pushed price higher, reclaiming the $4.80 area and then accelerating above $5.00. The latest move reached approximately $5.37, but price has since pulled back to $5.13. I’m watching that pullback closely because it is happening after a strong recovery rather than during the original decline. The moving-average structure is still constructive. MA7 is around $5.204, MA14 $5.073, and MA28 $4.920. EMA7 is approximately $5.177, EMA14 $5.097, and EMA28 $5.016. Current price has slipped below the MA7 and EMA7, but it remains above MA14, EMA14, MA28 and EMA28. That gives me a very clear short-term decision zone around $5.00–$5.10. If buyers defend that area, the recent breakout structure remains intact. If price loses it, the recovery starts looking much less convincing. Volume is also telling an interesting story. Current displayed volume is approximately 695.62K, compared with MA5 around 963.10K and MA10 around 1.06M. The recent rally attracted stronger participation, but the latest pullback is occurring with lower volume. I don't automatically interpret that as bearish. A pullback on declining volume can simply mean sellers are not showing the same aggression as buyers did during the recovery. But I still want confirmation before assuming the trend will continue. MACD remains positive. DIF is approximately 0.093, DEA 0.060, and MACD around 0.033. The histogram is still green, although momentum appears to be cooling from the strongest part of the recent move. My read is cautiously bullish, but I don't want to chase NEAR underneath $5.32. Bullish trigger: 4H close above $5.37 with renewed volume. Entry: Approximately $5.38–$5.45 after confirmation or a successful retest. SL/invalidation: Around $5.05. TP1: $5.58 TP2: $5.80 TP3: $6.00 The bullish setup becomes much stronger if $5.37 is broken and then successfully defended as support. For the bearish scenario, I would watch the $5.00–$5.05 area. Bearish trigger: 4H close below approximately $5.00, especially if selling volume expands. Bearish invalidation: Reclaiming and holding above $5.37. If $5.00 fails, the next visible structural area is around $4.80, followed by the deeper base near $4.55. I wouldn't force an R:R calculation yet because the current price sits between the short-term support cluster and the $5.37 resistance. The cleaner trade is likely to come after one of those levels breaks. My thesis: NEAR has already demonstrated that buyers can reverse the decline from $4.55, but the market is now asking whether that recovery can become a genuine continuation trend. The $5.00–$5.10 zone is the immediate structural test, while $5.37 is the breakout trigger. Holding the moving-average structure and breaking $5.37 with fresh volume would confirm that buyers are still expanding the trend; losing $5.00 would suggest the recent rally needs a deeper reset before another attempt higher. Educational analysis only — not financial advice. $NEARUSDT #ByXIMPACT
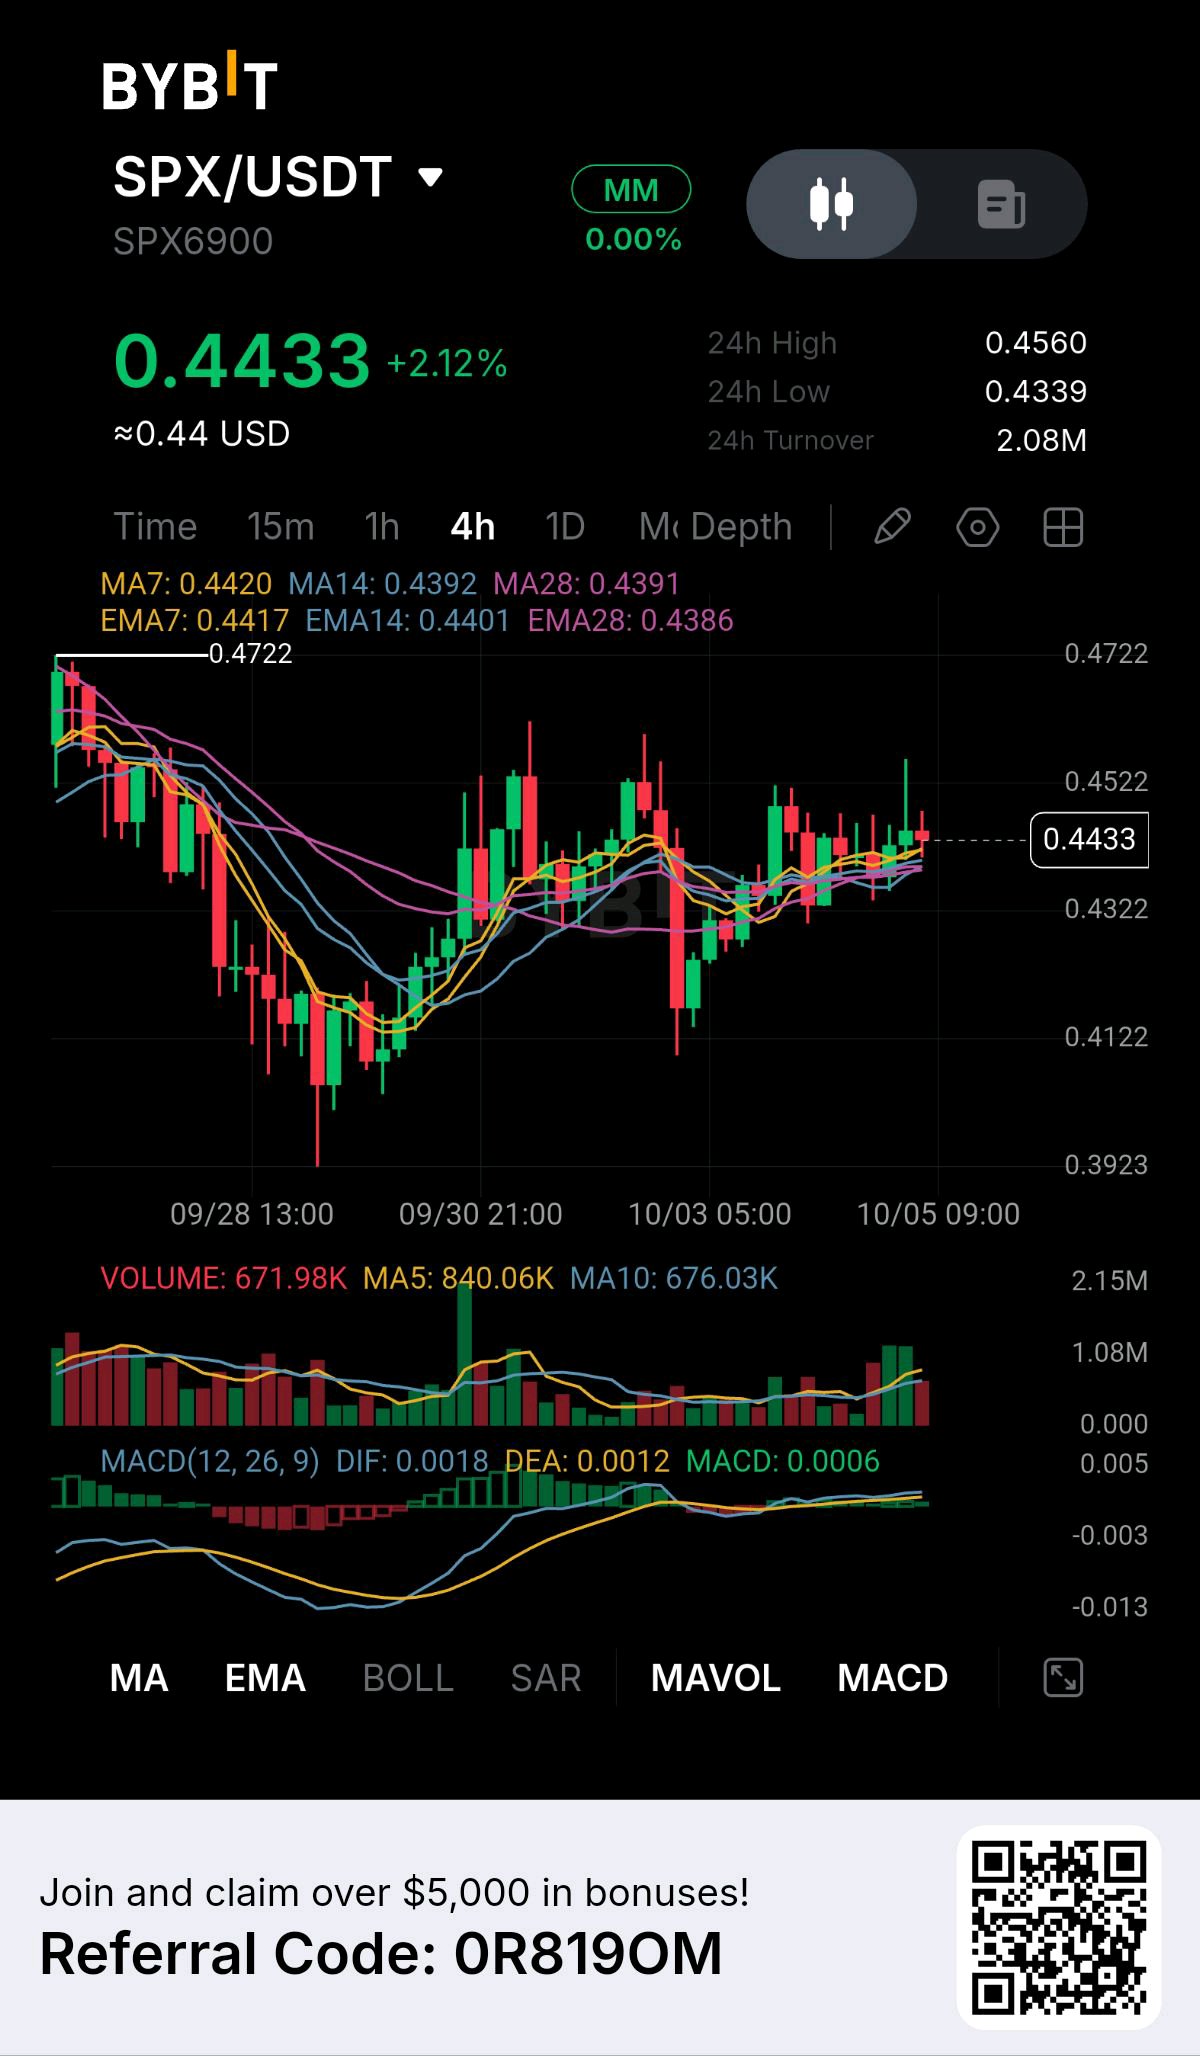
SPX is showing a subtle shift that I find more interesting than the current +2.12% gain: after a sharp decline from $0.4722, price has spent several sessions rebuilding above $0.43, and the moving averages are now compressing directly underneath the market. SPX/USDT is trading around $0.4433, with a visible 24H high of $0.4560, low of $0.4339, and turnover of approximately $2.08M. The unusual part is the structure after the sell-off. Price previously dropped from the $0.47 region toward approximately $0.3923, but instead of continuing lower, buyers started forming a base. Since then, SPX has repeatedly defended the $0.41–$0.43 region and gradually pushed back toward $0.45. That recovery is now creating a tighter range. The moving averages are almost perfectly compressed around current price. MA7 is approximately $0.4420, MA14 $0.4392, and MA28 $0.4391. EMA7 is $0.4417, EMA14 $0.4401, and EMA28 $0.4386. Current price at $0.4433 is above the entire cluster. For me, this is important because the previous downtrend has stopped producing clean lower lows. Instead, price is building above the moving-average group while repeatedly testing the $0.4522–$0.4560 resistance area. Volume gives a mixed but improving signal. Current displayed volume is around 671.98K, compared with MA5 at 840.06K and MA10 at 676.03K. Recent green candles have shown increasing participation, but the current volume is not an extreme expansion. So I see improving demand, not yet a confirmed breakout. MACD is slightly positive. DIF is around 0.0018, DEA 0.0012, and MACD approximately 0.0006. The histogram remains positive, while the MACD lines are positioned above their earlier lows. That supports the idea that momentum has stabilized. My read is constructive but range-bound. SPX needs to escape the $0.4522–$0.4560 ceiling before I would treat this as a genuine continuation move. Bullish trigger: 4H close above $0.4560 with expanding volume. Entry: Approximately $0.457–$0.462 after confirmation or a successful retest. SL/invalidation: Around $0.4380. TP1: $0.4722 TP2: $0.4900 TP3: $0.5100 The bearish setup activates if the current moving-average base fails. Bearish trigger: 4H close below approximately $0.4320, followed by continued weakness. Bearish invalidation: Reclaiming and holding above $0.4560. If $0.4320 fails, the previous support around $0.4122 becomes the next important visible level, while the deeper chart floor sits around $0.3923. I wouldn't force an R:R calculation because the trade is currently inside a relatively tight range and the cleaner setup comes from waiting for the range boundary to break. My thesis: SPX is quietly transitioning from a post-sell-off recovery into compression. The key evidence is the tight MA/EMA cluster around $0.439–$0.442, improving MACD, and repeated defense above $0.43. But buyers still need to remove the $0.4522–$0.4560 supply zone. A volume-backed break above $0.4560 would turn this compression into a continuation setup toward the prior $0.4722 high; losing $0.4320 would instead expose the recovery structure to another test of lower support. Educational analysis only — not financial advice. $SPXUSDT #ByXIMPACT
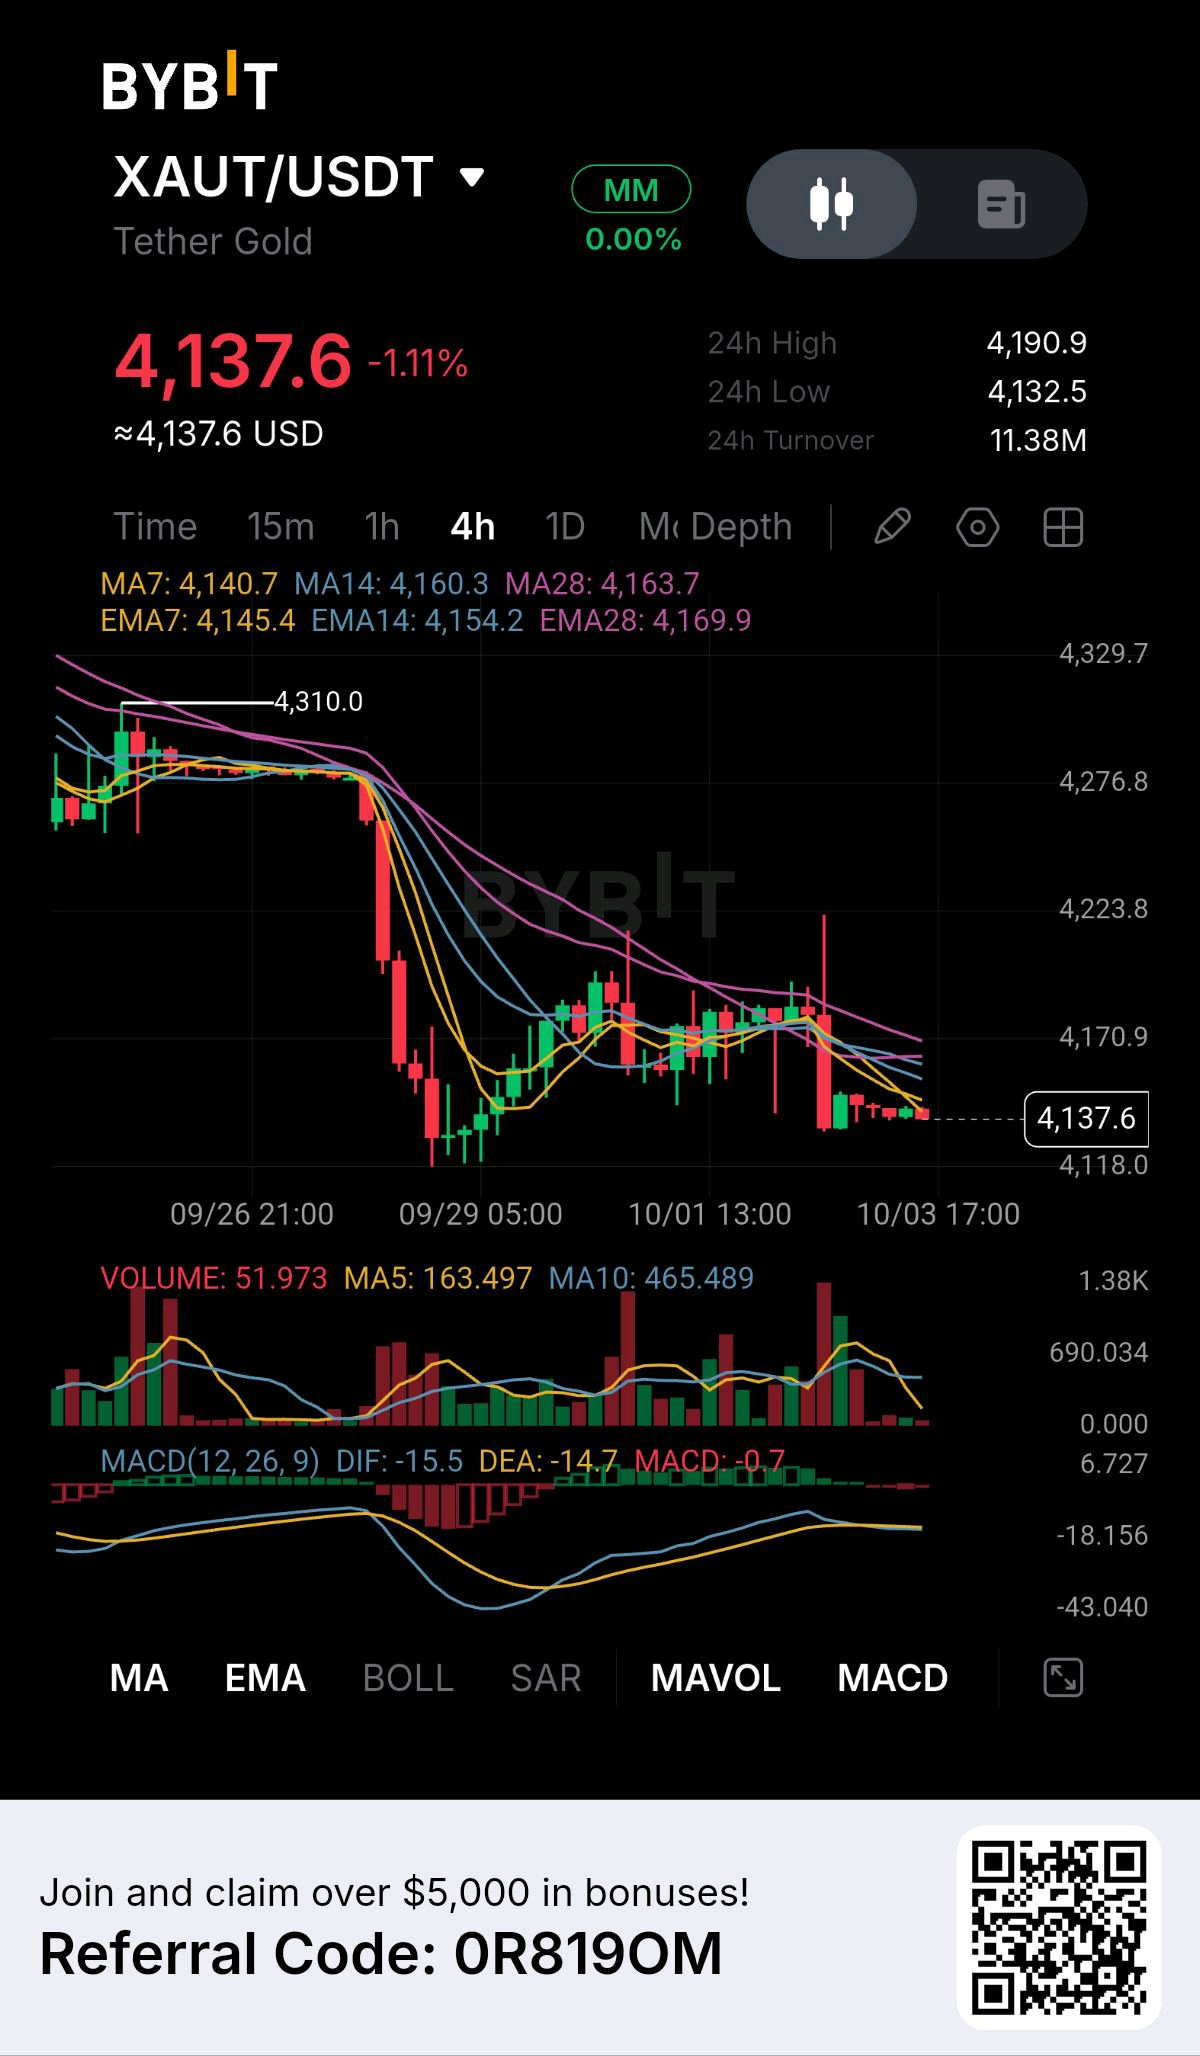
XAUT is showing a different kind of weakness than a sudden sell-off: the sharp decline already happened, but the attempted recovery has stalled directly underneath the moving-average cluster. That makes the current $4,118–$4,170 area important because the market is now deciding whether this is accumulation after the drop or simply a pause before another leg lower. From the screenshot, XAUT/USDT is trading around $4,137.6, down 1.11%, with a 24H high of $4,190.9, low of $4,132.5, and turnover of approximately $11.38M. The larger 4H structure is clearly visible. XAUT previously traded around $4,276–$4,310, then experienced a sharp decline toward the $4,118 area. Buyers attempted a recovery afterward, pushing price back toward $4,170–$4,200, but that recovery repeatedly failed to establish a higher high. The unusual part now is how compressed price has become near the lows. After the latest rejection, several candles are sitting tightly around $4,130–$4,145. That means volatility has contracted after the previous expansion. I don't want to assume this automatically means accumulation; it can also happen when sellers pause before another move. The moving averages currently lean bearish. MA7 is around $4,140.7, MA14 $4,160.3, and MA28 $4,163.7. The EMA readings are $4,145.4, $4,154.2, and $4,169.9. XAUT is therefore trading below most of the short- and medium-term averages, with the entire cluster sitting roughly between $4,140 and $4,170. That creates a clear resistance band. Volume also doesn't show a strong reversal confirmation. Current displayed volume is approximately 51.973, compared with MA5 around 163.497 and MA10 around 465.489. The recent selling candles produced larger volume, while the current candles are much quieter. MACD is also still slightly negative. DIF is around -15.5, DEA -14.7, and MACD approximately -0.7. The histogram has contracted significantly compared with the earlier negative expansion, which tells me downside momentum has weakened, but the indicator has not yet produced a strong bullish confirmation. My read is therefore neutral-to-bearish until XAUT reclaims the moving-average cluster. I would rather wait for price to prove that $4,170 can become support instead of trying to predict a bottom around $4,137. Bullish trigger: 4H close above approximately $4,170, preferably with increasing volume. Entry: Approximately $4,170–$4,185 after confirmation/retest. SL/invalidation: Around $4,130. TP1: $4,190 TP2: $4,223 TP3: $4,276 The bearish setup is much cleaner if the current floor gives way. Bearish trigger: 4H close below $4,118 with expanding selling volume. Bearish invalidation: Reclaiming and holding above approximately $4,170. I wouldn't force an R:R calculation here because the market is compressed between nearby support and resistance, and the cleaner trade depends on which boundary breaks first. What I’m watching most closely is the relationship between $4,118 and $4,170. A move above $4,170 would reclaim the moving-average cluster and potentially turn the recent decline into a recovery structure. A decisive break below $4,118 would instead confirm that buyers have failed to defend the post-drop base. My thesis: XAUT is currently sitting at the boundary between stabilization and continuation of the downtrend. The decline from the $4,276–$4,310 region created the bearish structure, while the failed recovery beneath $4,170 shows that sellers still have the advantage on the visible chart. Until price reclaims that MA/EMA cluster with stronger volume, I see the current sideways action as unresolved rather than a confirmed reversal. $XAUTUSDT #ByXIMPACT
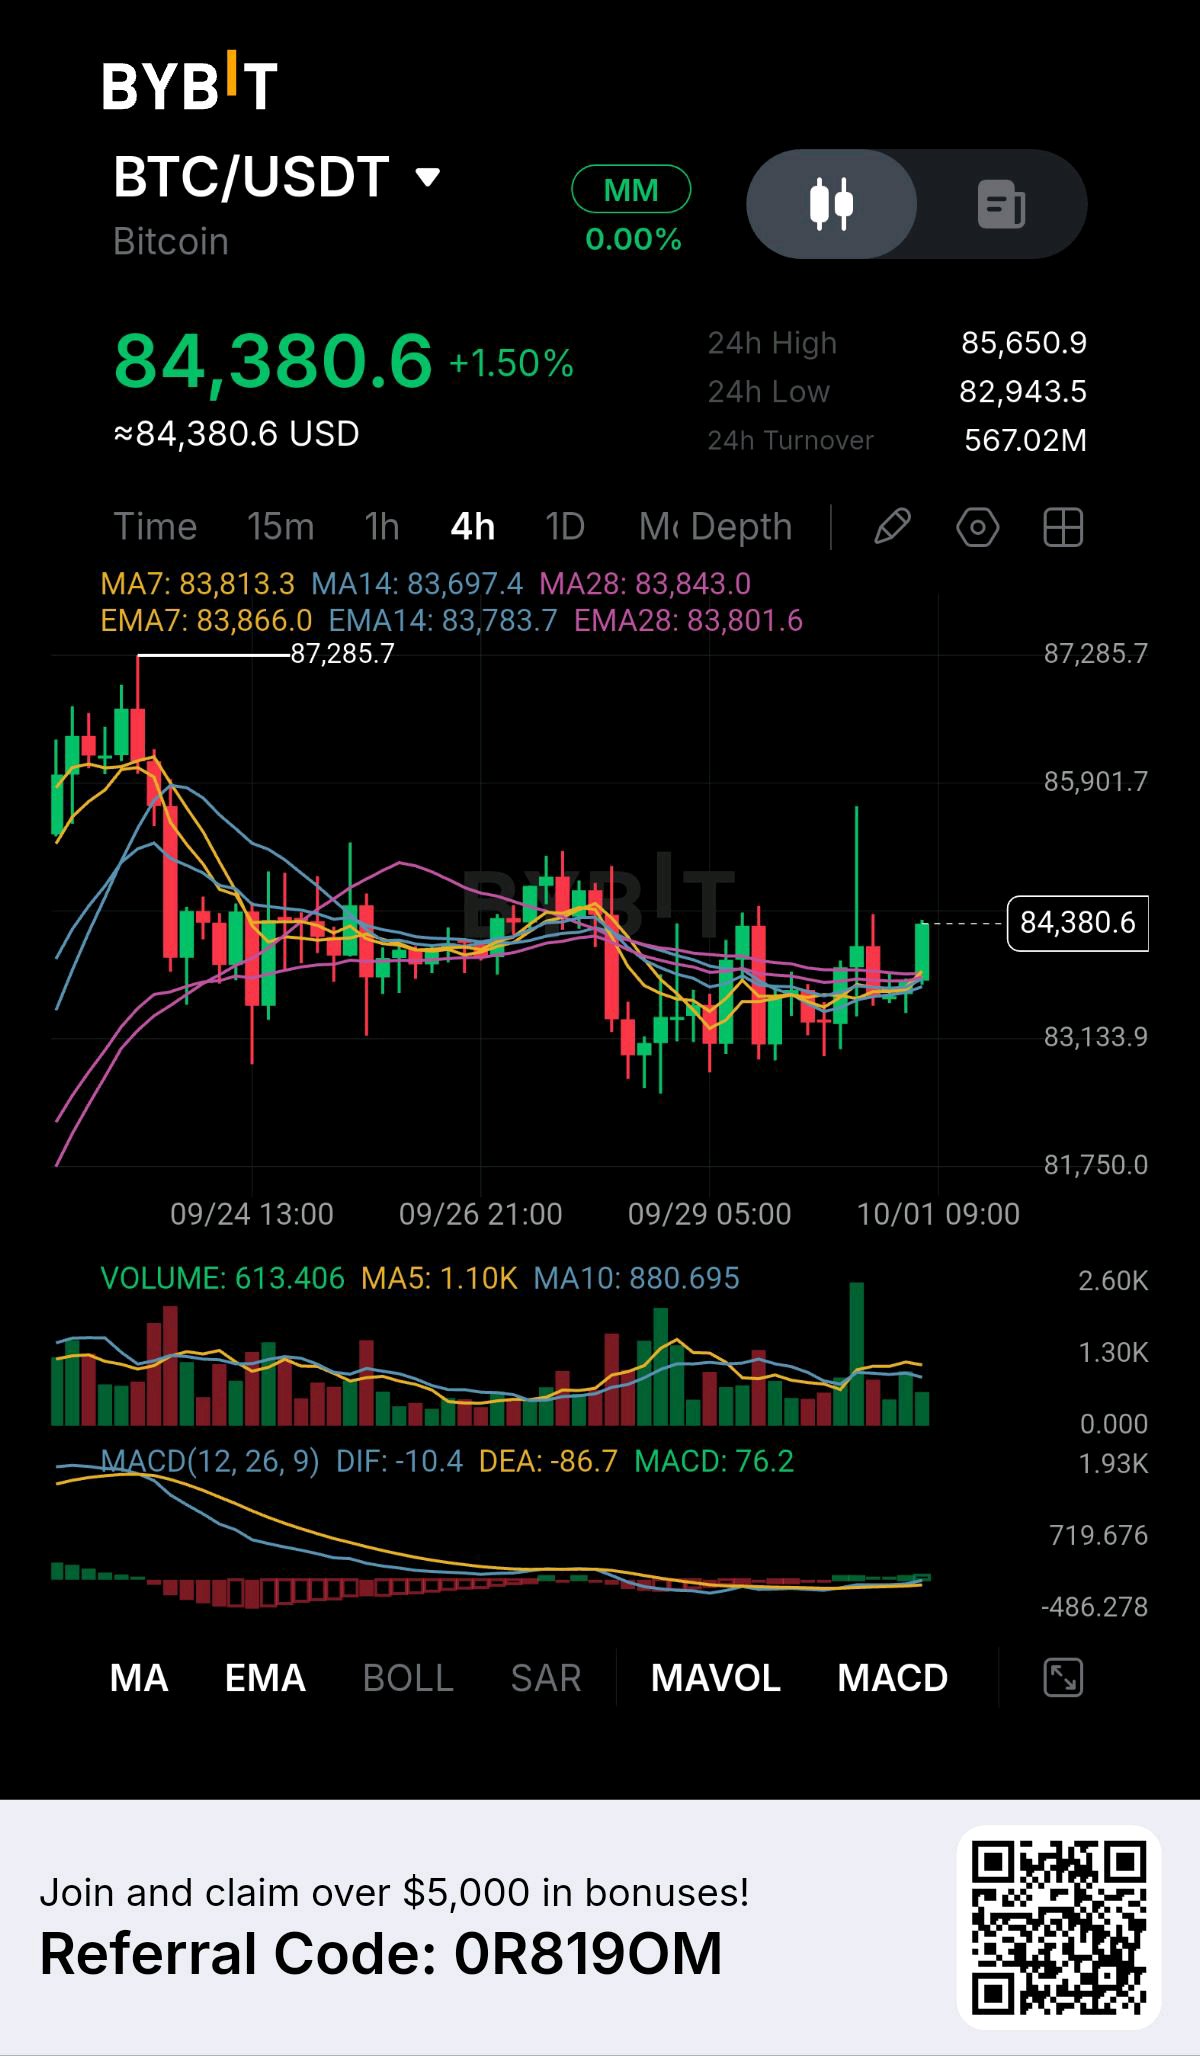
BTC is showing a setup I find more interesting than the headline +1.50% suggests: after falling sharply from the $87,285.7 area, price has spent several sessions compressing around $83K–$85K, and now it is attempting to reclaim the entire short-term moving-average cluster. From the screenshot, BTC/USDT is trading around $84,380.6, up 1.50%, with a visible 24H high of $85,650.9, low of $82,943.5, and 24H turnover of approximately $567.02M. The unusual part is the location of this move. BTC isn't breaking out from a long accumulation base yet. Instead, it is recovering inside a range that formed after the rejection from $87,285.7. Price repeatedly found buyers around the $83,000–$83,500 region, while attempts to push higher were repeatedly rejected. That makes the current move a test of whether the range is finally shifting upward. The moving averages are beginning to support that idea. MA7 is around $83,813.3, MA14 $83,697.4, and MA28 $83,843.0. The EMA readings are $83,866.0, $83,783.7, and $83,801.6. BTC is currently above all of them. That is important because the averages had been tightly compressed around the price during the sideways phase. A sustained move above this cluster would indicate that short-term momentum is beginning to separate from the previous consolidation. Volume, however, keeps me from calling this a confirmed breakout. The screenshot shows current volume around 613.406, compared with MA5 near 1.10K and MA10 around 880.695. There was a noticeably larger volume spike during the recent move, but the latest displayed volume is lower. So buyers have improved the structure, but they haven't yet shown overwhelming participation. MACD is more constructive. DIF is approximately -10.4, DEA -86.7, while the displayed MACD value is 76.2. The histogram has recovered from the earlier negative phase and is now positive, suggesting that downside momentum has weakened and short-term momentum is turning upward. My read is cautiously constructive, but BTC still needs to clear the upper part of the range. I wouldn't chase simply because the price is green. Bullish trigger: A 4H close above $85,650–$85,900 with increasing volume. Entry: Approximately $85,700–$86,000 after confirmation or a successful retest. SL/invalidation: Around $84,000. TP1: $86,500 TP2: $87,285 TP3: $88,500 The major chart resistance is the previous $87,285.7 high. A clean break above that level would represent a much more meaningful structural change than simply moving from $83K to $85K. The bearish scenario is equally clear. Bearish trigger: 4H close below approximately $83,100, especially if selling volume expands. Bearish invalidation: Reclaiming and holding above $85,650. If $83,100 fails, the recent consolidation would be weakening rather than resolving upward, and the next visible chart support is around $81,750. I wouldn't force an R:R calculation yet because the cleanest trade depends on whether BTC breaks the range high directly or first gives another retest. My thesis: BTC is transitioning from compression toward a possible upside expansion, but the real confirmation sits above $85,650 and ultimately $87,285. The current reclaim of the MA/EMA cluster and improving MACD show that sellers have lost some short-term control, while the relatively modest current volume says buyers still need to prove conviction. Until the range high breaks, I see this as a developing structure rather than a confirmed breakout. $BTCUSDT #ByXIMPACT
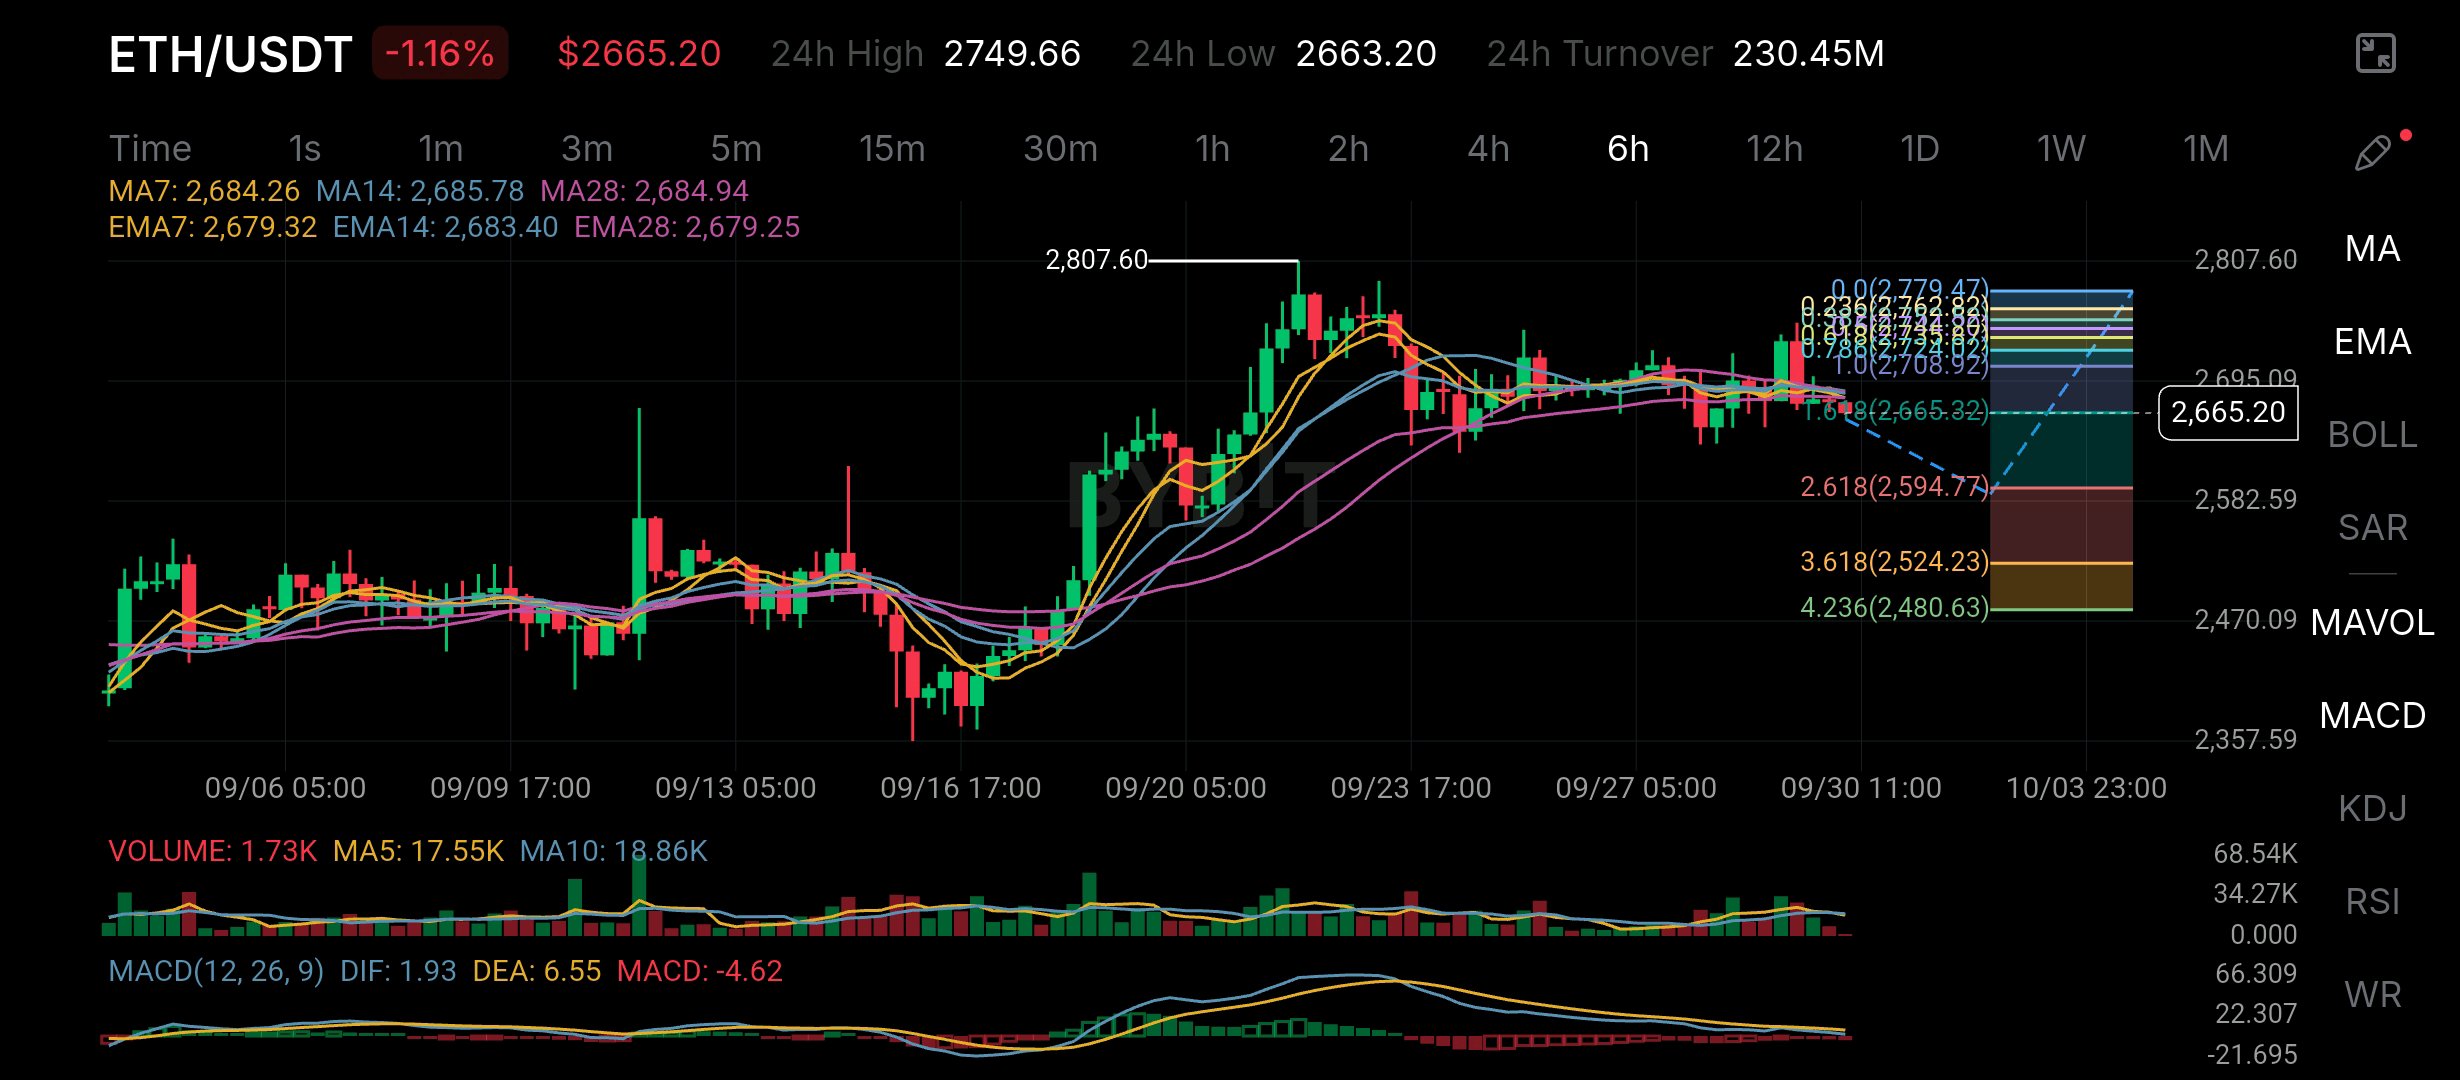
ETH is sitting in an uncomfortable spot right now: price has fallen back to the lower edge of a multi-day range, but the bigger 6H structure has not completely broken yet. The key question for me is whether $2,665 becomes a bounce zone or the starting point for a deeper retracement. On the chart, ETH is trading at $2,665.20, down 1.16%, with a visible 24H high of $2,749.66, low of $2,663.20, and 24H turnover of approximately $230.45M. The important story is the change from expansion to compression. ETH rallied strongly from the September 16 area and eventually reached approximately $2,807.60. Since that high, however, the market has stopped making meaningful upside progress. Instead, price has spent several sessions oscillating around the $2,680–$2,720 region. Now ETH is testing the bottom of that structure. The current price is also below the short-term moving averages shown on the chart. MA7 is approximately $2,684.26, MA14 $2,685.78, and MA28 $2,684.94. The EMA readings are $2,679.32, $2,683.40, and $2,679.25. That puts the current price below the entire short-term MA/EMA cluster. For me, that is the first warning sign. The Fibonacci levels drawn on the chart also show the market sitting around the 1.0 level near $2,665, with higher retracement levels above it and deeper extension levels around $2,594.77, $2,524.23, and $2,480.63. So $2,665 isn't just an arbitrary number on this chart. It is currently acting as the immediate structural boundary. Volume doesn't show an obvious panic expansion. The screenshot shows current volume around 1.73K, compared with MA5 around 17.55K and MA10 around 18.86K. That tells me the latest decline is occurring without the kind of extreme volume spike that would immediately confirm aggressive capitulation. MACD is less encouraging. DIF is around 1.93, DEA 6.55, and the MACD histogram is approximately -4.62. DIF remains below DEA and the histogram is negative, showing that short-term momentum has shifted against the buyers. My read is therefore cautious rather than automatically bearish. ETH is testing support, but I want confirmation before assuming this is a reversal zone. Bullish trigger: 6H reclaim and close above the $2,680–$2,685 MA/EMA cluster. Entry: Approximately $2,685–$2,700 after confirmation/retest. SL/invalidation: Around $2,650, depending on the retest structure. TP1: $2,708 TP2: $2,750 TP3: $2,780 The first major upside obstacle is the recent $2,749.66 24H high, followed by the larger chart resistance around $2,779–$2,808. For the bearish setup, I would watch the current support very closely. Bearish trigger: A decisive 6H close below $2,663–$2,665 with expanding volume. Bearish invalidation: Reclaiming and holding above approximately $2,685. If $2,665 fails, the chart already provides visible downside reference zones around $2,594.77, followed by approximately $2,524.23 and $2,480.63. I would not assume ETH reaches those levels; they are simply the next visible Fibonacci extension areas on the provided chart. My thesis: ETH is at a decision point rather than a confirmed breakdown. The broader rally from the September lows remains visible, but momentum has weakened and price has slipped beneath the short-term moving-average cluster. Holding $2,665 and reclaiming $2,685 would give buyers a chance to retest $2,750–$2,780. Losing $2,665 on expanding volume would change the structure and open the deeper Fibonacci levels shown on the chart. $ETHUSDT #ByXIMPACT #BybitOdds
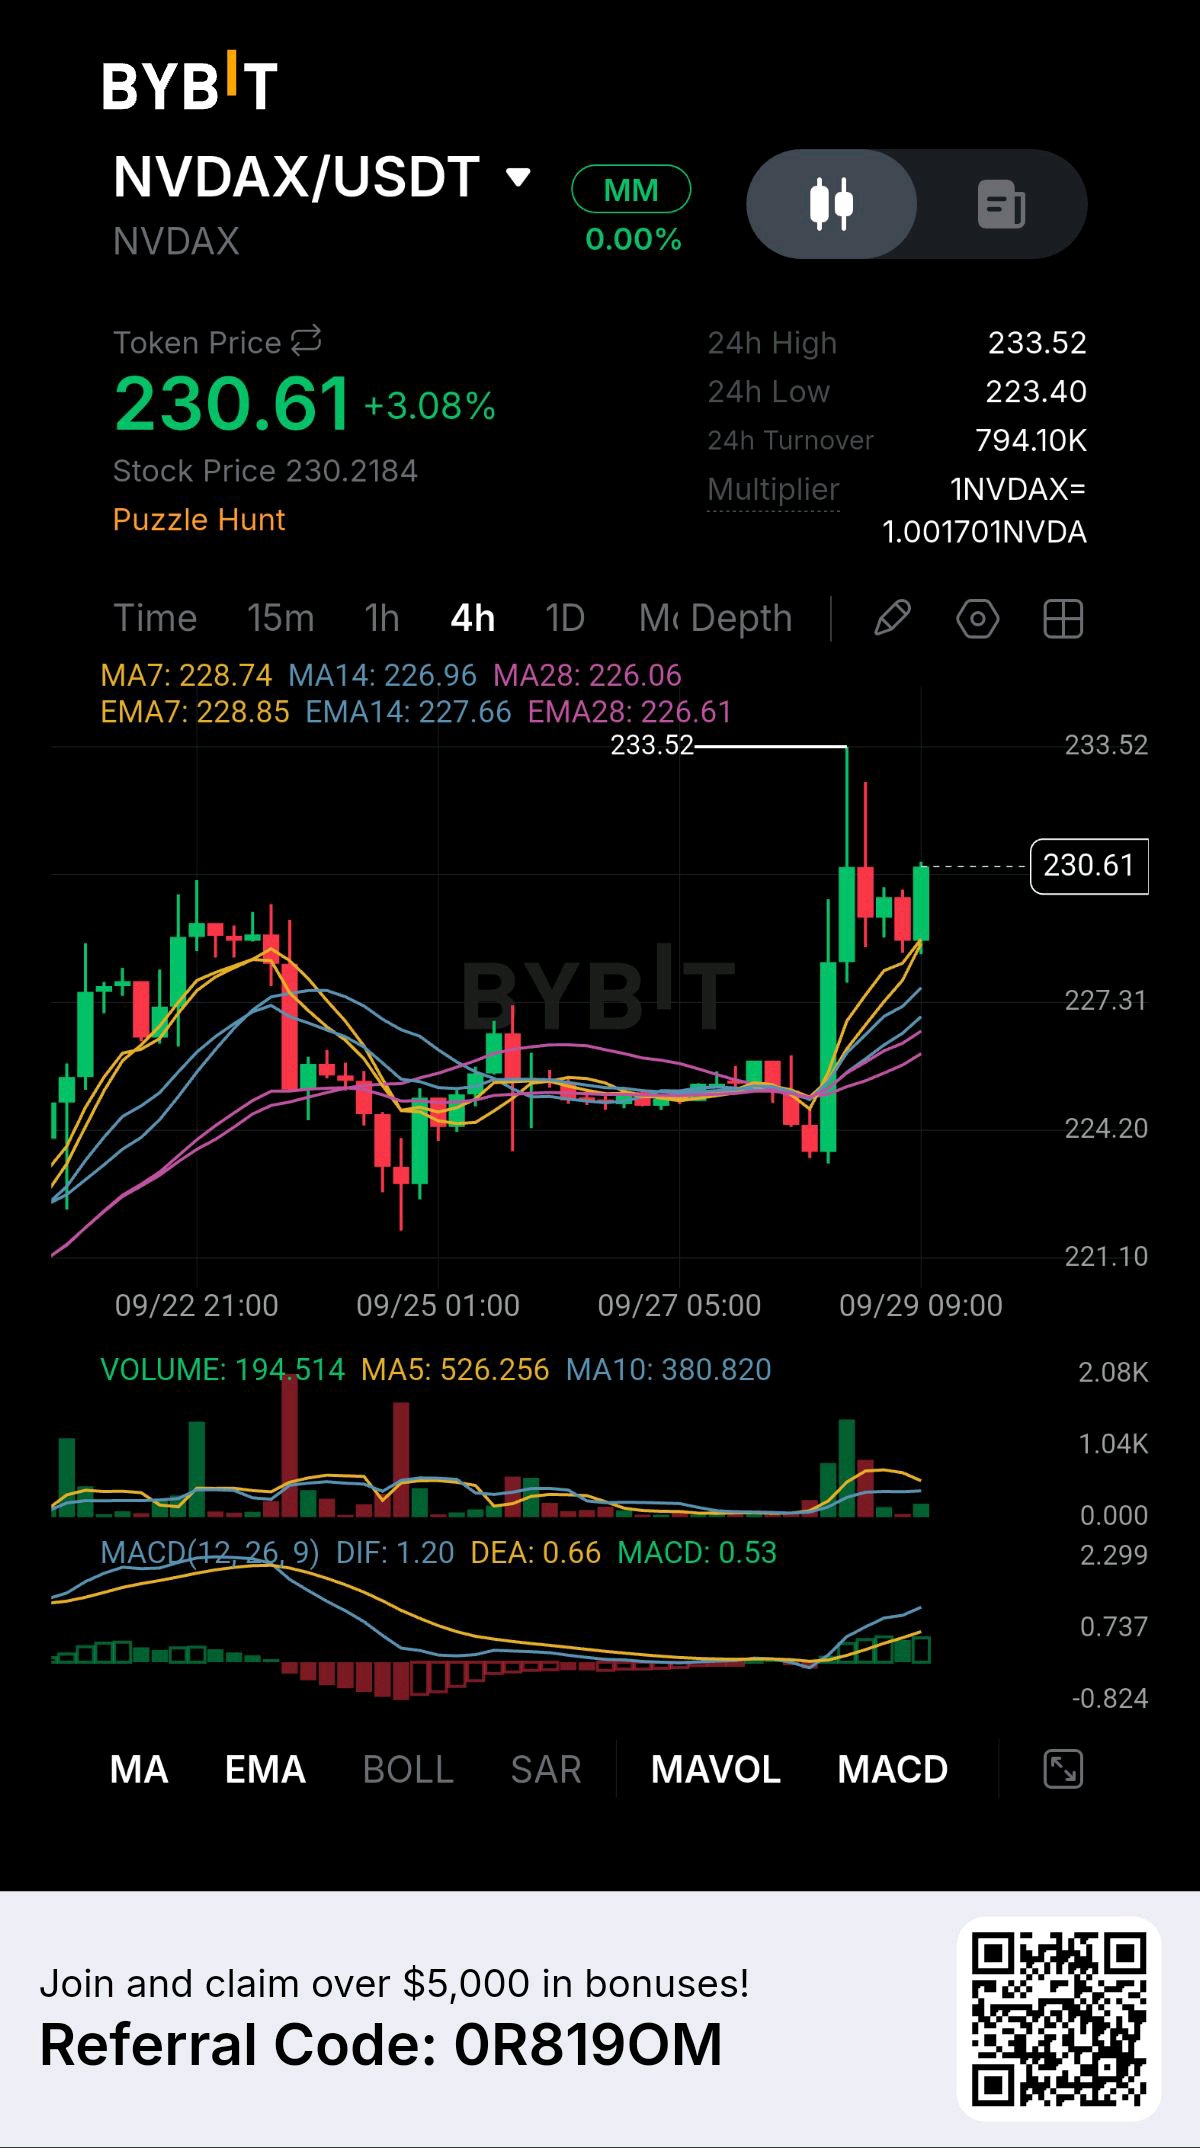
NVDAX is showing a small but important structural shift: price spent days moving sideways around $224–$227, then suddenly broke higher and pushed into $233.52. What interests me now is that the pullback from that high has been relatively shallow, leaving price above the entire moving-average cluster. From the chart, NVDAX is trading around $230.61, up 3.08%, with a visible 24H high of $233.52, low of $223.40, and 24H turnover of approximately 794.10K. The screen also shows a stock reference price of $230.2184 and a multiplier of 1NVDAX ≈ 1.001701 NVDAX, but I’m focusing here on the visible price structure rather than assuming anything beyond the chart. The interesting change happened after a prolonged compression. For several sessions, NVDAX remained trapped around the $224–$227 region, with the moving averages repeatedly converging. Then price pushed sharply higher, broke through the local range and reached $233.52. That breakout also changed the moving-average structure. MA7 is currently around $228.74, MA14 $226.96, and MA28 $226.06. The EMA values are similarly aligned: EMA7 $228.85, EMA14 $227.66, and EMA28 $226.61. Current price is above all six averages. For me, that matters more than the +3.08% headline because it shows that the short-term structure has shifted from compression into expansion. The moving averages are beginning to separate rather than remaining completely flat. Volume provides additional evidence, although there is an important caveat. The screenshot shows current volume around 194.514, versus MA5 at approximately 526.256 and MA10 at 380.820. The breakout itself produced visibly larger volume bars, but the latest displayed volume is lower. If the current candle is still developing, that number should not be treated as final. So I see a breakout that has attracted participation, followed by a quieter consolidation near the highs. MACD is also supporting the move. DIF is around 1.20, DEA 0.66, and MACD approximately 0.53. The indicator has turned positive, and the histogram is green. That confirms that momentum has improved alongside the price breakout. My read is constructive, but $233.52 is the level I need buyers to prove they can reclaim. I don't want to chase directly underneath that resistance. Bullish trigger: 4H close above $233.52 with renewed volume. Entry: Approximately $233.7–$235.0 after confirmation or a successful retest. SL/invalidation: Around $228.0, below the short-term MA/EMA structure. TP1: $238 TP2: $242 TP3: $248 The bearish scenario is straightforward. If NVDAX rejects $233.52 and then loses the $227.3–$228.0 region, I would consider the breakout structure weakened. That would put the market back inside the previous compression zone. Bearish trigger: 4H close below approximately $227.30. Bearish invalidation: Reclaiming and holding above $233.52. I wouldn't force an R:R calculation yet because the actual risk depends on whether the breakout happens immediately or after a retest. My thesis: NVDAX has moved from compression into a genuine 4H expansion, but the breakout isn't fully proven until $233.52 becomes support. The key evidence is the reclaim of the MA/EMA cluster and positive MACD; the key risk is fading volume after the initial impulse. Above $233.52 with fresh participation, the structure opens toward higher levels. Below $227.30, the market risks falling back into the range that dominated the previous sessions. $NVDAXUSDT #ByXIMPACT

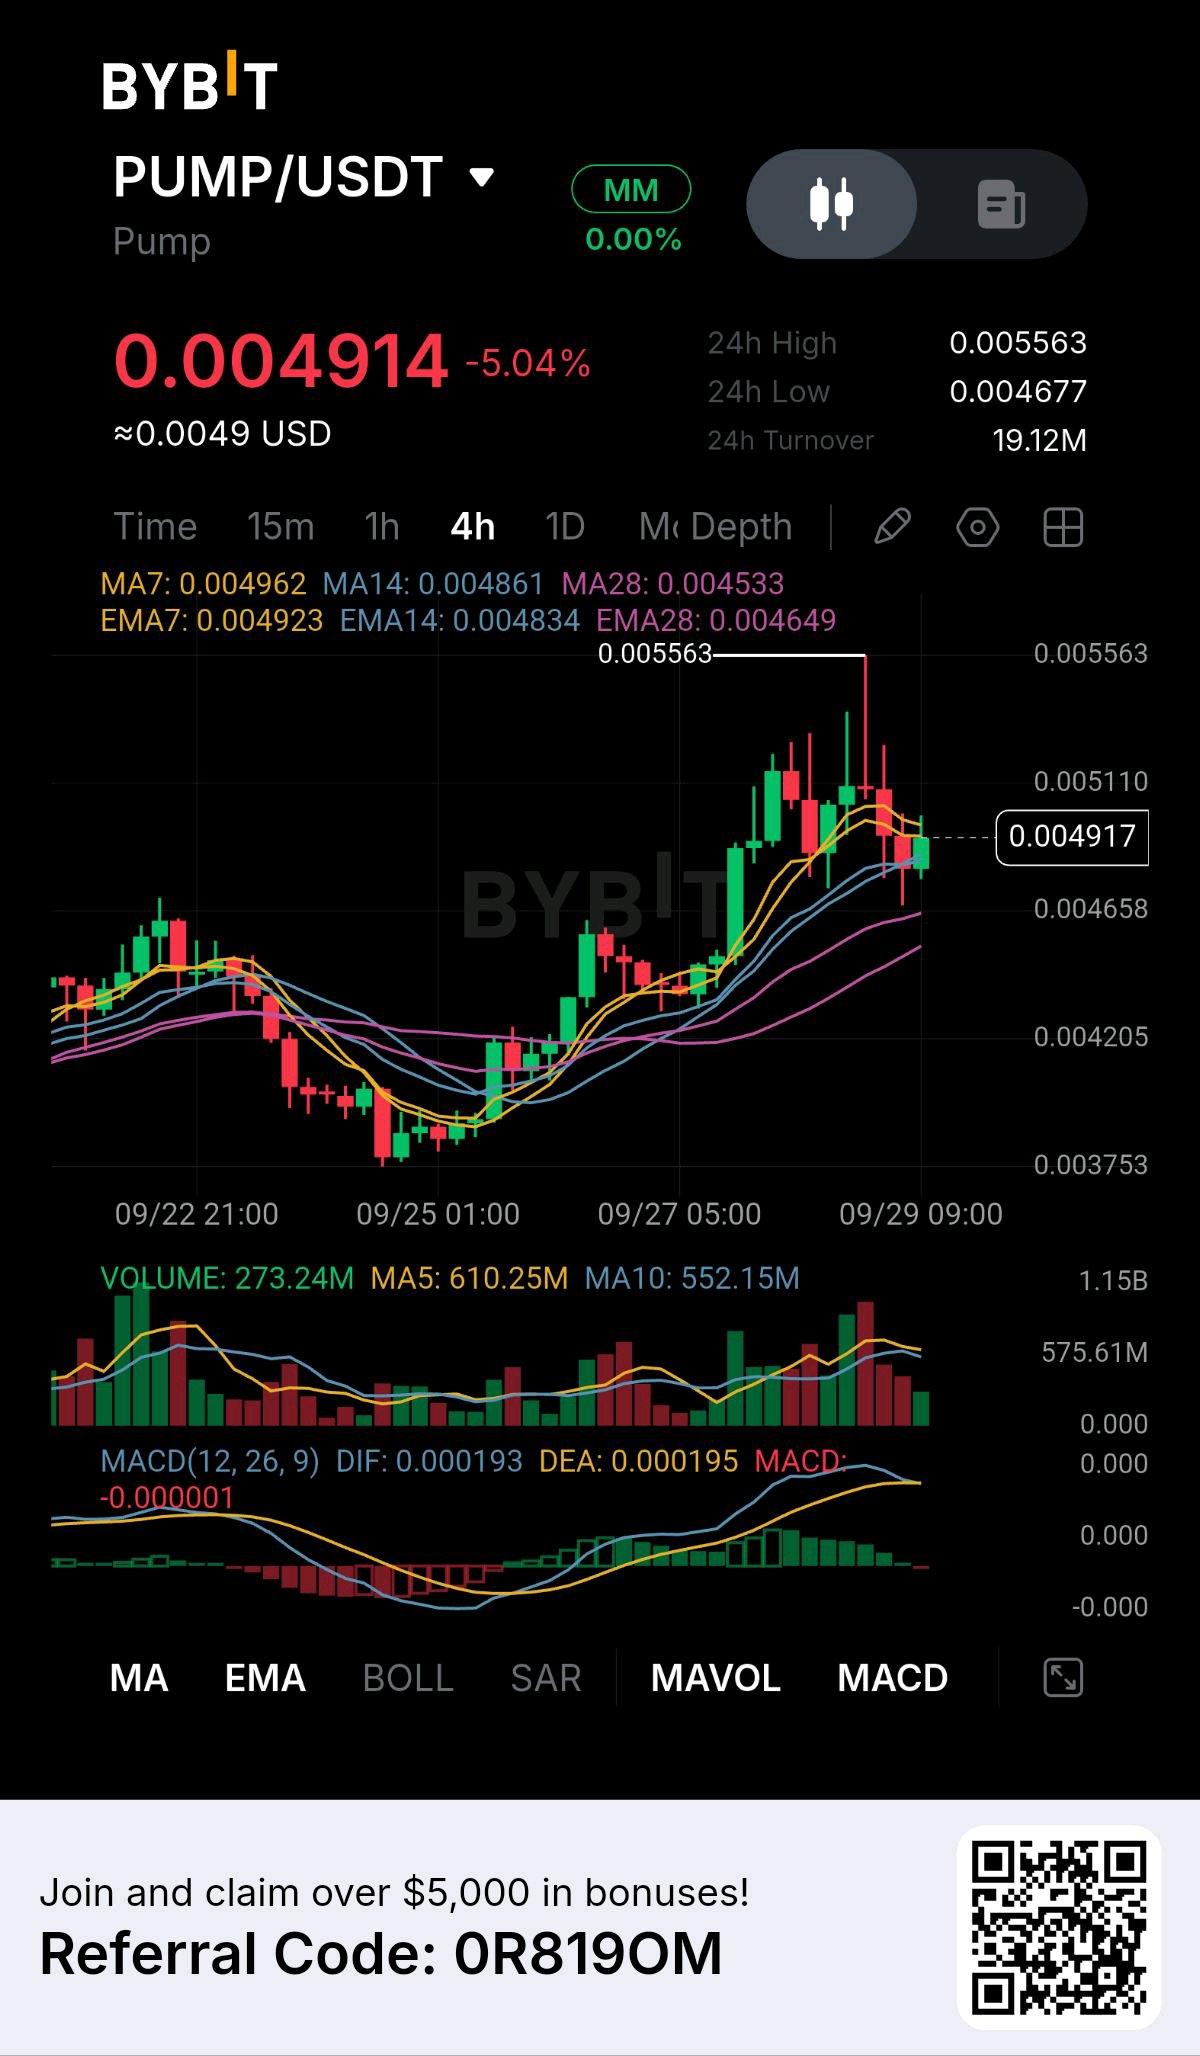
PUMP is showing a classic post-breakout problem: price is still holding above its breakout structure, but momentum is clearly cooling after the move toward $0.005563. That makes the next 4H candles more important than the original rally. From the chart, PUMP is trading around $0.004914, down 5.04%, with a visible 24H high of $0.005563, low of $0.004677, and 24H turnover of approximately $19.12M. The 4H structure changed around September 26–27. Before that, PUMP had been trading much lower, reaching roughly $0.00375 before recovering. Buyers then pushed through the $0.00420 area and accelerated toward $0.0055. The unusual part is what happened afterward. Price reached $0.005563, but instead of immediately continuing higher, several candles began forming underneath that level. The current price around $0.004914 is still above the previous breakout area, but the market is losing some of the momentum that produced the initial expansion. The moving-average structure is still constructive. MA7 is around $0.004962, MA14 $0.004861, and MA28 $0.004533. EMA7 is $0.004923, EMA14 $0.004834, and EMA28 $0.004649. Current price is therefore sitting around the short-term averages while remaining above the longer-term MA/EMA structure. For me, that creates a clear decision zone around $0.00465–$0.00485. Volume is where the caution comes from. The screenshot shows current volume around 273.24M, compared with MA5 at approximately 610.25M and MA10 at 552.15M. The earlier rally produced much larger volume, while recent candles have shown declining participation. That doesn't automatically mean sellers are taking control, but it tells me the original breakout impulse is no longer accelerating. MACD gives me the same warning. DIF is around 0.000193, DEA 0.000195, with MACD approximately -0.000001. The lines have converged almost completely, and the histogram has contracted from its earlier positive expansion. So my read is neutral-to-cautious bullish. The breakout structure is still alive, but I don't want to chase PUMP while momentum is flattening directly underneath the recent high. Bullish trigger: A clean 4H close above $0.005563, preferably with volume expanding above the recent baseline. Entry: Approximately $0.00558–$0.00570 after confirmation or a successful retest. SL/invalidation: Around $0.00485. TP1: $0.00600 TP2: $0.00650 TP3: $0.00700 The bearish setup activates if PUMP loses the $0.00465 area on a convincing 4H close. That would put price back below the EMA28/MA28 region and weaken the current breakout structure. Bearish trigger: 4H close below $0.00465 with increasing selling volume. Bearish invalidation: Reclaiming and holding above $0.005563. I wouldn't force an R:R calculation yet because the best entry depends on whether PUMP breaks $0.005563 directly or first gives a deeper retest toward the moving-average cluster. My thesis: PUMP has already proved that buyers can create a strong expansion, but now the market needs to prove that buyers can sustain it. The $0.005563 high is the obvious confirmation level, while $0.00465–$0.00485 is the structural area I would defend. A volume-backed breakout above $0.005563 would restart the expansion; losing $0.00465 would suggest the current move needs a deeper reset before another attempt. $PUMPUSDT #ByXIMPACT
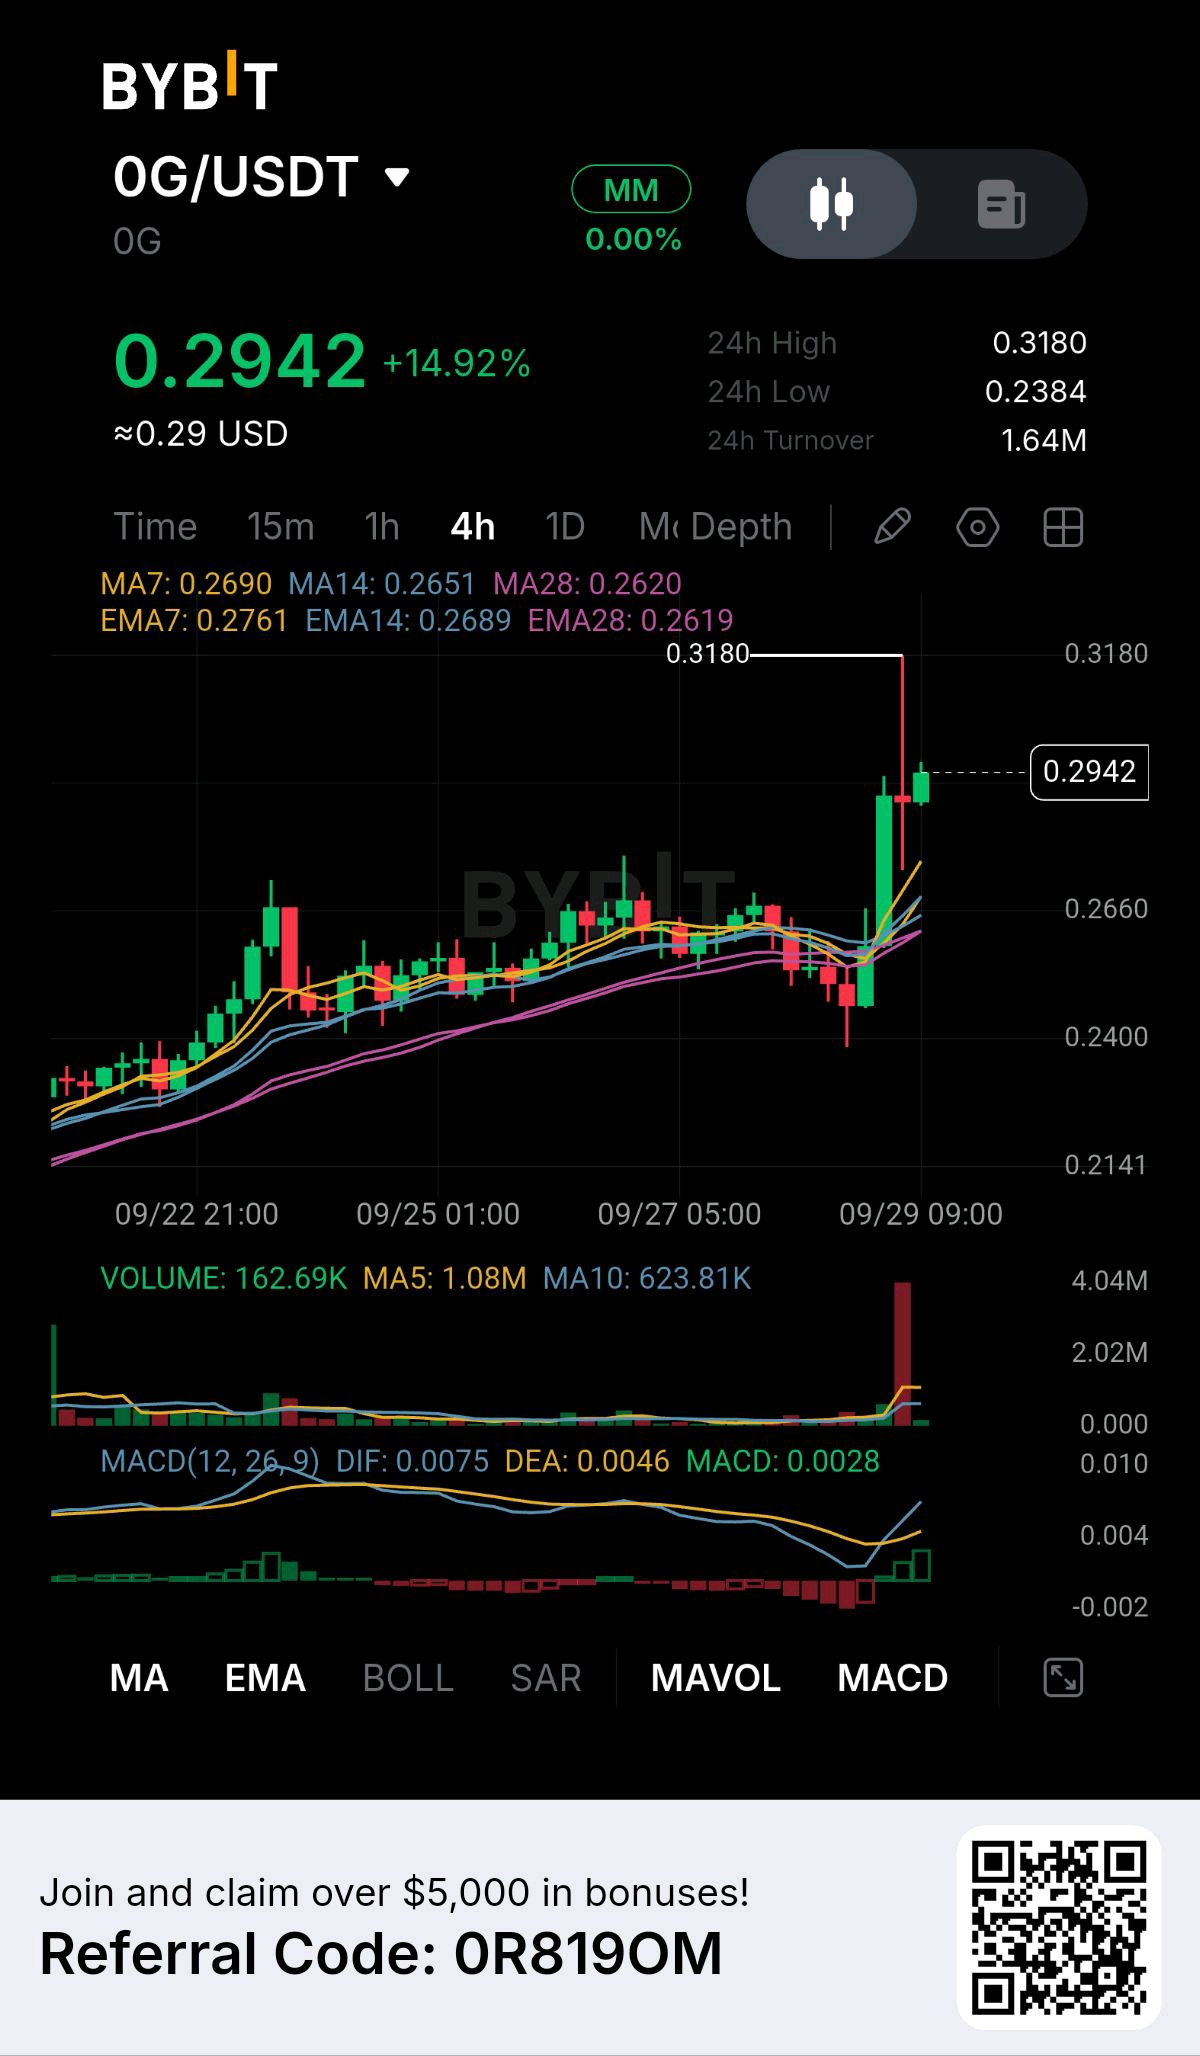
0G is showing a classic breakout-versus-exhaustion battle right now: price has jumped almost 15% in 4H, but the candle has already been rejected from $0.3180. What matters to me is whether buyers can hold the breakout zone after that rejection rather than simply printing another green candle. From the chart, 0G is trading around $0.2942, up 14.92%, with a visible 24H high of $0.3180, low of $0.2384, and turnover of approximately $1.64M. The 4H structure was relatively quiet around $0.25–$0.27 before the latest expansion. Price then pushed sharply through the previous consolidation and reached $0.3180. After that spike, sellers pulled price lower, but buyers immediately recovered part of the move and brought 0G back toward $0.2942. That reaction is the part I’m watching. The moving-average structure has turned sharply higher. MA7 is around $0.2690, MA14 $0.2651, and MA28 $0.2620. The EMA values are $0.2761, $0.2689, and $0.2619 respectively. Current price remains well above this entire cluster. So the breakout has not technically been erased. Volume provides the strongest confirmation of the move. The screenshot shows current volume around 162.69K, while MA5 is approximately 1.08M and MA10 around 623.81K. The important detail is the huge volume spike on the breakout candle. The current candle's displayed volume is much smaller, but because it may still be developing, I wouldn't treat that figure as final. MACD has also flipped positive. DIF is around 0.0075, DEA 0.0046, and MACD approximately 0.0028. The histogram has moved back into positive territory after the preceding negative sequence. That supports the idea that momentum has changed, although the first rejection from $0.3180 shows that sellers are active at the highs. My read is that 0G has a valid breakout structure, but $0.3180 is now the confirmation level. I wouldn't chase the current price simply because the token is up nearly 15%. Bullish trigger: 4H close above $0.3180 with renewed volume. Entry: Approximately $0.319–$0.325 after confirmation or a successful retest. SL/invalidation: Around $0.285, depending on the retest structure. TP1: $0.340 TP2: $0.360 TP3: $0.390 For the bearish scenario, I would watch the breakout area around $0.266–$0.270. If 0G loses that zone after failing at $0.3180, the recent breakout would look much less convincing. Bearish trigger: 4H close below approximately $0.266 with expanding selling volume. Bearish invalidation: Reclaiming and holding above $0.3180. I wouldn't force an R:R calculation yet because the cleanest entry depends on whether OG breaks $0.3180 directly or first gives a controlled retest. My thesis: 0G has changed its 4H structure through a volume-backed expansion, but the market has immediately encountered supply at $0.3180. The next move is therefore about acceptance, not the size of the percentage gain. Holding the $0.266–$0.270 breakout structure keeps the upside setup alive; a volume-backed break above $0.3180 would confirm that buyers are ready to extend the move, while losing the breakout base would turn the current spike into a potential failed breakout. $0GUSDT #ByXIMPACT
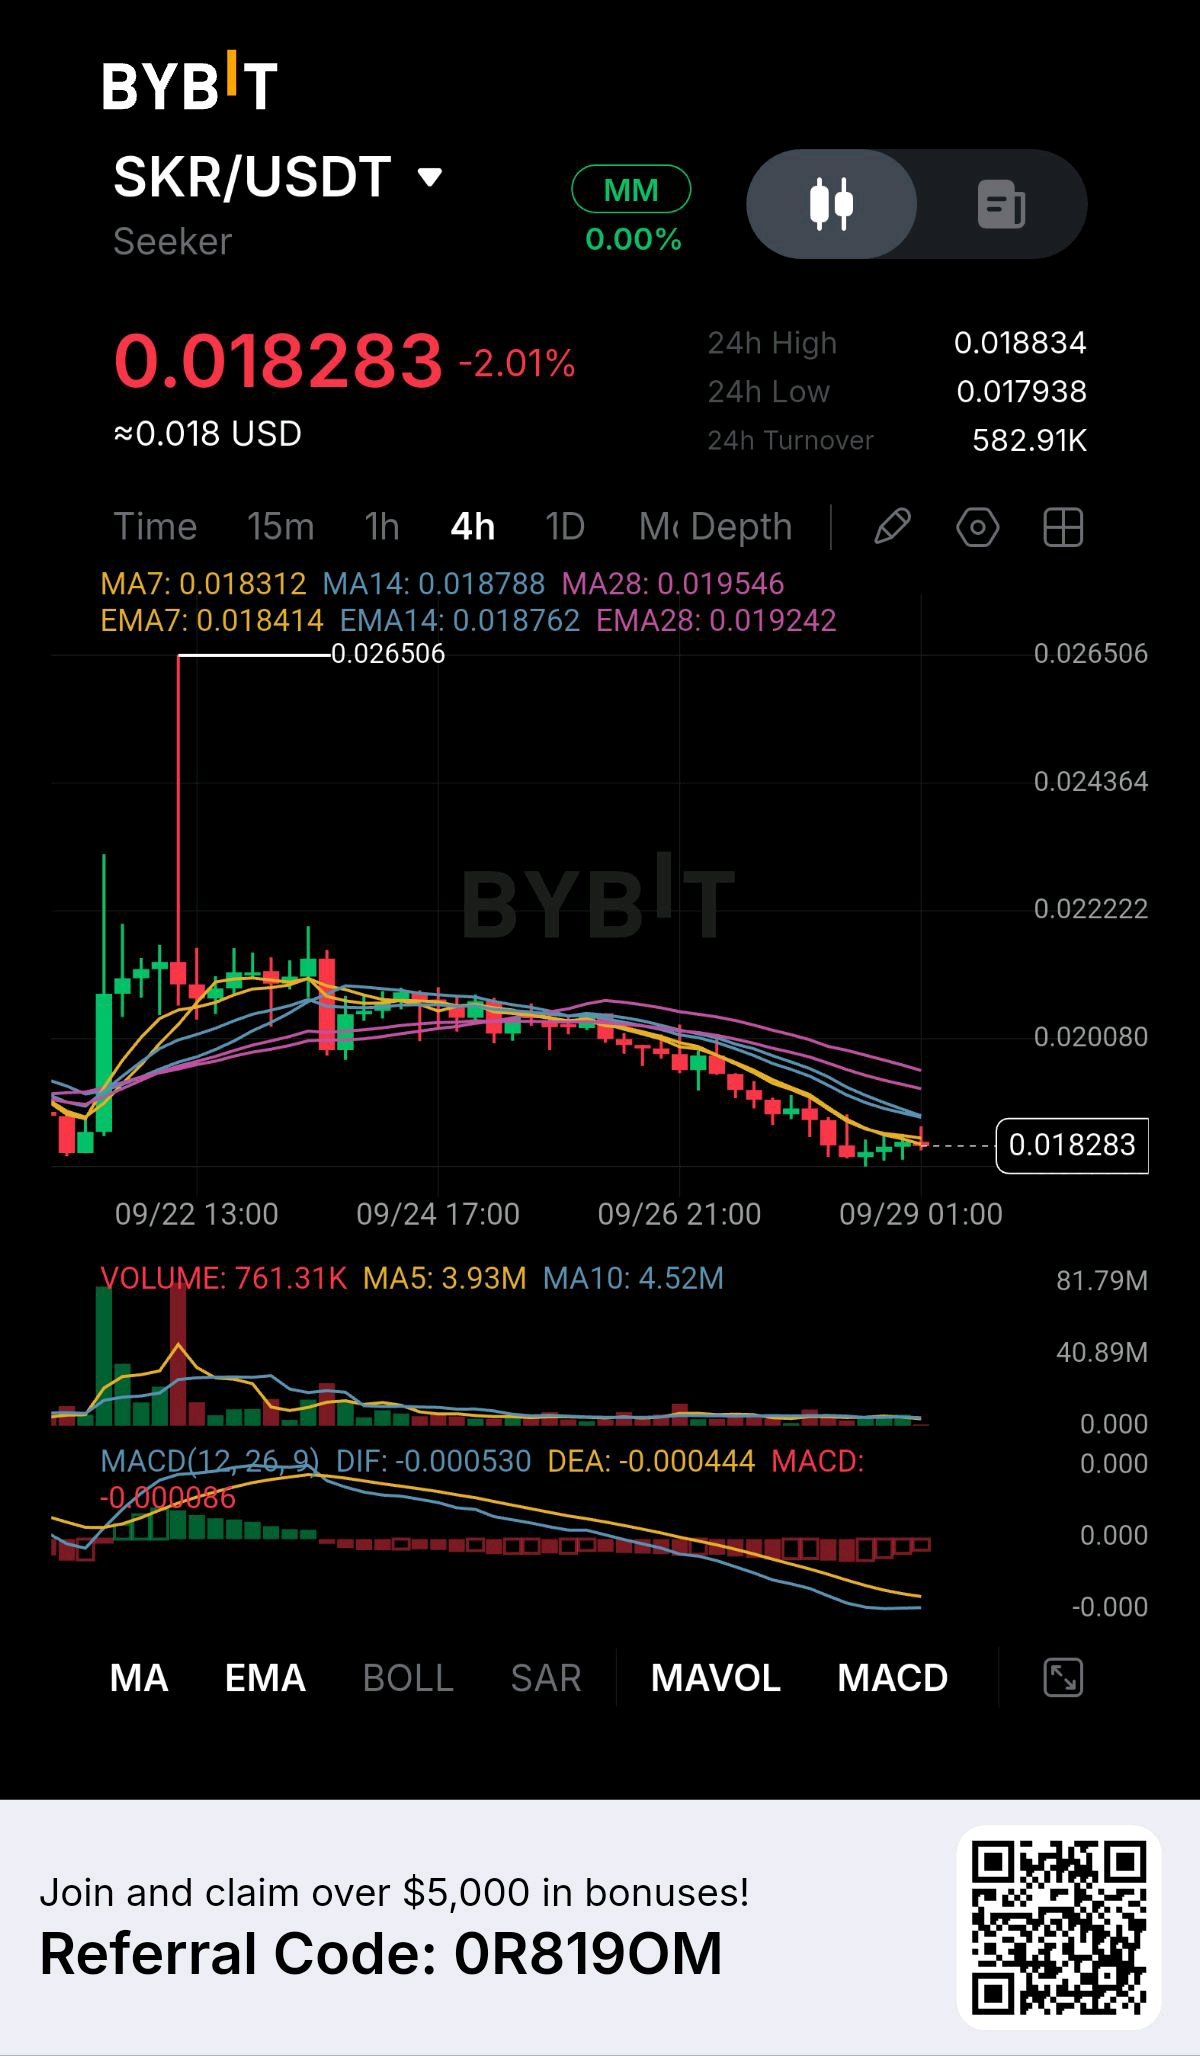
SKR is showing a very different setup from the breakout charts I’ve been watching lately: the initial excitement has completely faded, and price is now sitting near the bottom of a persistent 4H downtrend. The interesting question is whether this is early stabilization or simply another pause before sellers continue. From the chart, SKR is trading around $0.018283, down 2.01%, with a visible 24H high of $0.018834, low of $0.017938, and turnover of approximately $582.91K. The chart tells a clear story. SKR initially experienced a sharp move from around $0.018 toward the $0.026506 spike high. That move was immediately rejected, and since then the market has gradually produced lower highs and lower lows. Price eventually slipped below the $0.02080 region and continued drifting toward the current $0.018 area. What caught my attention is how different the current volume is from the original move. The chart shows current volume around 761.31K, while MA5 is approximately 3.93M and MA10 around 4.52M. The enormous volume that accompanied the initial price expansion has disappeared. Recent candles are occurring with much smaller participation. That can mean two different things: sellers are becoming exhausted, or buyers simply aren't interested yet. The chart alone doesn't tell me which one it is. The moving averages currently favor the second interpretation. MA7 is $0.018312, MA14 $0.018788, and MA28 $0.019546. EMA7 is $0.018414, EMA14 $0.018762, and EMA28 $0.019242. Price is below every displayed average except that it is sitting very close to MA7. More importantly, the averages are stacked above price, meaning the market still has several layers of overhead resistance. MACD is also not confirming a reversal. DIF is around -0.000530, DEA -0.000444, and MACD approximately -0.000086. The histogram remains negative. There is some contraction in the recent negative bars, but the MACD lines are still below zero. My read is therefore cautious: SKR may be approaching a stabilization zone, but I don't have enough evidence yet to call it a reversal. I would rather see price reclaim the short-term averages with volume than buy simply because it has fallen significantly. For the bullish setup, my first trigger is a reclaim of the $0.0188–$0.0190 region. Entry: Approximately $0.0189–$0.0192 after a confirmed 4H reclaim. SL/invalidation: Around $0.0180. TP1: $0.01955 TP2: $0.02080 TP3: $0.02220 The bigger confirmation would come if SKR eventually reclaims the $0.02080 area with meaningful volume. That would put price back above the MA28/EMA28 region and challenge the sequence of lower highs. The bearish scenario is simpler. If $0.01794 breaks decisively on a 4H close with increasing volume, I would treat the current stabilization attempt as unsuccessful. Bearish trigger: 4H close below $0.01794. Bearish invalidation: Reclaiming and holding above $0.01955. I wouldn't force an R:R calculation yet because the current price is sitting too close to the lower boundary, while confirmation would require a move back through several resistance levels. My thesis: SKR is not showing a confirmed reversal yet; it is showing a market that has moved from high-volume excitement into low-volume decline. The key change I’m watching is whether buyers can reclaim $0.0188–$0.0190 and eventually turn $0.02080 into support. Until that happens, the moving-average structure and MACD still favor caution. A break below $0.01794 would reinforce the existing downtrend, while a volume-backed reclaim of $0.02080 would be the first meaningful evidence that the market story has changed. $SKRUSDT #ByXIMPACT
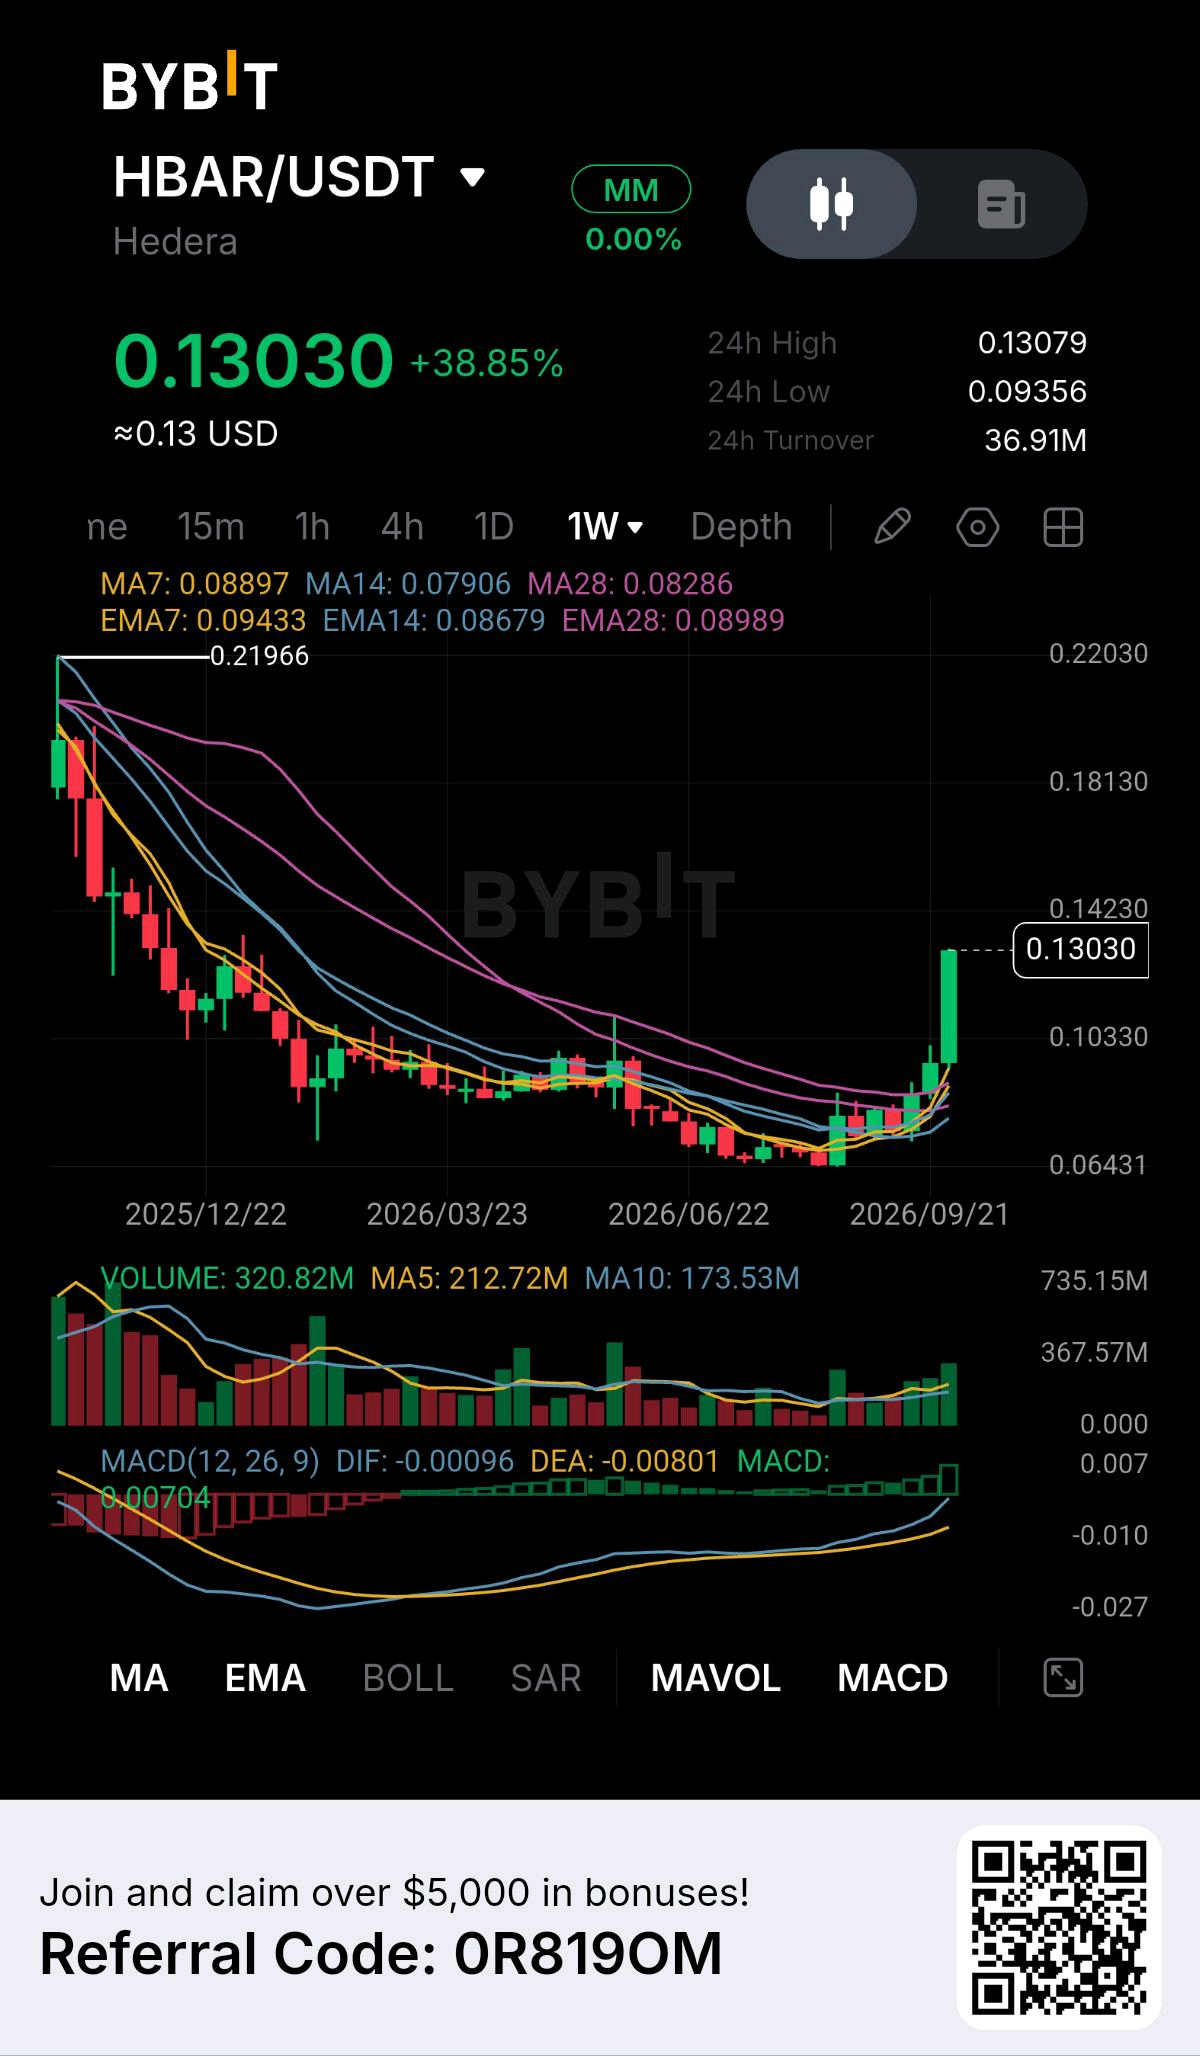
HBAR has just broken out of a structure that had been compressing for months, and the interesting part is where that breakout happened. Price didn't simply bounce from a short-term support level — it pushed through the entire weekly moving-average cluster and reached $0.13 in one major expansion. From the chart, HBAR is trading around $0.13030, up 38.85%, with a visible 24H high of $0.13079, low of $0.09356, and 24H turnover of approximately $36.91M. The chart is on the 1W timeframe, so this move carries considerably more structural weight than a normal intraday breakout. The previous trend was clearly weak. HBAR fell from the visible $0.21966 area and spent months declining toward roughly $0.06431. For much of that period, the moving averages were stacked above price and acting as overhead resistance. That relationship has now changed. MA7 is around $0.08897, MA14 $0.07906, and MA28 $0.08286. The EMA values are $0.09433, $0.08679, and $0.08989 respectively. Current price is dramatically above all of them. For me, that's the unusual observation: HBAR has gone from trading underneath a compressed weekly average structure to trading well above it in a single expansion. Volume confirms that something materially changed on the chart. The displayed volume is approximately 320.82M, compared with MA5 at 212.72M and MA10 at 173.53M. The latest weekly volume is therefore above both recent averages. Since the current weekly candle may still be developing, I would not treat this as final volume, but the expansion is clearly visible. MACD is also changing regime. DIF is around -0.00096, DEA -0.00801, with MACD around 0.00704. The histogram has moved into positive territory while the MACD lines are turning upward from deeply negative levels. That matters because the price breakout is now being accompanied by improving momentum rather than occurring completely against the indicator structure. My read is bullish on the structure, but I would not chase a 38% weekly candle without confirmation. The immediate resistance is the current $0.13079 high, while the next major visible weekly reference is around $0.14230. Bullish trigger: Weekly acceptance above $0.13079, ideally with continued elevated volume. Entry: Approximately $0.131–$0.135 after confirmation or a successful retest. SL/invalidation: Around $0.103, because losing that breakout region would materially weaken the new weekly structure. TP1: $0.1423 TP2: $0.1600 TP3: $0.1810 The bearish scenario is straightforward. If HBAR fails to hold the breakout and falls back below approximately $0.1033, I would treat the current move as vulnerable to a deeper retracement. The next major chart reference would then be around the $0.09 region, close to the weekly EMA cluster. Bearish trigger: Weekly failure below $0.1033. Bearish invalidation: Reclaiming and holding above $0.13079. I wouldn't force an R:R calculation here because the current weekly candle is unusually large and the eventual retest will determine the actual entry and invalidation distance. My thesis: HBAR's important change is the transition from months of weekly compression and decline into a volume-backed breakout above the entire moving-average structure. The $0.13079 high is now the confirmation point. If buyers can turn that level into support, this becomes a much more meaningful higher-timeframe trend reversal; if price falls back below $0.1033, the breakout needs to be treated as unfinished rather than automatically assuming continuation. $HBARUSDT #ByXIMPACT
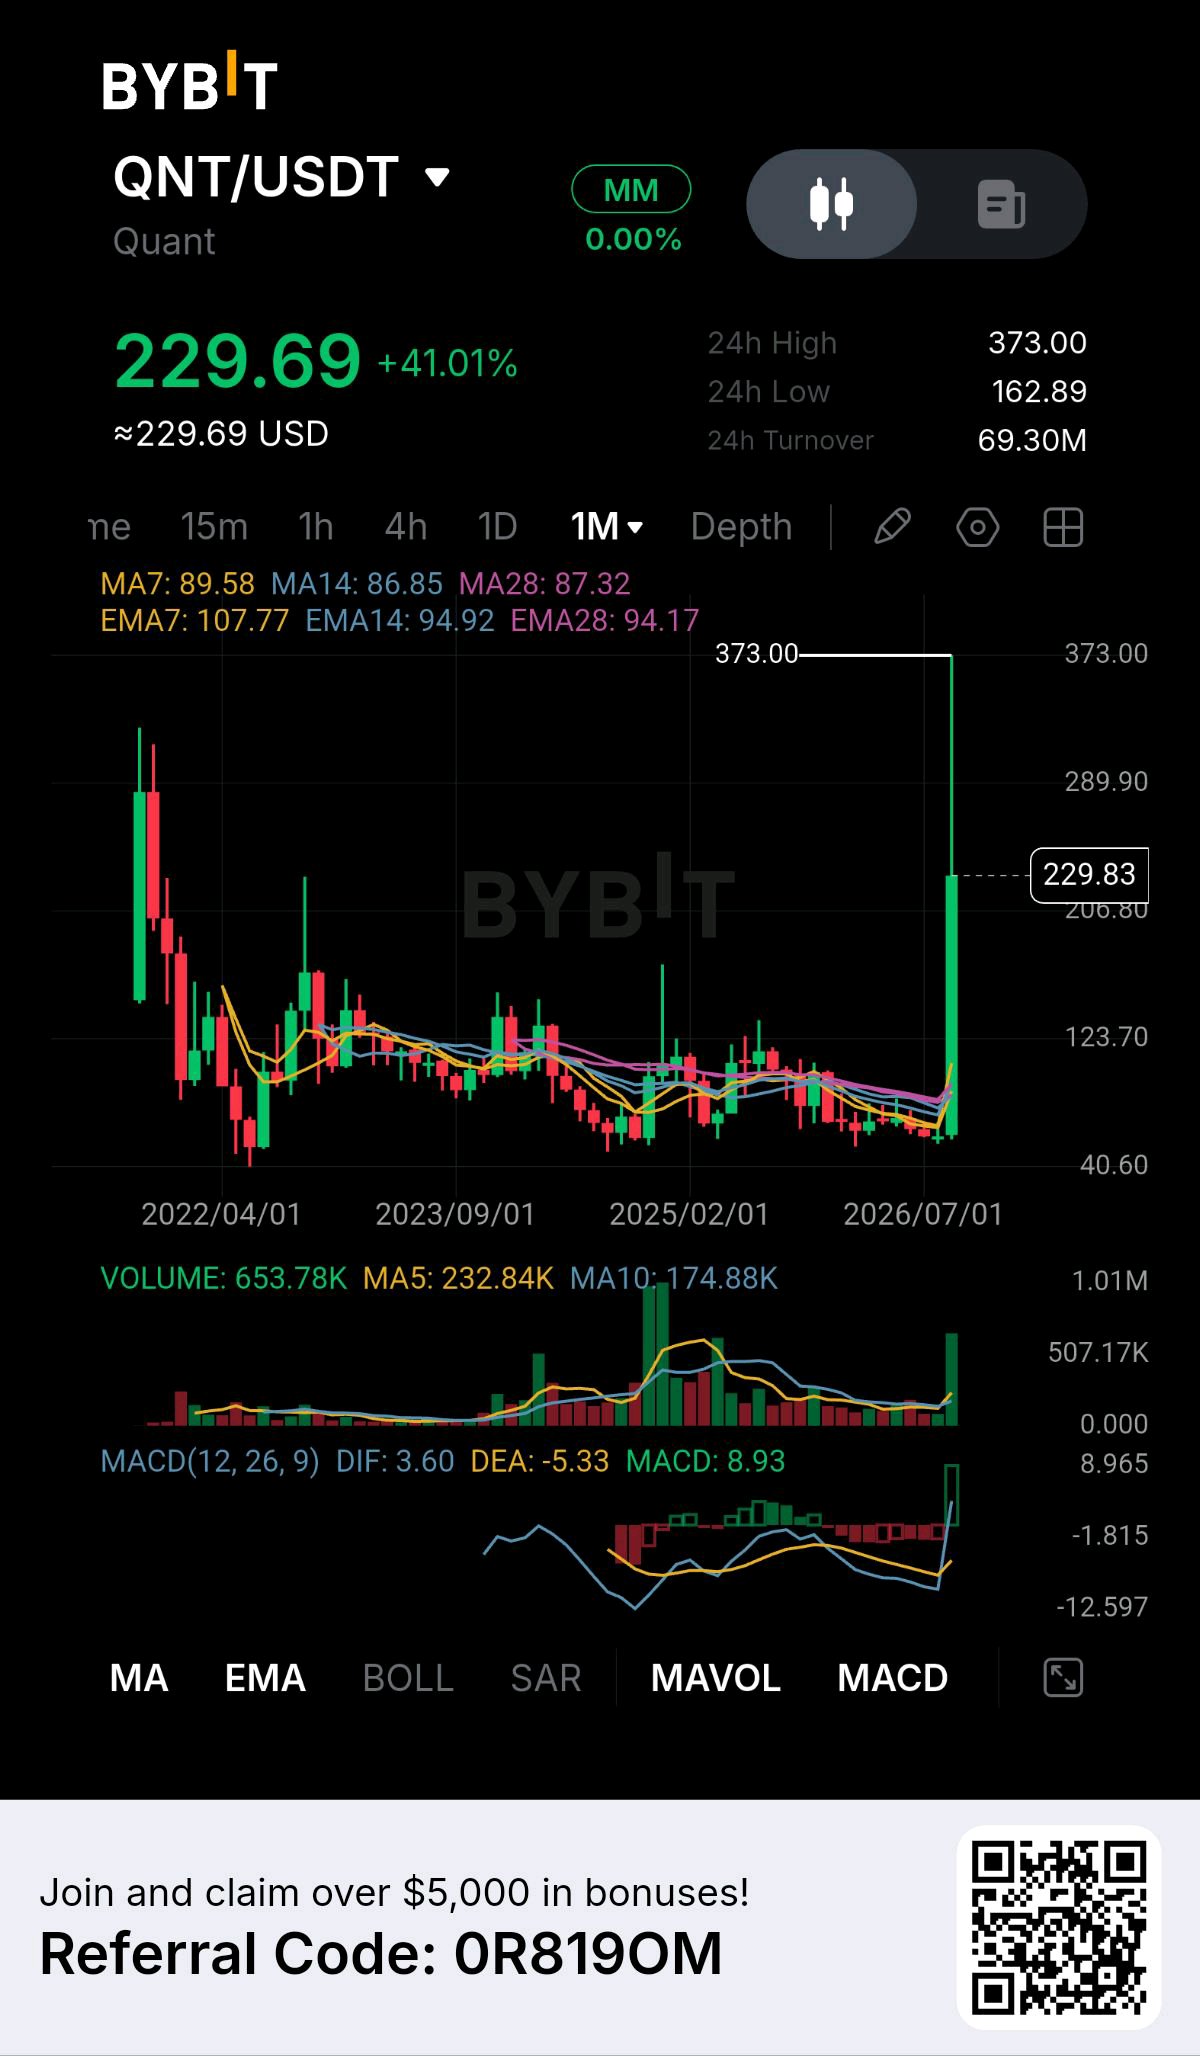
QNT has just produced one of the most dramatic candles on this entire monthly chart, but the part I’m watching is not the 41.01% gain. It is the fact that price has moved from a multi-year compression zone into a level where the previous chart history becomes much more relevant. From the chart, QNT is trading around $229.69, up 41.01%, with a visible 24H high of $373.00, low of $162.89, and 24H turnover of approximately $69.30M. The timeframe is 1M, so this is a much larger structural event than a normal short-term breakout. For years on the visible chart, QNT spent most of its time below roughly $125, with repeated attempts to recover followed by long periods of consolidation and decline. The latest monthly candle has completely changed that picture. Price accelerated from the lower part of the historical range, broke through the area around $123.70, and pushed as high as $373.00 before retracing toward the current $229 area. That creates the main contradiction: the trend has exploded higher, but the current candle has already shown a very large rejection from its high. The moving averages demonstrate how unusual this move is. MA7 is around $89.58, MA14 $86.85, and MA28 $87.32. EMA7 is $107.77, EMA14 $94.92, and EMA28 $94.17. Current price is therefore trading dramatically above the entire monthly moving-average structure. That confirms an enormous momentum shift, but it also means I would be very careful about chasing the candle after such an extended move. Volume is supporting the structural change. The screenshot shows current volume around 653.78K, versus MA5 of approximately 232.84K and MA10 around 174.88K. The latest monthly volume bar is visibly much larger than the recent baseline. Because the candle is still developing, I would not treat the current volume as final, but the expansion is clearly visible. MACD has also flipped aggressively. DIF is shown at 3.60, DEA at -5.33, and MACD around 8.93. The histogram has moved sharply positive after spending much of the visible history below zero. That tells me this is not simply a small bounce inside the old range. My read is therefore structurally bullish but tactically cautious. I would not chase QNT at $229 after a candle that already reached $373. I want to see whether the market can establish acceptance above the old breakout region. Bullish trigger: A monthly close above $373, followed by acceptance above that level. Entry: Approximately $375–$385 after confirmation/retest. SL/invalidation: Around $300, depending on the eventual retest structure. TP1: $420 TP2: $480 TP3: $550 Those are scenario levels, not predictions. The bearish setup is equally important because the current candle has already demonstrated substantial volatility. Bearish trigger: Failure to hold the current breakout structure followed by a decisive move below approximately $206–$207. Bearish invalidation: Reclaiming and holding above $373. If the breakout fails, I would watch the previous major chart region around $123.70 as a much deeper structural reference, rather than assuming the current price must immediately return there. I wouldn't force an R:R calculation because the monthly candle is unusually large and the eventual retest could produce dramatically different execution levels. My thesis: QNT has transitioned from years of compression into an extraordinary monthly expansion, and the $373 spike is now the defining level. The question isn't whether momentum exists — the chart already proves that. The real test is whether the market can convert this explosive repricing into sustained acceptance above the previous historical range. Until that happens, I see a major structural breakout attempt, but also a very high-volatility environment where chasing the first candle carries significant invalidation risk. $QNTUSDT #ByXIMPACT

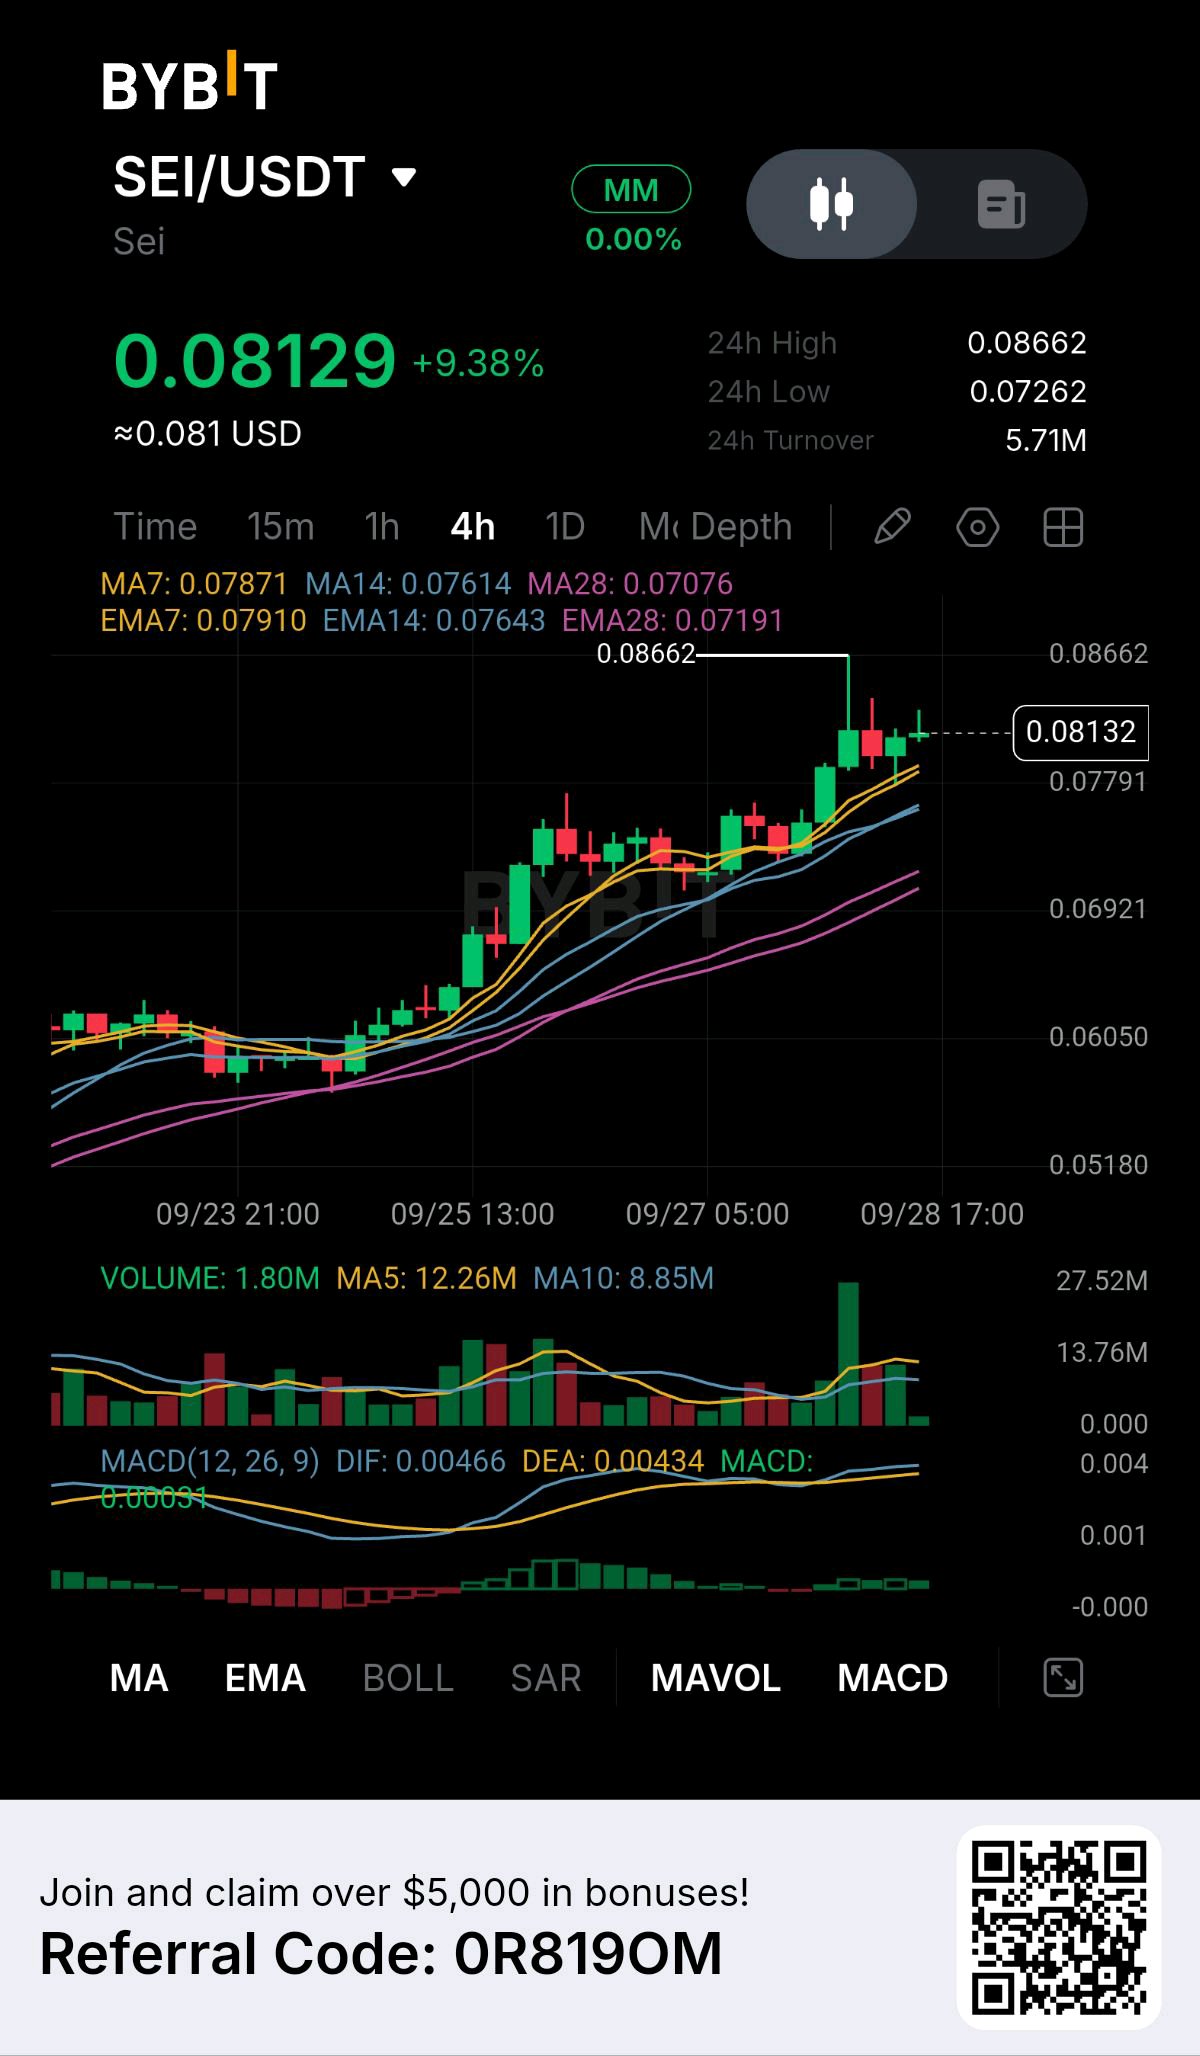
SEI has already made the difficult move — the interesting question now is whether buyers can defend the breakout instead of simply extending the first impulse. On the 4H chart, price pushed from the $0.06 area toward $0.08662, pulled back, and is still holding above the rising moving-average structure. That makes the reaction around $0.08662 the key point for me. At the time shown in the screenshot, SEI/USDT is trading around $0.08129, up 9.38%, with a visible 24H high of $0.08662, low of $0.07262, and turnover of approximately $5.71M. The structure is much cleaner than it was earlier in the chart. SEI spent time consolidating around the $0.059–$0.063 region before beginning a series of higher highs and higher lows. Price then pushed through the $0.069 area and accelerated toward $0.08. What I find important is that the first rejection from $0.08662 did not immediately destroy that structure. The moving averages are still supporting the trend. MA7 is around $0.07871, MA14 $0.07614, and MA28 $0.07076. The EMA structure is also bullish, with EMA7 at $0.07910, EMA14 at $0.07643, and EMA28 at $0.07191. Current price remains above all of them. That gives me a clear technical reference: the $0.078–$0.079 zone. As long as SEI continues holding that area, the latest breakout structure remains intact on this chart. Volume, however, keeps me from chasing the current price blindly. The chart shows current volume around 1.80M, while MA5 is approximately 12.26M and MA10 approximately 8.85M. The earlier breakout produced much larger volume, while recent candles have been quieter. Since the latest candle may still be incomplete, I wouldn't call this definitive volume exhaustion. But if SEI wants to break $0.08662 again, I want to see participation increase with the breakout. MACD remains positive. DIF is around 0.00466, DEA around 0.00434, and the displayed MACD value is approximately 0.00031. The indicator is still above the zero region, although momentum is not accelerating as aggressively as during the initial move. My read is therefore simple: the trend is constructive, but confirmation matters more than chasing. Bullish trigger: 4H close above $0.08662 with expanding volume. Entry: Around $0.0868–$0.0880 after confirmation or a successful retest. SL/invalidation: Around $0.0785. TP1: $0.0920 TP2: $0.0980 TP3: $0.1050 I would not treat these targets as guaranteed levels; they are areas I would monitor if the breakout establishes acceptance above $0.08662. The bearish setup is equally important. If SEI loses the $0.078–$0.079 area on a convincing 4H close, I would consider the possibility that the recent breakout is entering a deeper retracement. The next areas visible from the moving-average structure are approximately $0.0764 and $0.0719. Bearish trigger: 4H close below $0.0780 with increasing selling volume. Bearish invalidation: Reclaiming and holding above $0.08662. I don't see enough information to force a precise R:R before the breakout actually confirms because the execution price and retest structure will determine the real risk. My thesis: SEI has shifted from a slow accumulation phase into a clear 4H expansion, but $0.08662 is where the market now has to prove itself. Holding $0.078–$0.079 keeps the current structure alive; breaking $0.08662 with fresh volume would confirm another expansion attempt. Until one of those conditions occurs, I see a strong trend—but not a reason to chase blindly. $SEIUSDT #ByXIMPACT
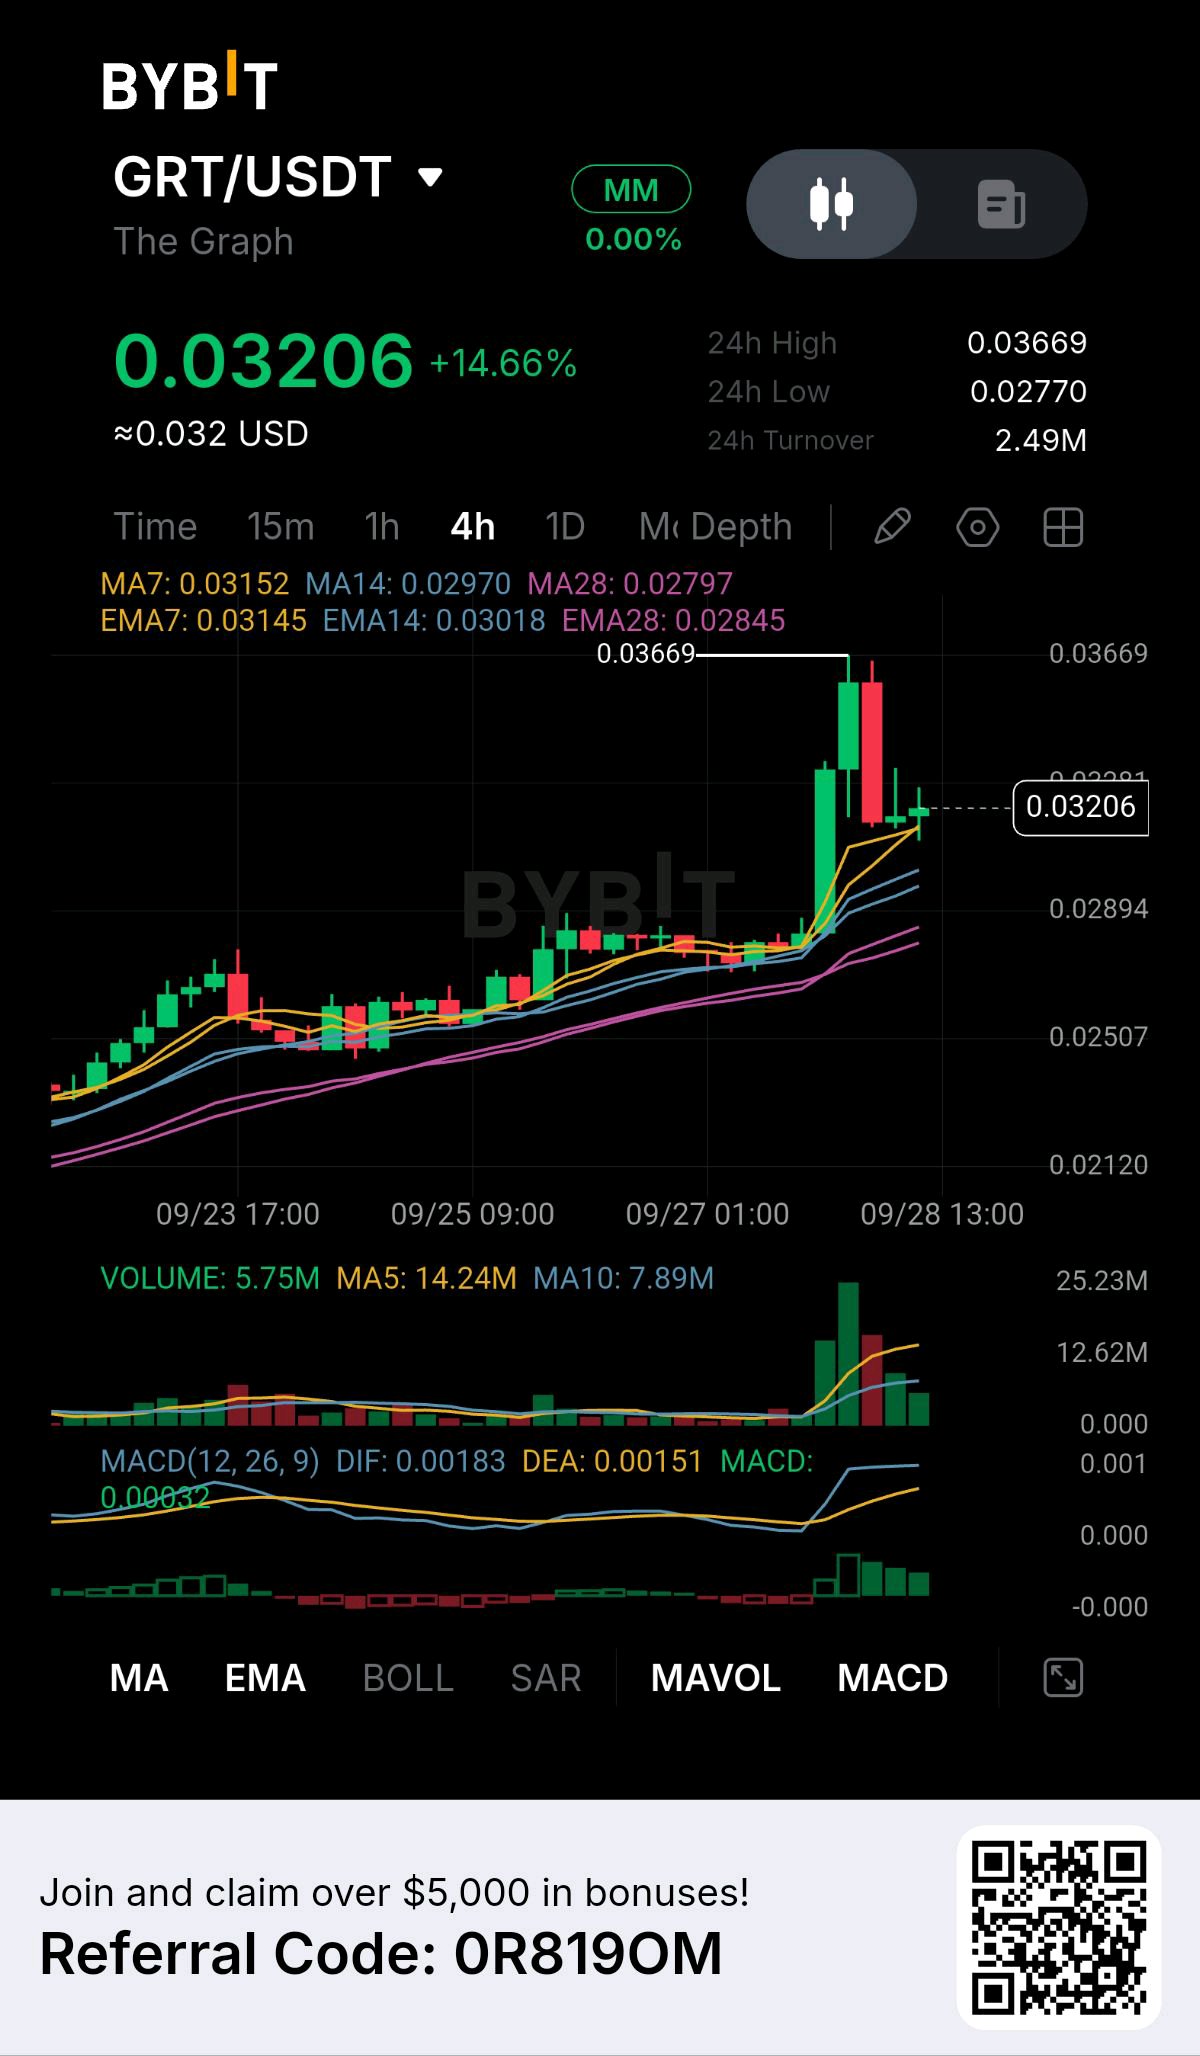
GRT has already made the breakout, but the more interesting part is what happened after the first vertical spike. Price briefly reached $0.03669, pulled back sharply, and is now attempting to stabilize around $0.032 instead of giving back the entire move. That makes this a confirmation setup rather than a simple momentum chase. From the chart, GRT is trading at $0.03206, up 14.66%, with a visible 24H high of $0.03669, low of $0.02770, and 24H turnover of approximately $2.49M. The 4H structure had been relatively controlled around the $0.025–$0.029 area. Then buyers pushed through the previous consolidation and produced a sharp expansion toward $0.03669. The important thing now is that the pullback has so far remained above the previous breakout region. The moving averages show a clear structural improvement. MA7 is $0.03152, MA14 $0.02970, and MA28 $0.02797. The EMA values are similarly positioned: EMA7 $0.03145, EMA14 $0.03018, and EMA28 $0.02845. Current price is sitting just above the short-term averages and well above the longer-term averages. That gives me a defined line in the sand. Volume is where the breakout becomes particularly interesting. The screenshot shows current volume around 5.75M, while MA5 is approximately 14.24M and MA10 7.89M. The largest volume spike arrived during the breakout, followed by declining volume during the retracement. I wouldn't interpret the current 5.75M as final because the candle may still be developing, but the sequence suggests the initial expansion attracted substantially more participation than the quiet trading before it. MACD is also supporting the recovery. DIF is shown around 0.00183, DEA around 0.00151, with MACD approximately 0.00032. The histogram remains positive, although the bars have started shrinking after the initial expansion. That tells me momentum is still positive, but the acceleration has cooled. My read is that GRT has a valid bullish structure, but $0.03669 is now the critical resistance. I don't want to chase $0.032 simply because the token is up 14.66%. I want the market to prove that the previous spike high can become a breakout level. Bullish trigger: A 4H close above $0.03669 with renewed volume. Entry: Approximately $0.0367–$0.0375 after breakout confirmation or a successful retest. SL/invalidation: Around $0.0310, below the current short-term structure. TP1: $0.0400 TP2: $0.0430 TP3: $0.0470 The bearish scenario matters because the current candle is still recovering from a sharp rejection. If GRT loses the $0.0290–$0.0300 region, the breakout structure would become considerably weaker. Bearish trigger: A decisive 4H close below approximately $0.0290. Bearish invalidation: Reclaiming and holding above $0.03669. I wouldn't force an R:R calculation before the breakout/retest develops because execution around the $0.03669 resistance will determine the actual risk. My thesis: GRT has shifted from a slow accumulation structure into a high-volume expansion, but the real confirmation is still ahead. The $0.03669 spike high is the market's test. A volume-backed break above it would confirm that buyers are willing to accept higher prices; failure followed by a loss of $0.029–$0.030 would suggest the spike was a temporary liquidity event rather than the beginning of a sustained trend. $GRTUSDT #ByXIMPACT
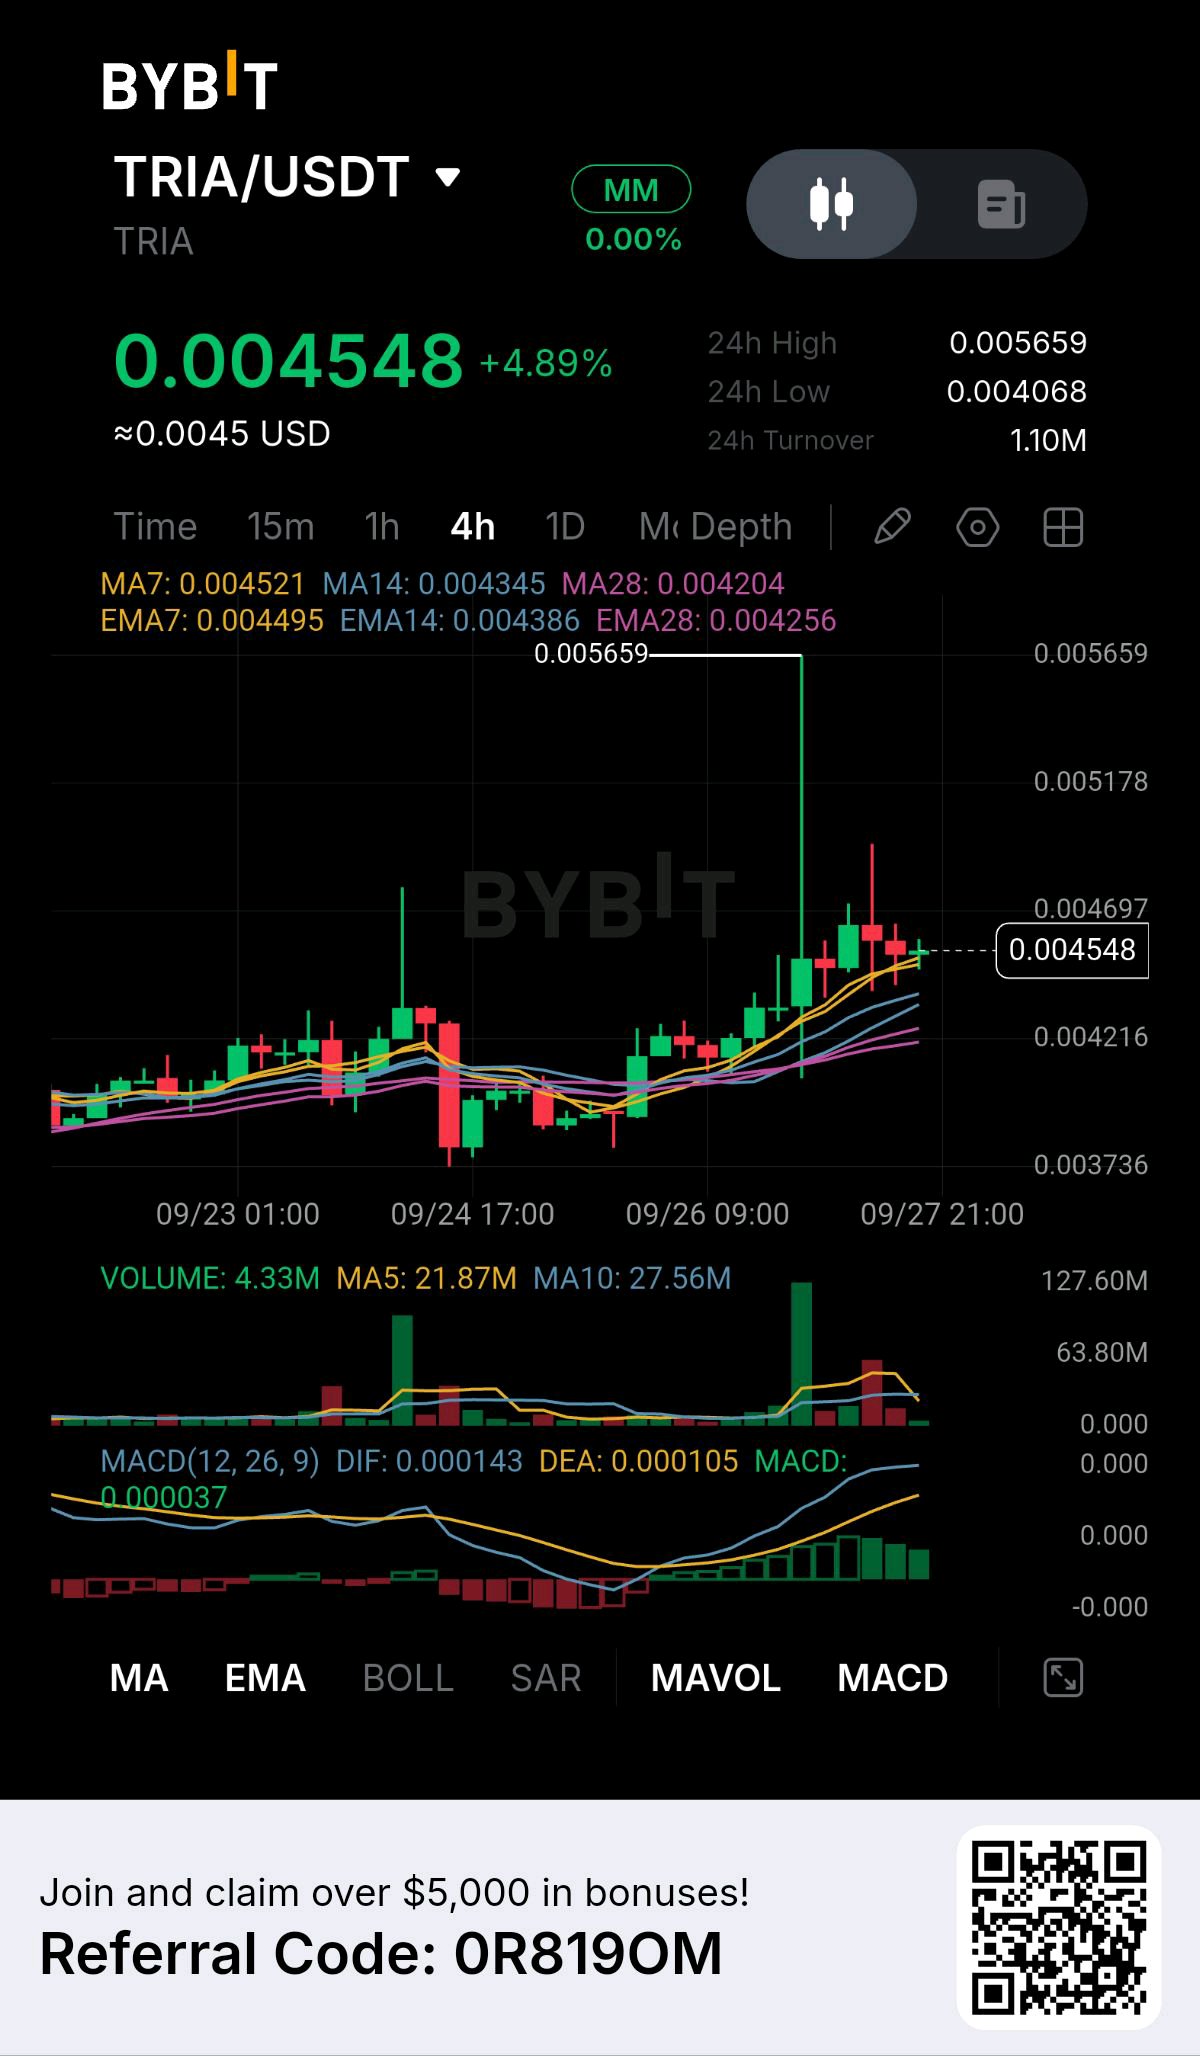
TRIA is sitting in an interesting middle ground: the breakout already happened, but price has not yet lost the structure that created it. What caught my attention is the combination of a large volume expansion, a sharp move toward $0.005659, and then relatively tight consolidation around $0.0045. From the chart, TRIA is trading at $0.004548, up 4.89%, with a visible 24H high of $0.005659, low of $0.004068, and 24H turnover of approximately $1.10M. The 4H chart shows TRIA spending most of the earlier period around $0.0037–$0.0042 before the structure shifted higher. Price then broke through the previous range and pushed sharply toward $0.005659. Instead of immediately giving back the entire move, it has consolidated around the $0.0045–$0.0047 area. That distinction matters. The moving averages are now stacked beneath price. MA7 is $0.004521, MA14 $0.004345, and MA28 $0.004204. The EMA structure is similar: EMA7 $0.004495, EMA14 $0.004386, and EMA28 $0.004256. Current price is therefore sitting slightly above the short-term averages while remaining comfortably above the longer ones. The volume profile gives me the strongest evidence. The displayed volume is 4.33M, while MA5 is around 21.87M and MA10 around 27.56M. The chart clearly shows a very large volume spike during the breakout, followed by declining activity during the current consolidation. Since the current candle may not be complete, I wouldn't treat 4.33M as the final reading. For me, that creates a specific question: was the huge volume the beginning of sustained accumulation, or was it simply breakout/liquidity activity that has now faded? MACD currently favors the first interpretation, but only cautiously. DIF is 0.000143, DEA 0.000105, and MACD around 0.000037. The histogram remains positive, although the latest bars are smaller than the earlier expansion. Momentum is still positive, but acceleration is cooling. My read is that TRIA has maintained its breakout structure, but I don't want to chase directly under $0.004697–$0.005659 resistance. I want confirmation that buyers can regain the upper boundary. Bullish trigger: A 4H close above $0.004697, followed by a successful retest. Entry: Approximately $0.00470–$0.00480 after confirmation. SL/invalidation: Around $0.00438, below the current EMA14/MA14 area. TP1: $0.00520 TP2: $0.00566 TP3: $0.00620 The major obstacle is clearly $0.005659, the visible recent high. For the bearish setup, I would watch the $0.00420–$0.00425 region. Losing that zone would mean price has fallen back below the MA28/EMA28 structure and would weaken the breakout thesis considerably. Bearish trigger: A decisive 4H close below $0.00420 with increasing volume. Bearish invalidation: Reclaiming and holding above $0.00470. I wouldn't force an R:R calculation because the cleanest entry depends on whether TRIA confirms above $0.004697 or instead gives a deeper retest. My thesis: TRIA's story right now is breakout followed by absorption, not simply a one-candle pump. The massive volume expansion created the move, while the subsequent consolidation has so far held above the broader moving-average structure. The next confirmation is $0.004697; reclaiming it opens the path back toward $0.005659, while losing $0.00420 would tell me the breakout is losing its structural foundation. $TRIAUSDT #ByXIMPACT