CryptoPatel
Daily Updates
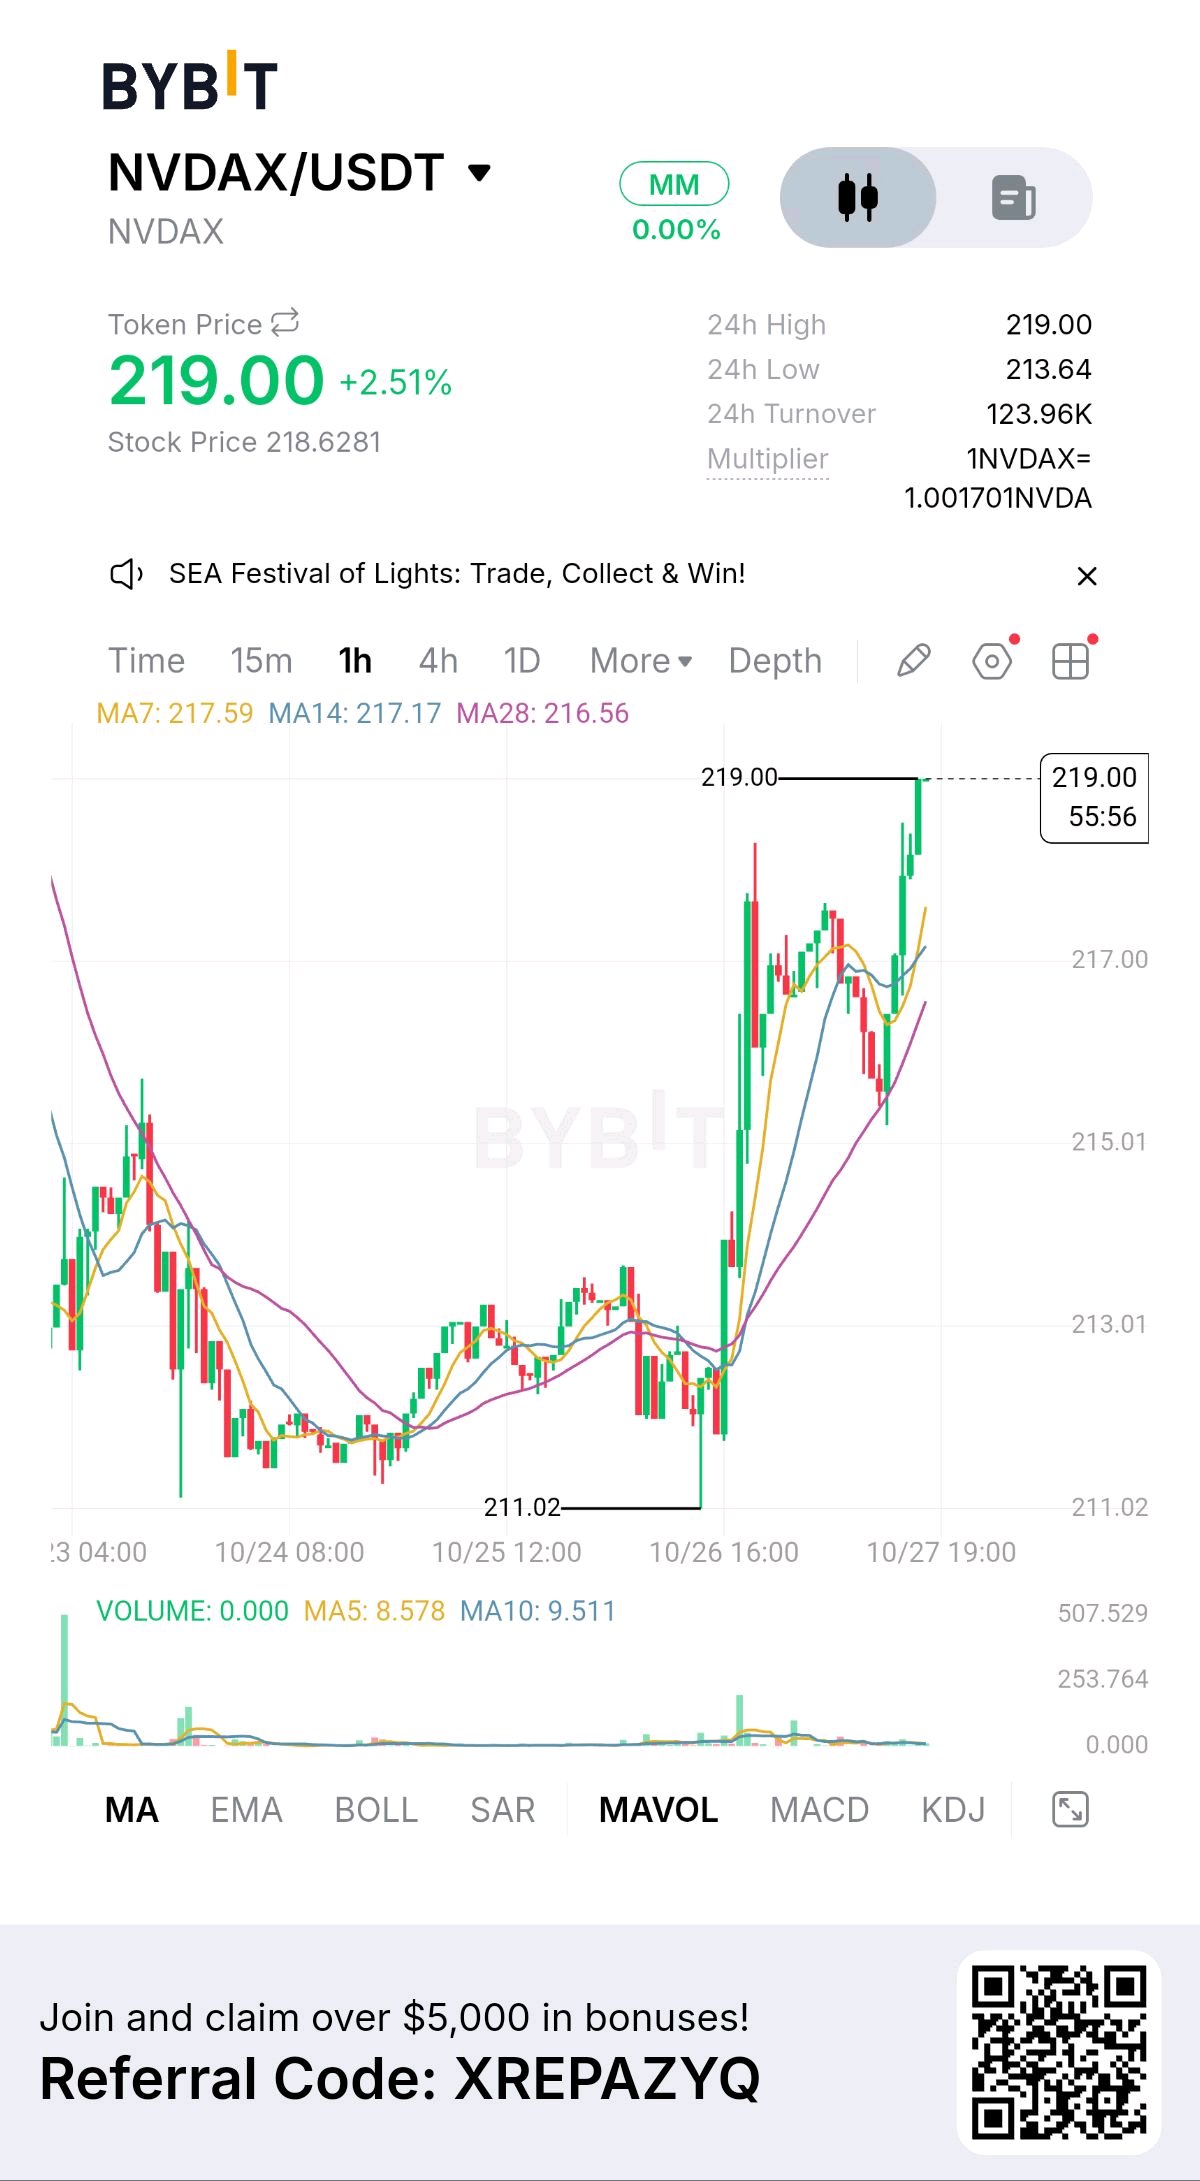
NVDAx is trading at $219, but the most interesting detail is that its token price is almost identical to the underlying NVIDIA stock price shown on Bybit. That makes this chart different from a typical altcoin breakout: the key question is not only whether buyers can push price higher, but whether the token continues to track the stock closely while crypto-market liquidity adds its own volatility. The chart shows NVDAx at $219.00, up 2.51%, with a 24-hour high of $219.00, a low of $213.64, and turnover of $123.96K. The displayed stock price is $218.6281, and Bybit shows a multiplier of 1 NVDAx = 1.001701 NVDA. These figures suggest a stock-linked product, not direct ownership of NVIDIA shares. I would verify the product's precise tracking and redemption terms before treating its price as equivalent to holding the underlying stock. The one-hour chart shows a clear shift from consolidation near $211–$213 to a sharp move above $217. Price is now at $219, above MA7 at $217.59, MA14 at $217.17, and MA28 at $216.56. All three moving averages are aligned below price, supporting the short-term bullish structure. But the latest candles are pressing against the displayed high of $219, so chasing the breakout without a retest could leave little room for error. The underlying business gives the trade a different dimension. NVIDIA reported $96.2 billion in fiscal Q2 2027 revenue, up 106% year over year, including $89 billion from its Data Center business. Its outlook projected approximately $108 billion in Q3 revenue. Those figures support the fundamental growth story, but the stock can still fall if investors decide expectations have become too aggressive. For a conditional bullish setup, I would watch $217–$218 for a pullback and hold. A confirmed bounce from that zone could offer a possible entry around $218, a stop near $216.50, and a target around $222, giving roughly 2.7:1 reward-to-risk before fees. A sustained break above $219 would strengthen the case, but I would prefer confirmation over buying a spike. If price loses $216.50, the setup weakens; $213.64 is the visible 24-hour low and a deeper support reference. There is also an important distinction between NVDA shares and NVDAX. Bybit describes xStocks as tokenized stock exposure backed by the corresponding underlying shares, with issuance and redemption handled by the issuer. Trading access, custody, liquidity, and market hours can differ from a conventional brokerage account. The token’s price may also diverge temporarily from the stock during periods of thin liquidity. My thesis is that NVDAX offers exposure to NVIDIA’s growth story, but the chart is approaching a decision point where confirmation matters more than enthusiasm. I would watch whether $217–$218 becomes support, whether the underlying stock sustains its momentum, and whether token liquidity remains healthy. A clean hold above resistance would support continuation; a failed breakout would remind me that even a strong company can produce a weak entry. $NVDAXUSDT #IMPACTbyTrade
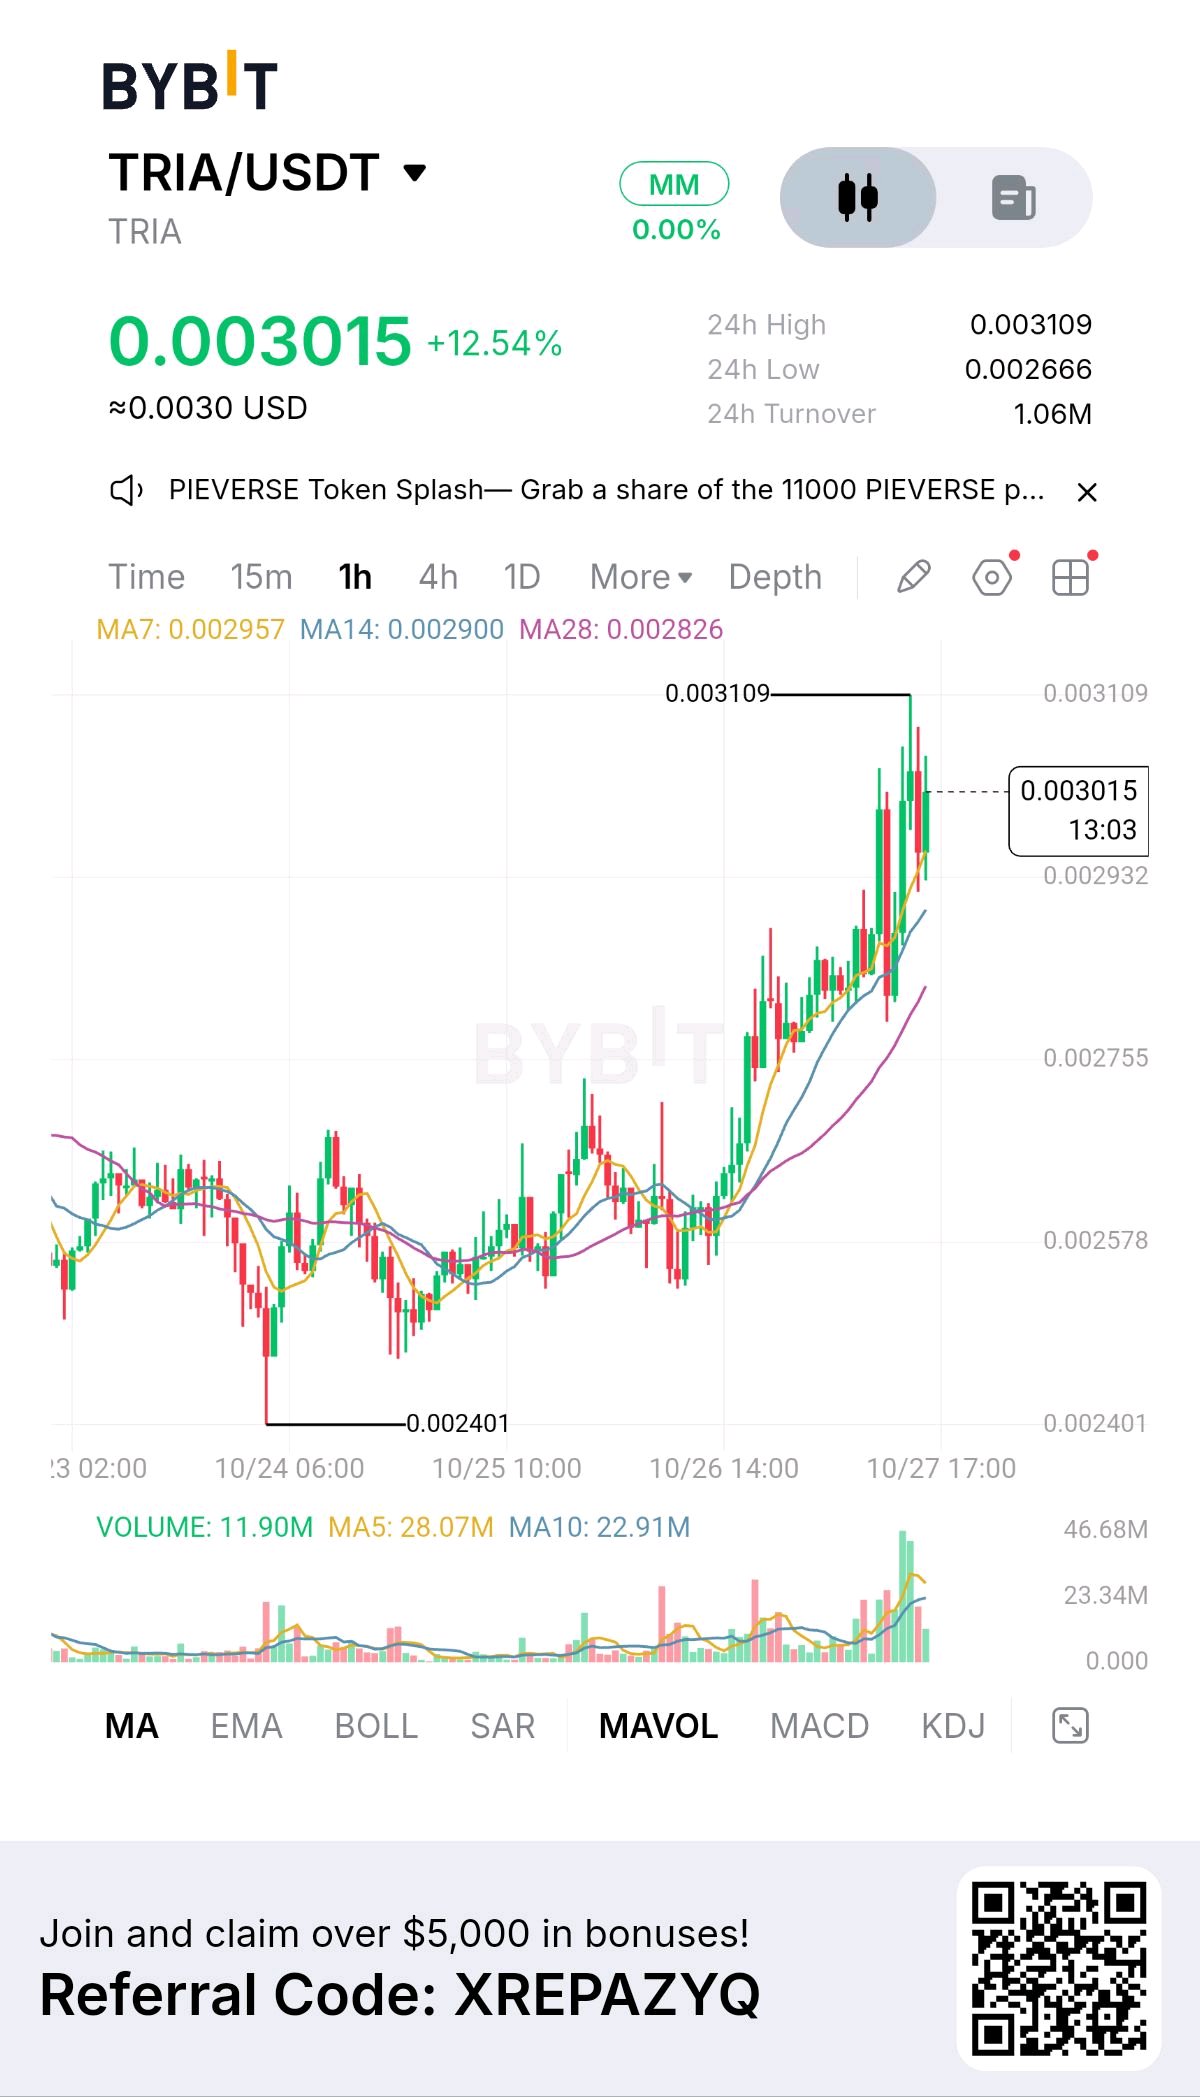
TRIA is up 12.54%, but what interests me most is that the rally is approaching resistance after spending days moving sideways. The move is no longer just about escaping a quiet range; buyers now need to prove they can hold the breakout without giving back the entire advance. On the Bybit screenshot, TRIA trades at $0.003015, with a 24-hour high of $0.003109, a low of $0.002666, and turnover of 1.06M. The one-hour chart shows price climbing above its earlier consolidation, supported by expanding volume. MA7 at $0.002957, MA14 at $0.002900, and MA28 at $0.002826 are all below the current price. That alignment favors buyers, although the nearby $0.003109 high could attract profit-taking. My key observation is the difference between improving price action and the token’s supply situation. Tria is building a self-custodial financial platform spanning crypto spending, trading, and other financial services. Real usage could strengthen its long-term case, but platform adoption does not automatically translate into demand for TRIA itself. DefiLlama reported approximately $95,910 in gross protocol revenue for Q3 2026 through its available reporting period, compared with $619,000 in Q2. The quarter’s figures may be incomplete, but revenue growth deserves monitoring rather than assuming adoption guarantees rising token value. Tokenomics are equally important. Tria’s August update accelerated 336.9 million community tokens into the second half of 2026 while extending team and investor unlocks until February 2028. That reduces near-term insider unlock pressure but brings community distributions forward. More tokens entering circulation can challenge a rally if demand fails to absorb them. Technically, I would watch $0.00293–$0.00296 as the first pullback zone. If it holds, a retest of $0.003109 becomes plausible. A convincing breakout could open the way toward $0.00320, although that remains a conditional target, not confirmed resistance. For a potential long, I would prefer a successful retest around $0.00296, a stop near $0.00289, and a target at $0.003109, offering roughly 2:1 reward-to-risk before fees. Losing $0.00290 would weaken that setup; a break below $0.002826 would undermine the broader short-term bullish structure. The bearish alternative is a rejection at $0.003109 followed by a loss of $0.00290. In that case, I would wait for a failed reclaim rather than short into support blindly. TRIA deserves attention because price momentum is improving while supply distribution and revenue trends remain important unanswered questions. My next confirmation would be a breakout supported by sustained volume, alongside evidence that platform usage and revenue are strengthening. If price rises but those fundamentals fail to follow, I would be more cautious about treating the rally as sustainable. $TRIAUSDT #IMPACTbyTrade #ByXIMPACT
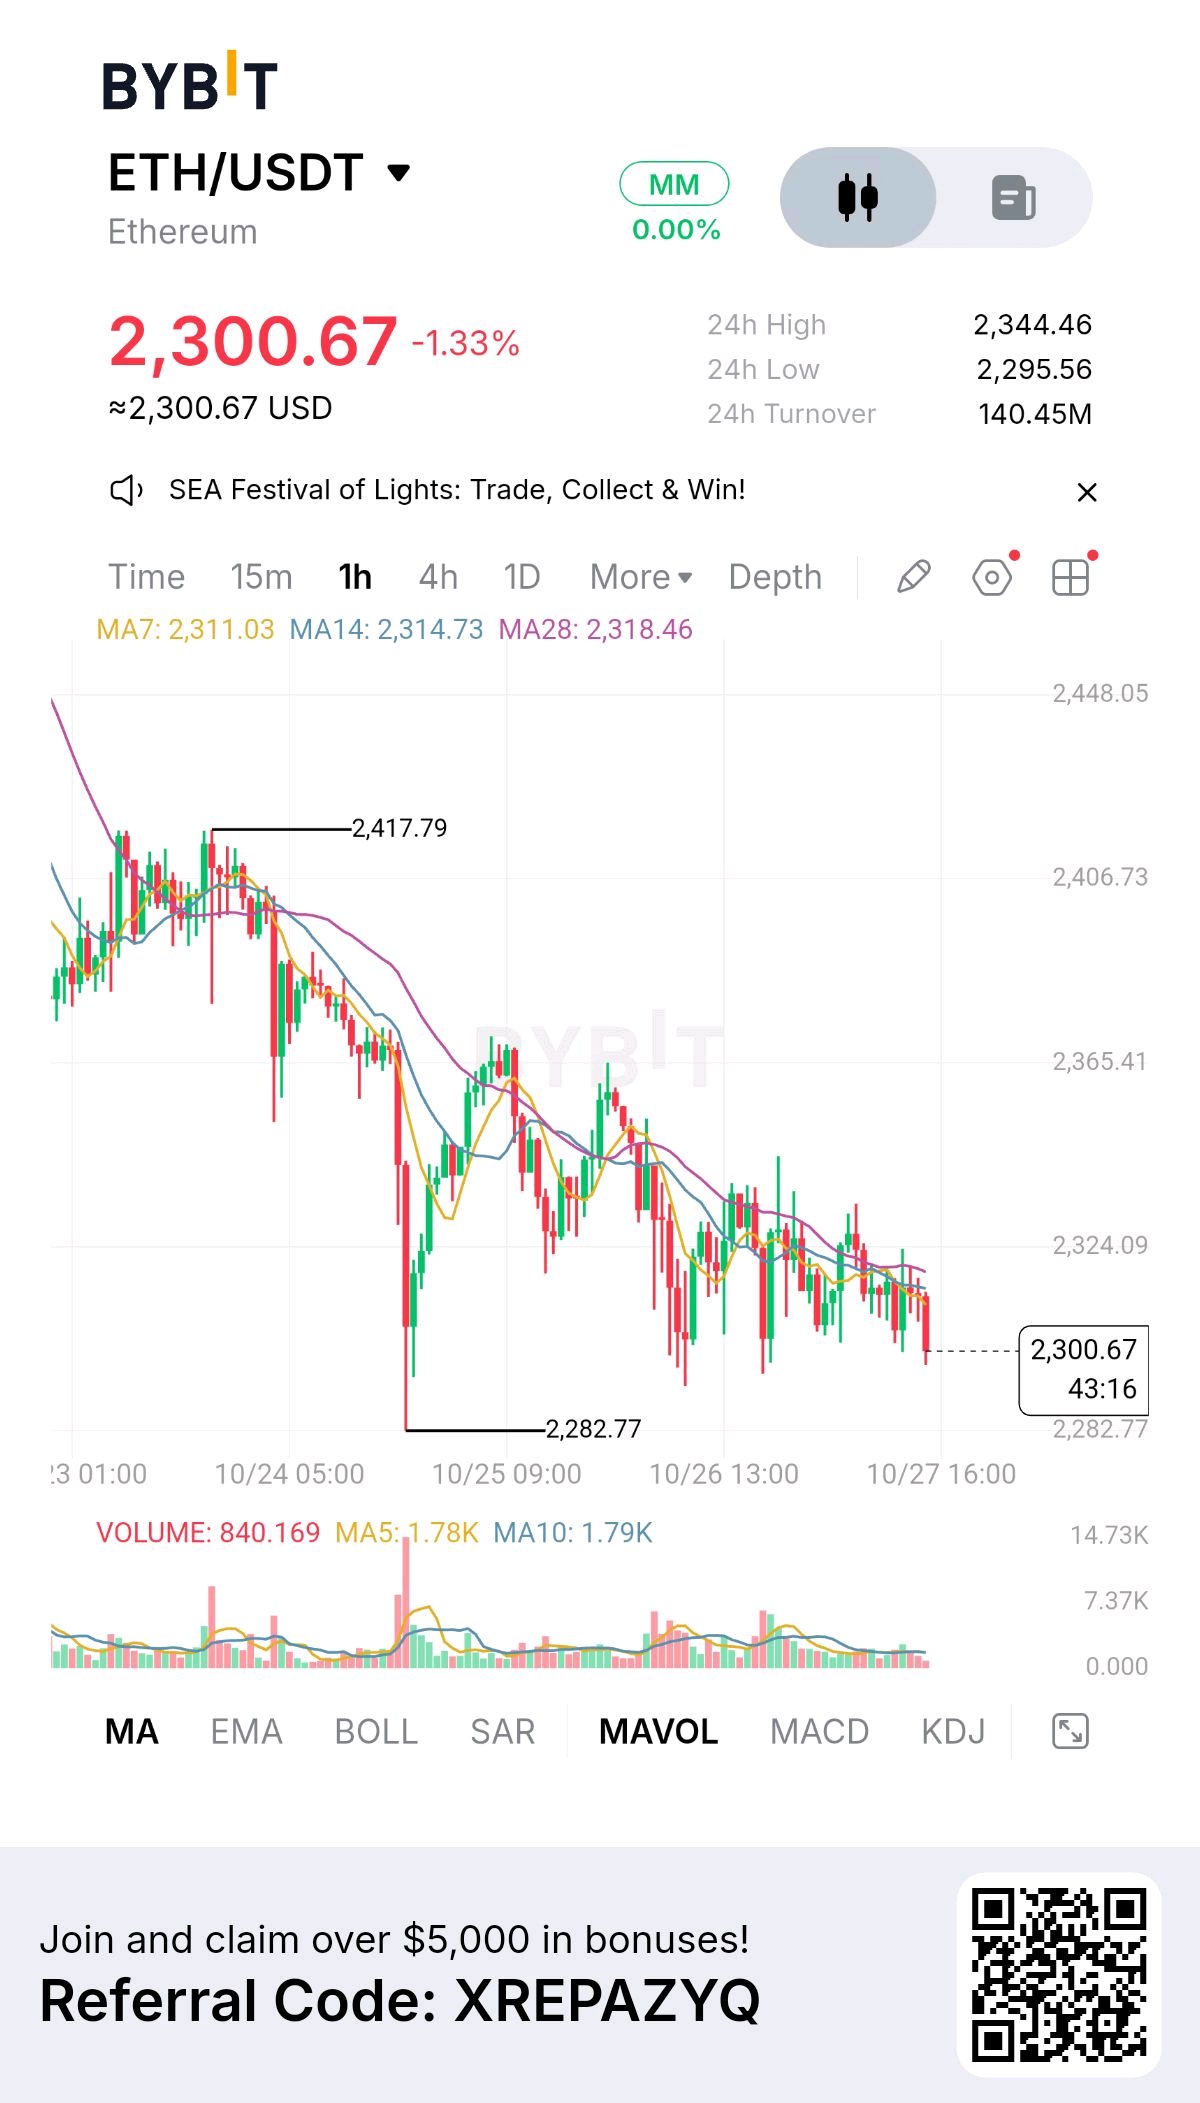
Ethereum is sitting almost exactly on a level that could decide its next short-term move, yet the chart shows very little evidence that buyers have regained control. That is the contradiction I’m watching on ETH/USDT: price is approaching $2,300, a psychologically important level, while repeated rebounds are producing lower highs instead of a convincing recovery. A support test can create an opportunity, but it can also become the point where an already weak trend accelerates. The Bybit screenshot shows ETH at $2,300.67, down 1.33%, with a 24-hour high of $2,344.46, a low of $2,295.56, and turnover of 140.45M. On the one-hour chart, ETH has declined from the marked $2,417.79 high, with several unsuccessful recovery attempts along the way. The previous swing low near $2,282.77 is the more important structural reference below current price. The market is now compressed between nearby support and descending resistance, leaving little room for indecision before the next meaningful move. The part I find most important is that ETH is approaching support while the broader flow picture remains uncomfortable. According to CoinMarketCap's October 26 snapshot, Ethereum's market capitalization was approximately $283.5 billion, with circulating supply near 122.16 million ETH. CoinGecko's current market data also places ETH's derivatives open interest in the tens of billions of dollars, meaning leveraged positioning can amplify moves around important technical levels. These are market-wide figures, not Bybit-specific readings, and they should not be confused with the turnover displayed in the screenshot. The institutional-flow picture adds another layer. Reported U.S. spot ETH ETF flows were negative across much of October, including approximately $110.5 million in net outflows on October 22. The October 26 data was still incomplete when reported, so I would not treat it as a finalized daily total. Persistent outflows can indicate weaker marginal demand from that channel, but they do not prove that every institutional investor is selling or explain the entire price decline. Ethereum's underlying network activity also deserves attention. DefiLlama reported roughly $48.3 billion in Ethereum DeFi total value locked around October 26, alongside approximately 1.54 million transactions and 382,000 active addresses in its reported daily metrics. That is meaningful ecosystem activity, even while the ETH price struggles. However, TVL is not the same as ETH investment demand, and network usage does not guarantee that the token will rise in the short term. For my trading plan, I would avoid entering simply because ETH is near $2,300. The first bullish signal would be a defense of $2,295–$2,283, followed by a reclaim of $2,315–$2,324. A stronger recovery could then target $2,344 and potentially $2,365. A conservative long would wait for a confirmed reclaim of $2,324 and a successful retest, with the stop placed beneath the retest low. I would calculate the final target and position size only after the entry structure is clear. The bearish scenario is more straightforward. If ETH breaks below $2,282.77 and fails to recover that level, the current support structure would be invalidated. I would then look for the next confirmed support on a broader timeframe rather than invent a downside target from this screenshot. A short based on a breakdown would need a defined retest and stop, because selling directly into support can leave poor reward-to-risk. What would change my view? A sustained reclaim of the moving averages, stronger spot buying, improving ETF flows, and continued network activity would make the bullish case more convincing. Conversely, repeated resistance rejections, a breakdown below the marked swing low, and continued outflows would reinforce the bearish interpretation. My conclusion is that ETH's current weakness does not erase Ethereum's economic relevance, but strong fundamentals do not protect a trade from poor timing. The $2,283–$2,300 area is where I would focus first. If buyers defend it and reclaim resistance, a recovery becomes more credible. If they fail, I would rather respect the breakdown than buy simply because the price looks cheaper. Educational analysis only not financial advice. $ETHUSDT #IMPACTbyTrade #ByXIMPACT
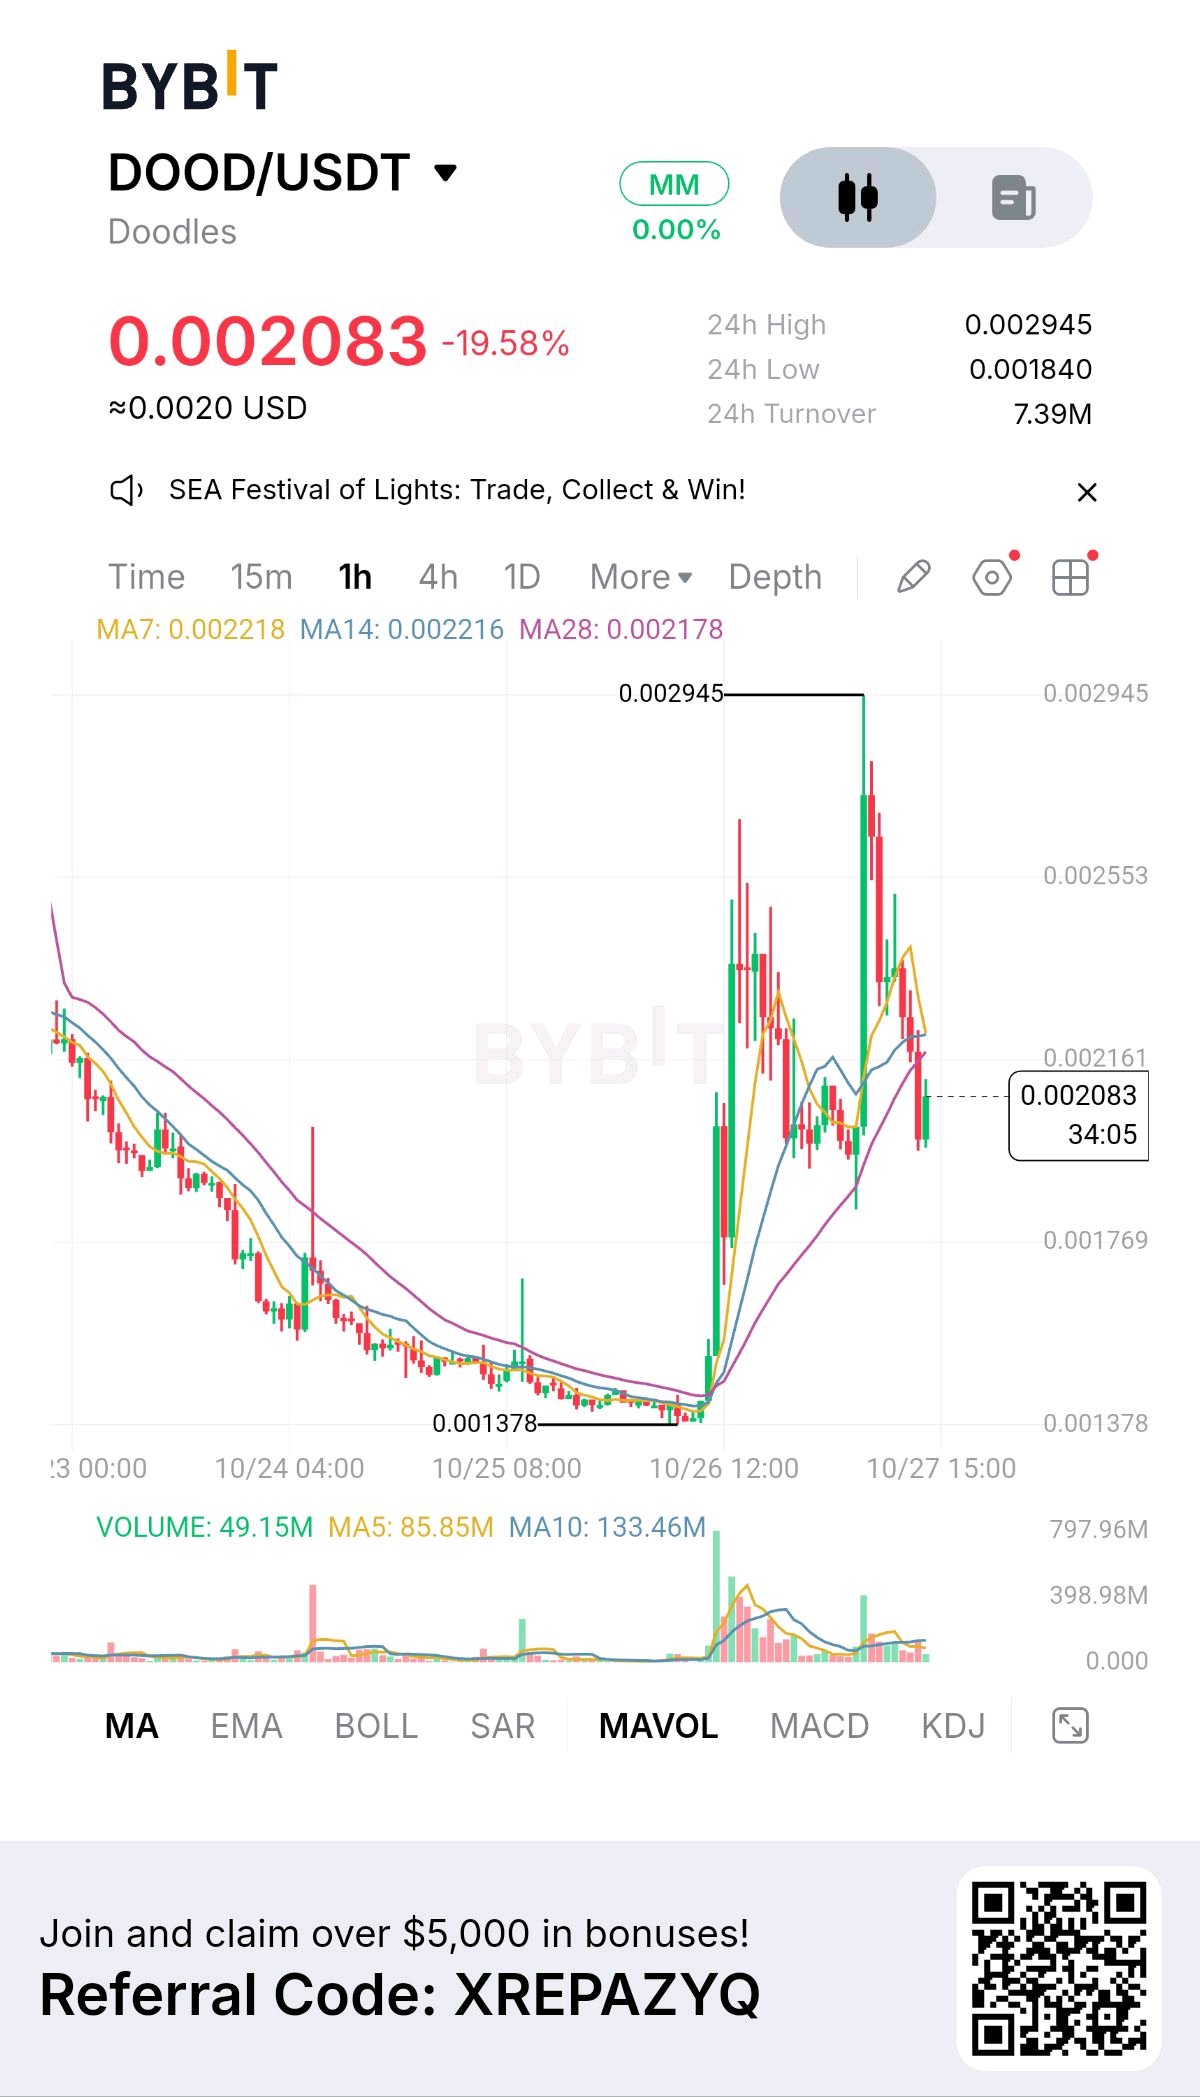
DOOD just showed why a green breakout can be more dangerous than it looks. Price surged toward $0.002945, attracted attention, and then dropped nearly 20%. What interests me is not the red candle itself, but how quickly the market gave back part of the rally. That raises a more important question: was the breakout supported by lasting demand, or did momentum traders simply run out of buyers? According to the Bybit chart , DOOD is trading at $0.002083, down 19.58%, with a 24-hour high of $0.002945, a low of $0.001840, and turnover of 7.39M. Before the surge, the chart spent a long period near $0.00138, where price action was relatively quiet. The sudden increase in volume and price suggests a major shift in trading activity, but it does not tell us whether new investors are accumulating or early holders are taking profits. The one-hour moving averages now tell a cautious story. MA7 is $0.002218, MA14 is $0.002216, and MA28 is $0.002178. Price has slipped below all three, putting the $0.00217–$0.00222 area in focus as potential resistance. If DOOD reclaims this zone and holds it during a retest, buyers could regain some control. The next hurdle would be $0.00255, followed by the recent peak at $0.002945. Until then, I would treat rebounds as unconfirmed rather than assume the rally is resuming. On the downside, $0.00200 is the first psychological level worth watching, while $0.001840 is the visible 24-hour low. A break below that low, followed by a failed recovery, would suggest that sellers remain in control. The earlier base near $0.00138 is a broader historical reference, not an immediate prediction. I would rather wait for the market to confirm a direction than guess where the decline will end. The project itself gives DOOD a different story from a purely anonymous meme token. Doodles has an established digital-collectibles and creative-IP ecosystem, but brand recognition alone cannot sustain a token valuation. The important question is whether DOOD develops recurring demand through actual ecosystem participation, utility, and community activity. Speculative attention can move a price quickly; lasting demand needs a reason to remain after the excitement fades. Supply is another factor worth monitoring. Public token trackers list a maximum supply of 10 billion DOOD, with approximately 7.8 billion circulating. Scheduled token releases may create additional supply, although an unlock does not automatically mean selling. I would want to verify the latest unlock schedule and observe market behavior around release dates before drawing a firm conclusion. My bullish scenario would begin with a reclaim of $0.00222 and a successful retest. A possible entry near $0.00223, stop at $0.00214, and target at $0.00250 offers roughly 3:1 reward-to-risk before fees. This is conditional on confirmation, not a recommendation to chase the current price. If DOOD loses $0.001840 and cannot recover it, I would become more cautious and wait for a new support structure instead of forcing a long trade. For me, DOOD is now a test of conviction. Can buyers defend the post-breakout structure, absorb selling, and rebuild momentum without another extreme spike? The answer will depend on the next reaction around $0.00200 and whether price can reclaim its moving averages with convincing volume. I would rather miss the first part of a recovery than confuse a temporary bounce with a confirmed reversal. $DOODUSDT #IMPACTbyTrade
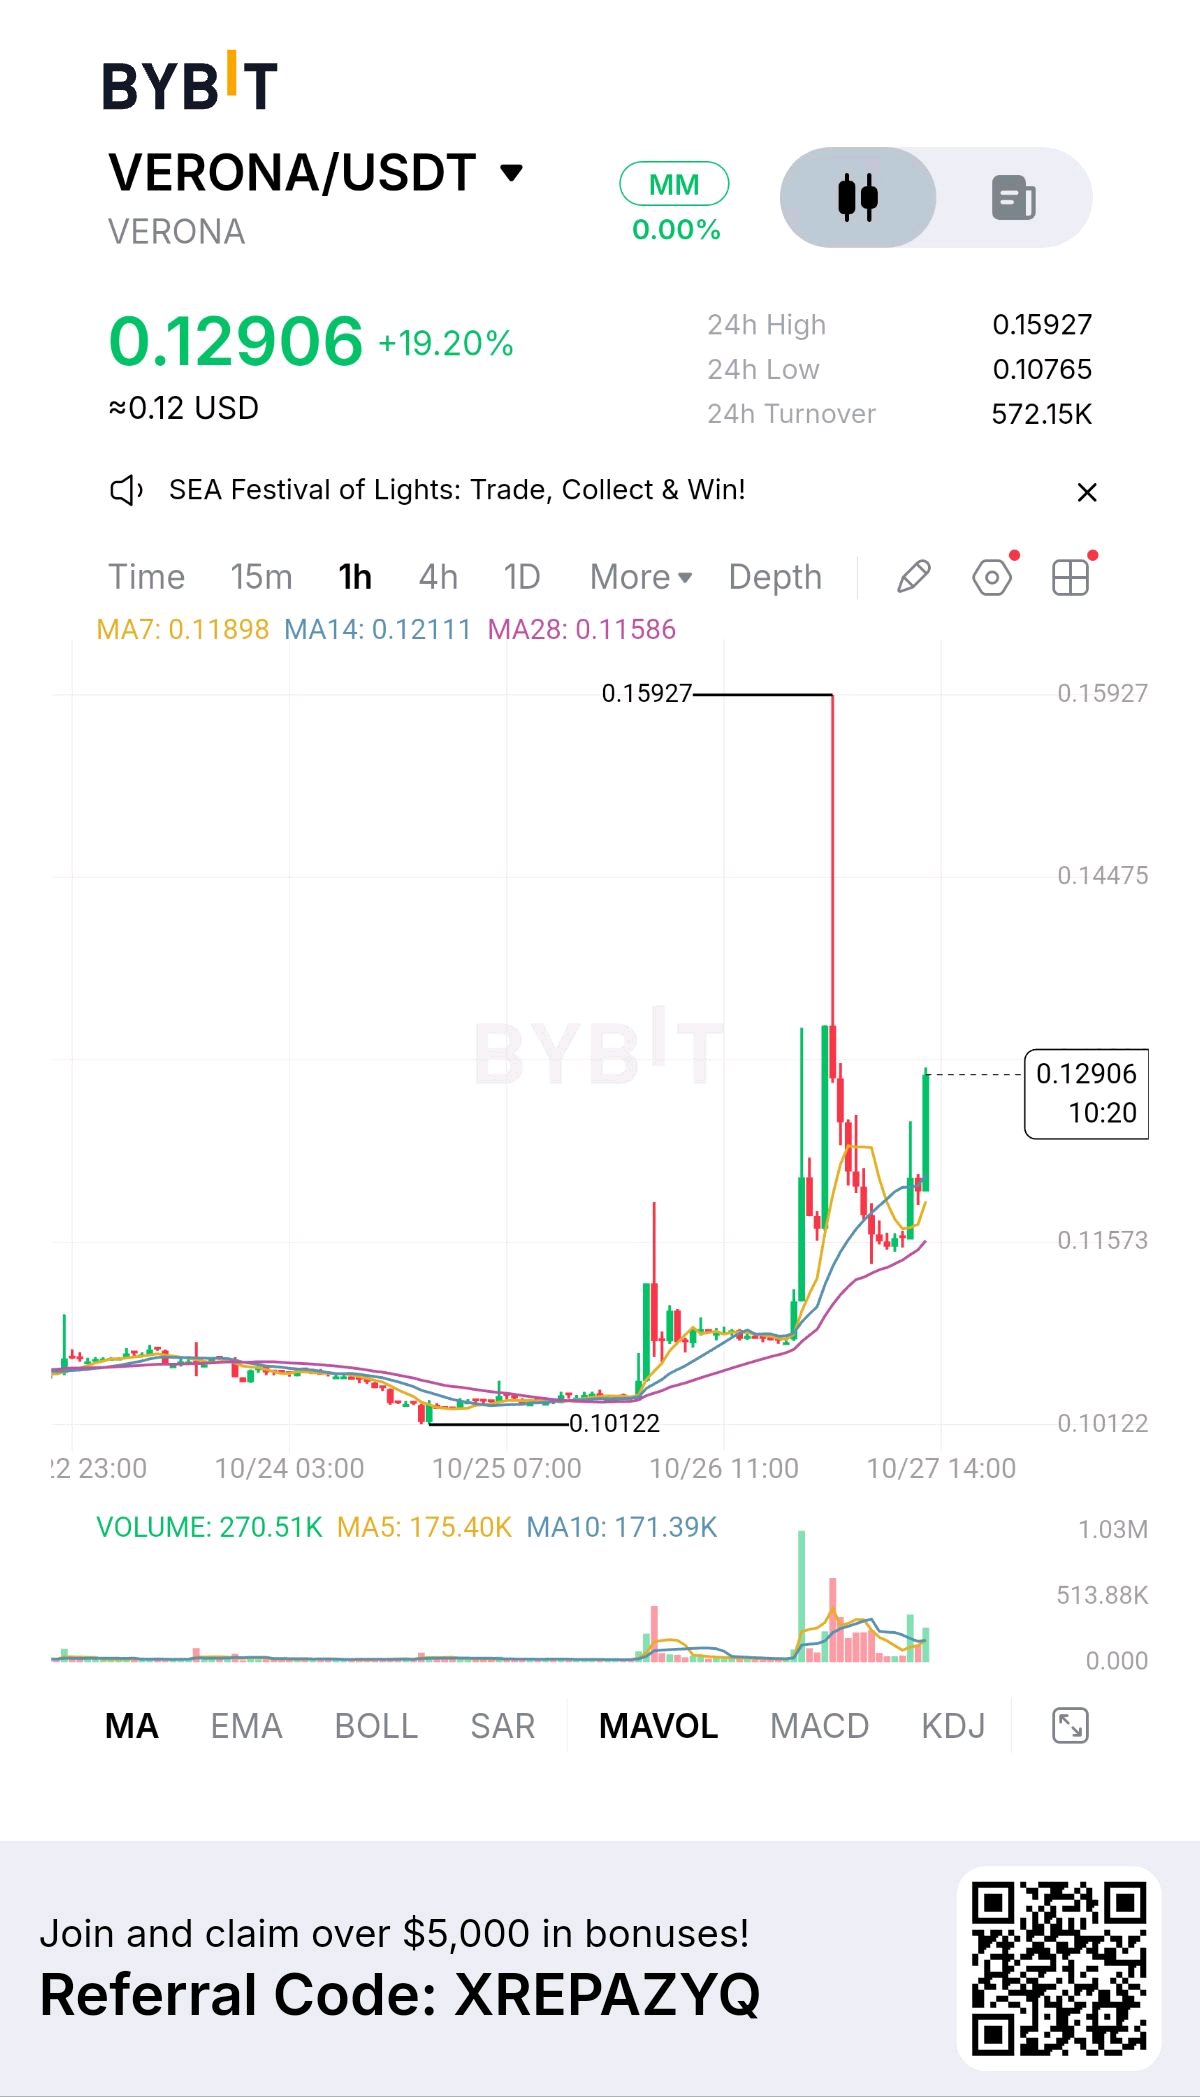
VERONA/USDT is up 19.20%, but the most important detail is not the green percentage it is the long wick reaching $0.15927 before price pulled back and started recovering. That tells me this market has already experienced a sharp rejection, so chasing the latest candle could be very different from trading a confirmed breakout. The real question is whether buyers can turn this sudden burst of attention into a sustainable price structure. According to the Bybit screenshot, VERONA is trading at $0.12906, with a 24-hour high of $0.15927, a low of $0.10765, and turnover of 572.15K. The one-hour chart shows a prolonged quiet period around $0.101–$0.103, followed by a sudden expansion in price and volume. That change in behavior is significant, but it does not establish why the move happened or whether the demand will persist. The moving averages support this interpretation. MA7 is at $0.11898, MA14 at $0.12111, and MA28 at $0.11586. Price remains above all three, which favors the short-term bullish structure, but the gap between price and the averages also shows how quickly the market has moved. Volume reached 270.51K on the displayed candle, compared with MA5 volume of 175.40K and MA10 volume of 171.39K. Participation has increased, although one volume spike cannot tell us whether buyers are accumulating or short-term traders are taking profits. VERONA is more than a ticker change. The project was previously known as XION and rebranded in June 2026. Its original focus was blockchain abstraction, while the current Verona positioning emphasizes verifiable data and an AI-oriented intelligence layer. That gives the project a potential use case beyond speculation, but adoption and token value capture still need evidence. Supply is an important part of the risk. Public trackers list a maximum supply of 200 million VERONA and circulating supply around 92.68 million. RootData lists an unlock of approximately 1.67 million tokens on November 5, followed by a much larger scheduled release of 15.08 million on December 5, 2026. Unlocks do not automatically mean selling, but additional supply can weigh on price if demand does not expand. For a bullish setup, I would wait for a pullback that holds $0.121–$0.123, then look for renewed buying toward $0.135 and $0.145. A more aggressive breakout above $0.135 could target $0.145, with a stop near $0.127, offering approximately 1.25:1 reward-to-risk. The previous high at $0.15927 remains the larger resistance zone. Bearishly, losing $0.1157 could expose $0.10765, while a deeper breakdown would bring the $0.10122 base back into focus. My thesis is that VERONA is experiencing a genuine expansion in trading interest, but the market has not yet proved that this attention will translate into lasting demand. I would watch whether volume remains elevated on pullbacks, whether price holds above the moving averages, and whether project adoption progresses alongside its tokenomics schedule. The next move matters because it will help distinguish sustained demand from a short-lived momentum spike. $VERONAUSDT #IMPACTbyTrade
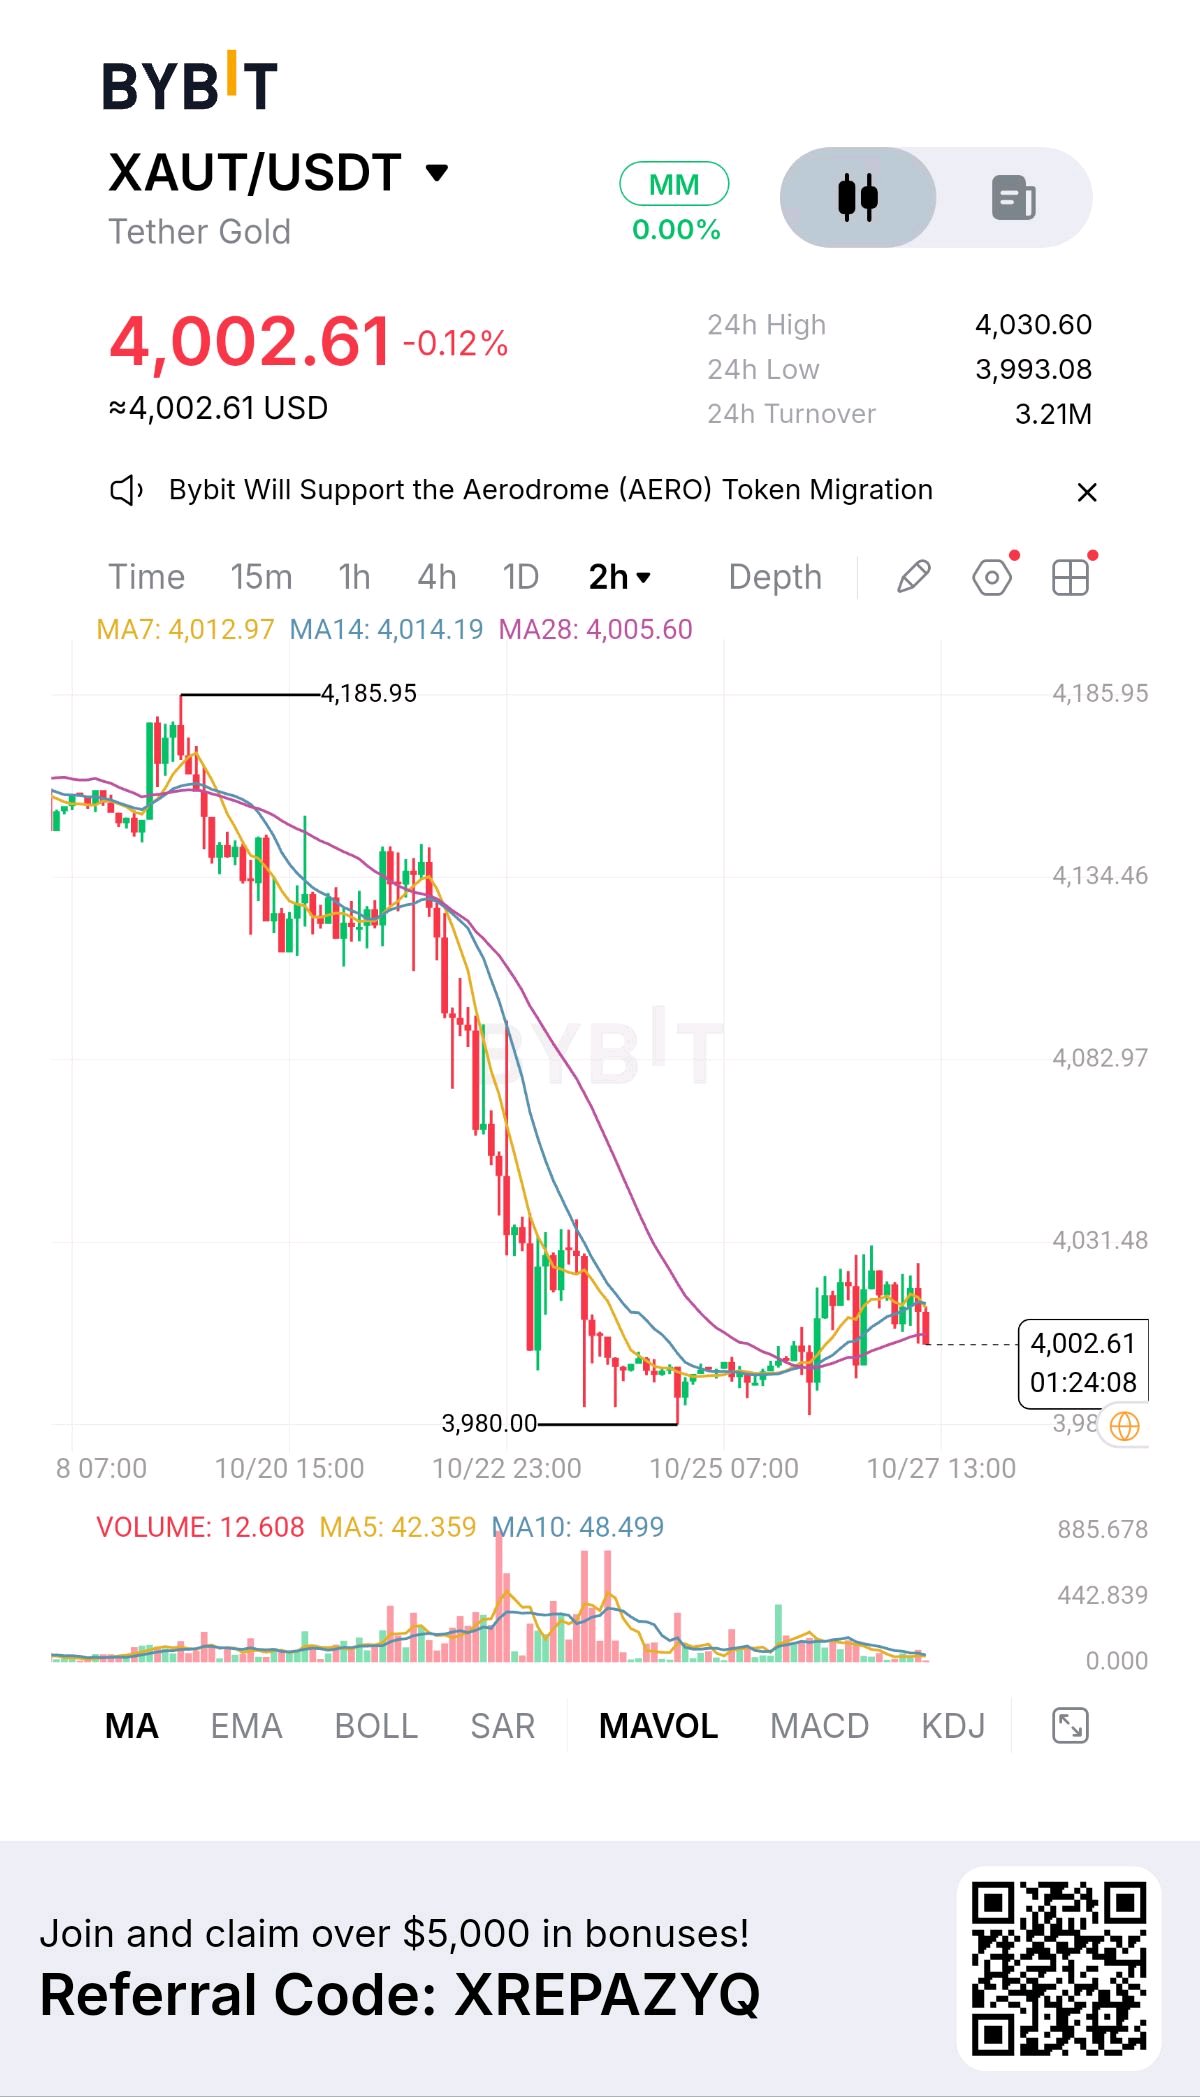
The surprising thing about XAUT/USDT is that gold is hovering around $4,000 even after a sharp sell-off, but the chart still looks weaker than a traditional safe-haven narrative would suggest. I see a potential divergence between gold’s long-term role as a store of value and its short-term price behavior. On Bybit, XAUT is trading at $4,002.61, down 0.12%, with a 24-hour high of $4,030.60, a low of $3,993.08, and turnover of $3.21M. The question is whether $4,000 becomes a base for recovery or merely a temporary pause. The two-hour chart shows a steep decline from $4,185.95 to the $3,980 area, followed by sideways consolidation and a modest rebound. Price is now below MA7 at $4,012.97, MA14 at $4,014.19, and MA28 at $4,005.60. This cluster around $4,005–$4,014 is important: buyers need to reclaim it before a recovery becomes convincing. The first resistance sits near $4,030, followed by $4,083 and $4,134. Support lies around $3,993–$3,980. A clean break below that floor would weaken the stabilization thesis. The macro backdrop explains why gold is struggling despite persistent demand for safe assets. The World Gold Council reported that September gold prices fell 8.5% month over month as rising Treasury yields and a stronger dollar pressured the metal, even while gold ETFs attracted $10 billion in inflows. That divergence suggests some investors were accumulating exposure while futures positioning contracted. It does not guarantee a reversal, but it shows why price alone may not tell the whole story. XAUT also has a different economic model from speculative crypto tokens. Tether reported 707,747 fine troy ounces of physical gold reserves at the end of Q2 2026, backing XAUT on a one-to-one basis. Still, token holders must consider issuer, custody, redemption, and exchange-liquidity risks. My bullish plan would require a reclaim of $4,030 and a successful retest, with a possible entry around $4,032, a stop at $3,990, and a target near $4,134. That offers roughly 2.4:1 reward-to-risk before fees. Bearishly, a confirmed break below $3,980 followed by a failed retest would favor caution, although the screenshot alone cannot justify a reliable downside target. For me, the real signal is whether price can reclaim resistance while broader gold markets stabilize. A hold above $3,980 keeps recovery possible; a breakdown would suggest sellers remain in control. I would watch the dollar, Treasury yields, and the Fed’s next signals before committing to either direction. $XAUTUSDT #IMPACTbyTrade #MyByXTake #ByXIMPACT
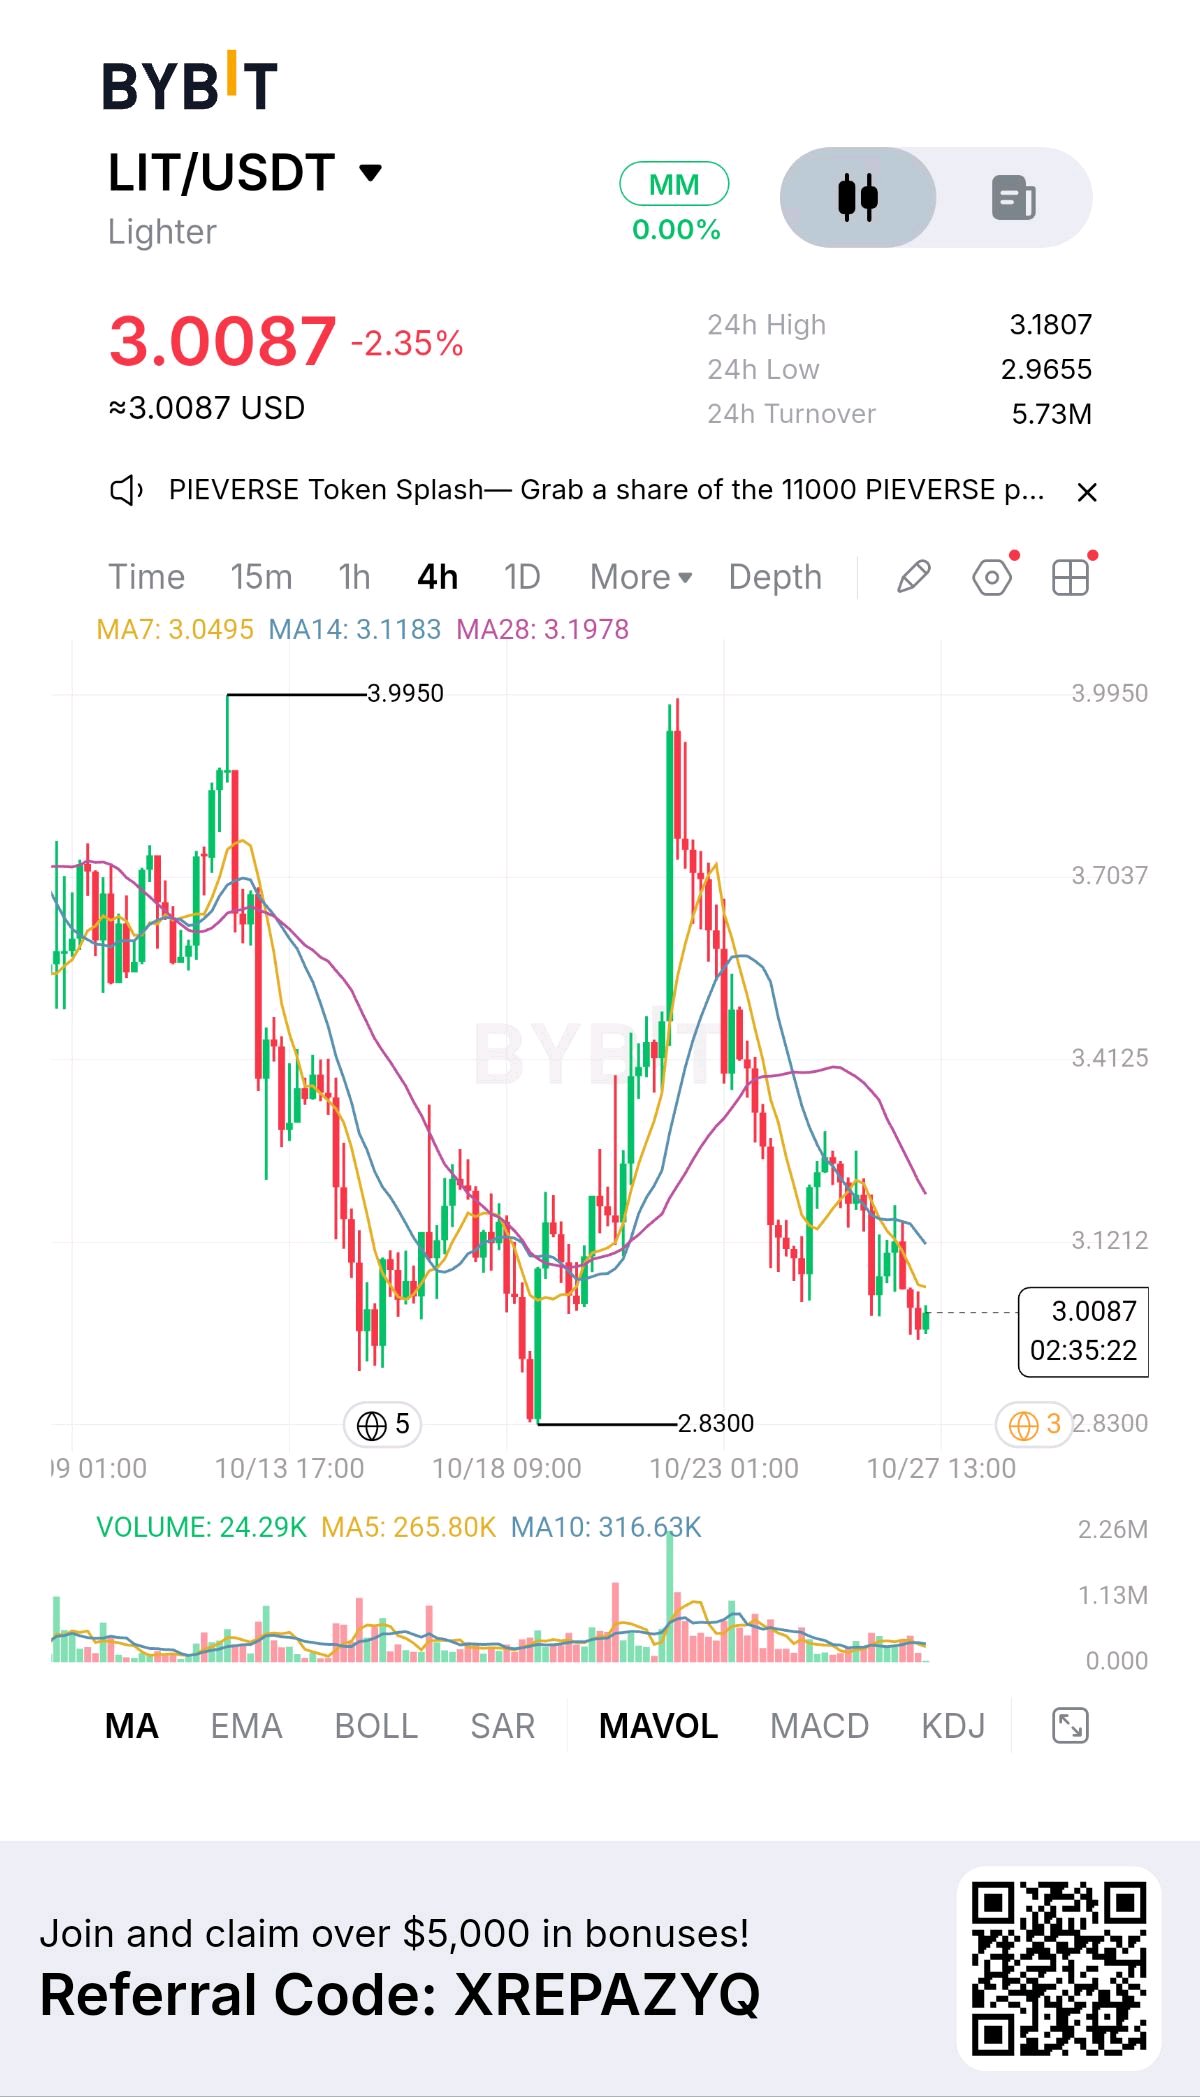
LIT/USDT is showing an interesting contradiction: price is approaching $3.00 after a sharp rejection from $3.95, but the key question is whether this decline is creating a buying opportunity or exposing a deeper weakness in market structure. I would not call this a bottom yet. What matters is how price behaves around support, because that is where buyers must prove they can absorb selling pressure rather than simply react to a falling market. According to the Bybit chart , LIT is trading at $3.0087, down 2.35%, with a 24-hour high of $3.1807, a low of $2.9655, and turnover of 5.73M. The four-hour chart shows a strong rally followed by an aggressive rejection and a series of lower highs. Price is also trading below MA7 at $3.0495, MA14 at $3.1183, and MA28 at $3.1978. This bearish moving-average alignment suggests that sellers still control the short-term trend, while any recovery must overcome several layers of resistance. The first level I am watching is the $2.9655–$3.00 area. It combines the current psychological price level with the displayed 24-hour low, making it an important near-term test. If buyers defend this zone and price moves back above $3.05, the first sign of stabilization would appear. A reclaim of $3.12 would be more meaningful because it would challenge the declining short-term structure. Beyond that, $3.18–$3.20 is the next resistance region, where the recent daily trading high and the MA28 area provide reasons to expect sellers to respond. The project fundamentals make this setup more interesting than the chart alone suggests. Lighter is a decentralized trading protocol focused on perpetual futures, where long-term value depends on retaining traders, generating fees, and converting activity into sustainable economic value. DefiLlama data around October 26 showed approximately $823 million in total value locked and $4.84 million in protocol revenue over 30 days. These are encouraging signs of real usage, but they do not automatically mean LIT is undervalued. Token supply is another factor I would not ignore. LIT has a maximum supply of one billion tokens, with approximately 250 million circulating. That means only around 25% of the maximum supply is currently in circulation. DefiLlama's unlock tracker lists a scheduled weekly release for team and investors beginning December 29, 2026. Additional supply can create selling pressure if demand fails to grow alongside it, although unlocks do not necessarily mean recipients will immediately sell. For a conditional bullish trade, I would wait for price to reclaim $3.12 and hold that level on a retest. An entry around $3.12, a stop near $3.04, and a target around $3.28 would offer approximately 2:1 reward-to-risk before fees. The bearish alternative is a confirmed four-hour breakdown below $2.9655, followed by a failed reclaim, with $2.83 as the next downside reference. I would determine the short stop from the retest high rather than choose an arbitrary number. What makes LIT worth watching is the gap between protocol activity and token price performance. If usage and revenue remain resilient while price stabilizes, the market may eventually reassess its valuation. But if support breaks while supply expands, strong protocol metrics alone may not prevent further downside. My next confirmation would be a combination of price reclaiming resistance, stronger spot buying, and sustained protocol revenue not a single green candle. $LITUSDT #IMPACTbyTrade
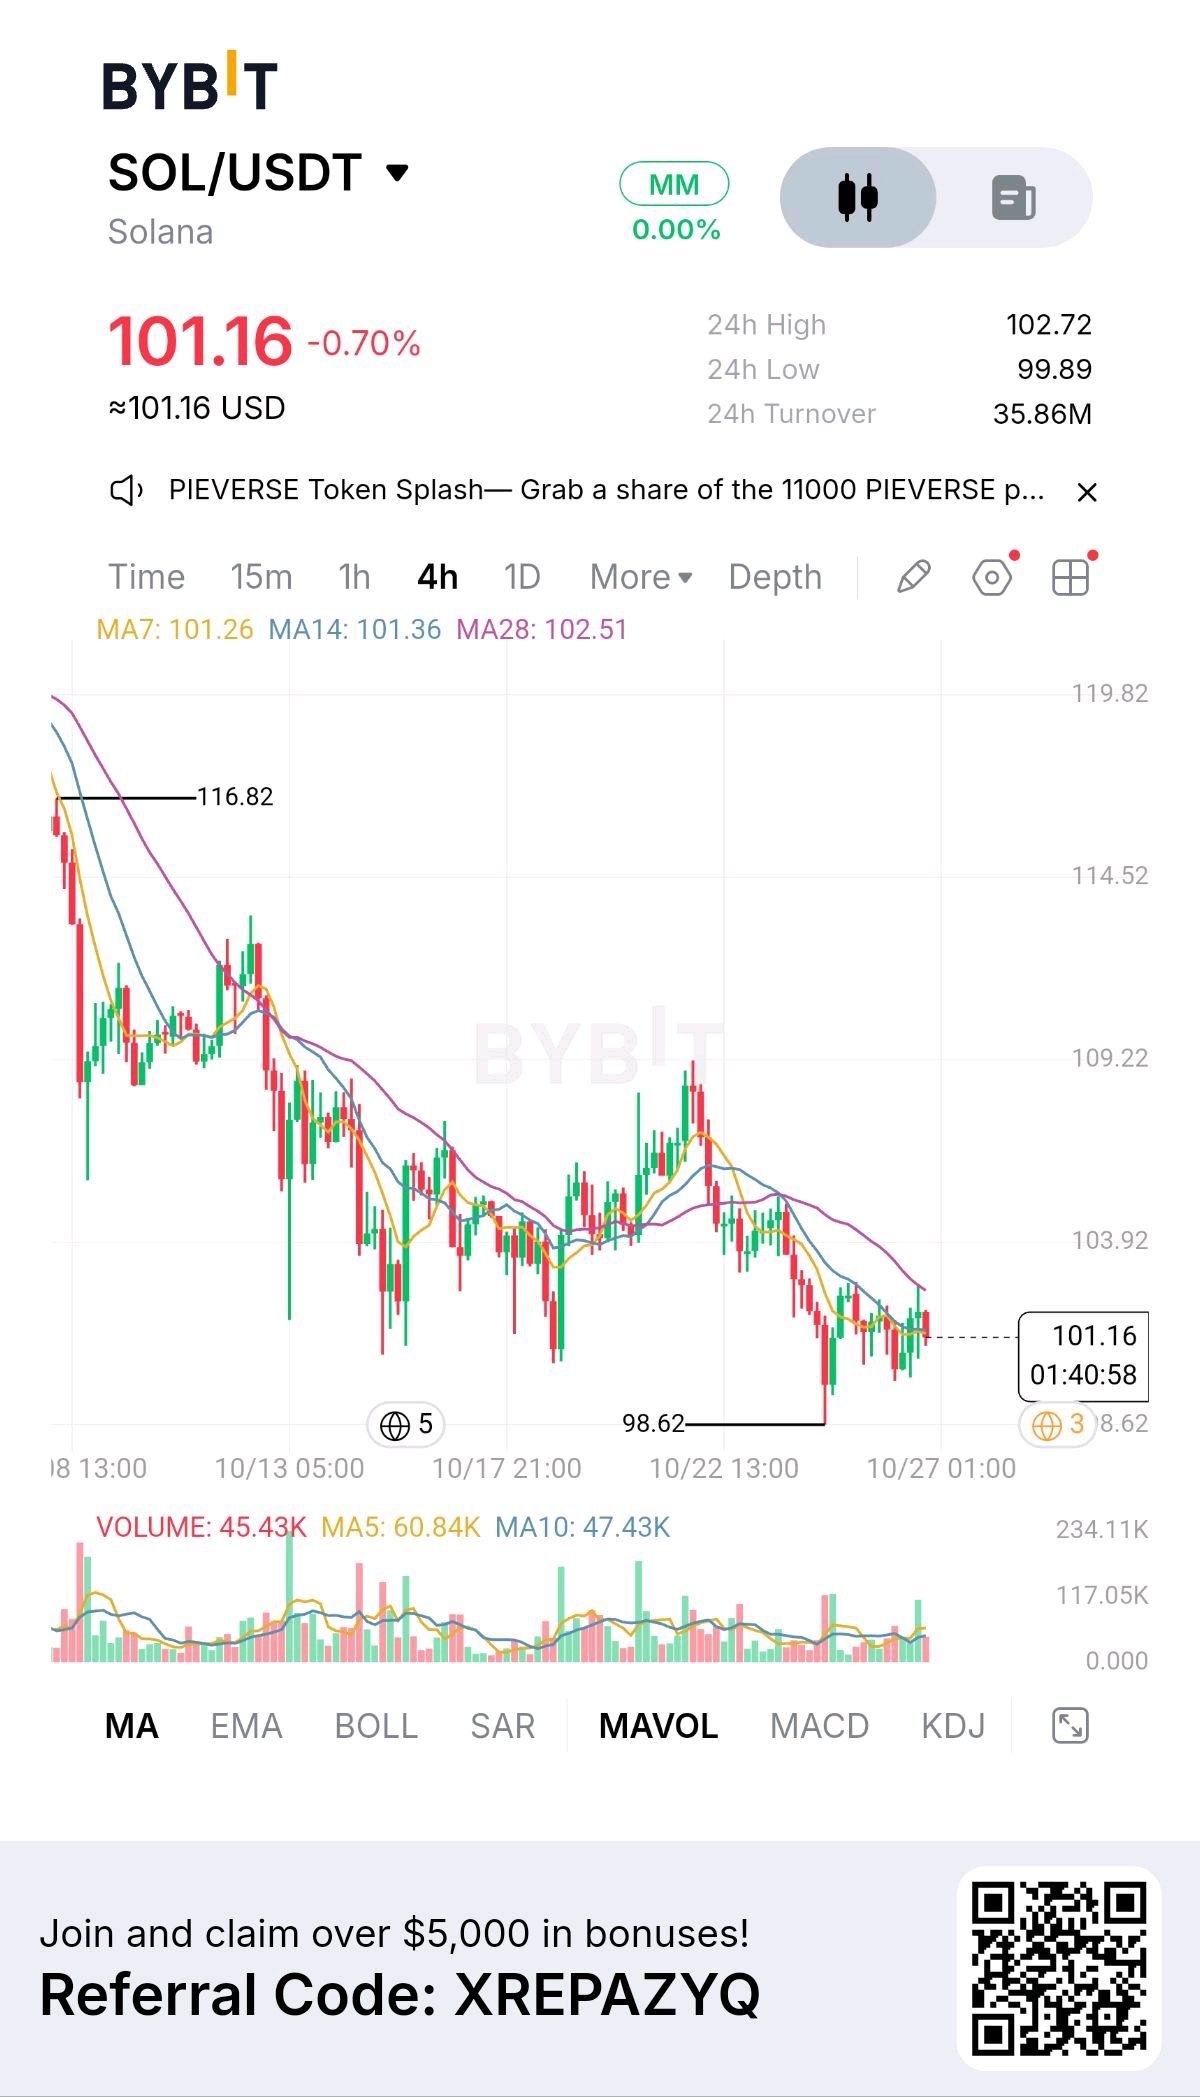
I think the interesting question with Solana right now is not whether the network is active, but whether that activity is strong enough to justify renewed demand for SOL. That distinction matters because a blockchain can process millions of transactions while its token continues to struggle. Looking at this chart, I see a market that has not yet found a convincing reason to reverse its downward structure. SOL is trading around $101.16 in my Bybit screenshot, down 0.70% over 24 hours. The four-hour chart shows a decline from approximately $116.82, with a recent low near $98.62. What caught my attention is that price is hovering around the short-term moving averages while remaining below the MA28 near $102.51. Buyers are attempting to stabilize the market, but a small bounce is not the same thing as a trend reversal. The fundamental picture makes this more interesting. DeFiLlama reported roughly $5.71 billion in Solana DeFi TVL on October 24, alongside approximately 2.56 million active addresses and 108 million transactions over 24 hours. Yet weekly DEX trading volume was down around 5.95%, while perpetuals volume had fallen approximately 31.94%. These figures suggest substantial network activity, but also potentially cooling trading demand. Here is the gap I am watching: investors can interpret high transaction counts and millions of active addresses as evidence that SOL should appreciate, but those metrics alone do not prove stronger economic value is flowing to token holders. SOL has real utility for transaction fees, staking and collateral. However, the relationship between ecosystem activity, fees paid, token burns and sustained buying pressure is what ultimately deserves attention. For example, DeFiLlama's October 24 snapshot showed approximately $560,000 in daily chain fees and $42,000 in chain revenue. Those figures should not be confused with the much larger revenue generated by applications operating on Solana. The distinction matters because ecosystem success and value captured directly by SOL are not identical. If activity declines or fails to translate into durable demand for the token, a large user base alone may not protect the price. Technically, I am watching three areas. Support sits around $99.89–$98.62, based on the screenshot's recent trading range and marked low. Resistance begins around $102.50–$103.92, where the longer moving average and a previous chart level converge. A sustained four-hour close above that resistance zone, followed by a successful retest, would strengthen the recovery case. A decisive break below $98.62 would weaken the support thesis and expose SOL to further downside. My approach is WAIT until the chart provides confirmation. I would not chase a bounce without evidence of stronger buying volume, and I would not short directly into support without a confirmed breakdown. Solana's network activity is a reason to investigate further, not automatic proof that its token is undervalued. My thesis is simple: the market may be overlooking Solana's continuing network usage, but bulls still need to demonstrate that this activity translates into sustainable token demand. If fees, application economics and buying pressure improve while SOL remains depressed, the mispricing argument becomes stronger. If activity and trading demand continue weakening, the current price may reflect genuine caution rather than an opportunity. $SOLUSDT #IMPACTbyTrade
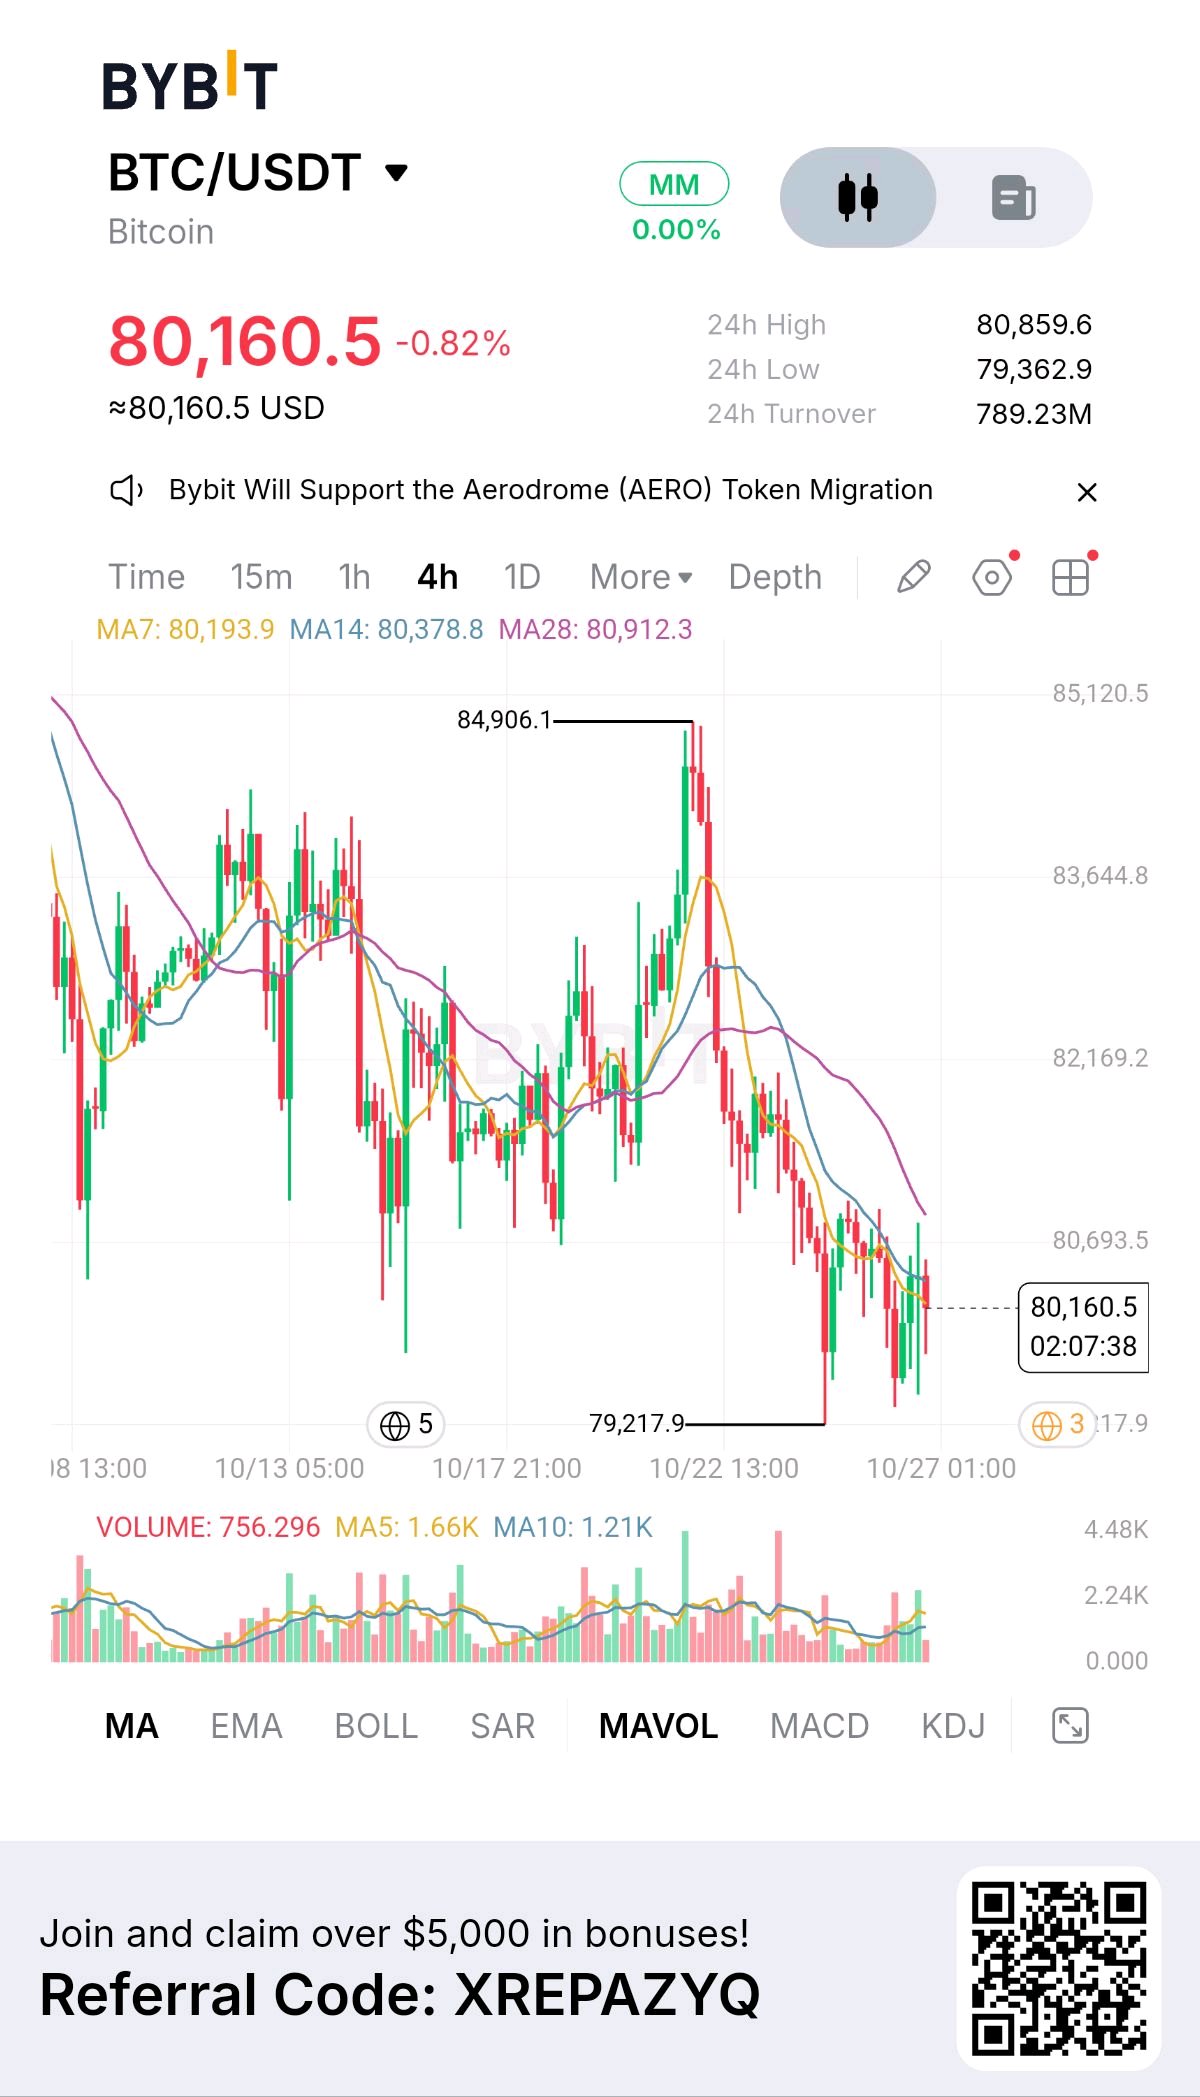
I spent some time looking at this BTC/USDT chart, and the interesting part is not simply that Bitcoin is falling. It is that price is hovering around $80,160 while the four-hour structure still shows sellers controlling the bigger move. My question is whether this is a temporary liquidity test around an important psychological level or an early warning that buyers are losing conviction. Those are two very different situations, even if the candles look similar at first glance. Bitcoin has pulled back sharply from the $84,906 area shown on my chart, and the recent low sits near $79,218. That leaves the market trading between a nearby support zone and several layers of overhead resistance. The moving averages add another detail: MA7 is around $80,194, MA14 near $80,379, and MA28 around $80,912. Price is below the latter two, while all three averages reflect a market struggling to regain upward momentum. This is not the structure I would call a confirmed recovery. What makes this setup worth watching is the gap between Bitcoin's long-term scarcity story and its short-term market behavior. There will only ever be 21 million BTC, and roughly 20.1 million are already circulating. Yet scarcity alone does not create an immediate price floor. Bitcoin's value depends on how strongly buyers want to hold it relative to the supply available for sale. When demand weakens, even a scarce asset can experience a substantial correction. That is the distinction I think traders sometimes overlook when they treat every dip as an automatic buying opportunity. Recent market data reinforces the need for caution. Coinucation reported BTC around $80,373 on October 26, with a 7-day decline of approximately 2.15% and a 30-day decline of 4.77%. Its reported circulating supply was about 20.1 million BTC. These figures provide context, but they do not prove that Bitcoin is undervalued. I would want to see stronger spot demand and sustained buying before interpreting a lower price as a genuine mispricing. My central thesis is that the market may be underestimating how important the $79,200–$80,000 area has become for short-term sentiment, but the available evidence does not yet establish a bullish valuation gap. A rebound from support could attract buyers expecting another move toward $81,000 and beyond. However, if support breaks decisively, traders who bought the dip may become another source of selling pressure. Scarcity can support a long-term investment thesis without preventing a short-term decline. For my trading plan, I would avoid chasing candles in either direction. A four-hour recovery above $80,700–$80,900, followed by a successful retest, would be an initial sign that buyers are regaining control. The next area to watch would be approximately $82,170. A sustained move above that level would improve the recovery structure, although resistance near $83,600 would still matter. On the downside, a convincing four-hour close below $79,200 would weaken the support thesis and put further downside at risk. These are chart-based conditions, not guaranteed liquidity zones. I would WAIT for confirmation rather than force an entry here. The market needs to prove that buyers can reclaim resistance or that sellers can break support with conviction. Until then, the risk of being caught in a false breakout remains meaningful. The key question is not whether Bitcoin is scarce. It is whether actual demand is strong enough to defend its current price. If BTC reclaims resistance and holds it, the recent decline could prove to be a temporary shakeout. If support fails and recovery attempts continue to weaken, the chart will be telling a less comfortable story. That is the evidence I would follow before changing my view. $BTCUSDT #IMPACTbyTrade
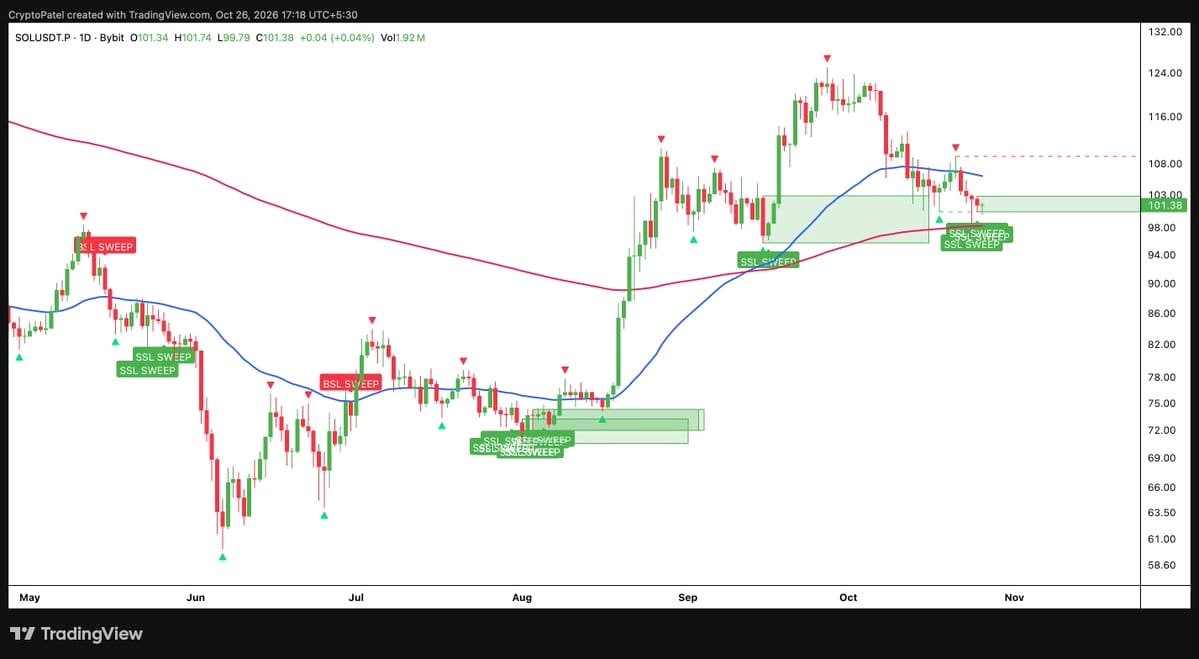
SOLANA IS SHOWING WHY SUPPORT ALONE ISN’T ENOUGH. Look At The $SOL Daily Chart. SOL Has Pulled Back From The $120–$124 Region And Is Now Testing The $98–$103 Support Zone, Near The Rising Long-Term Moving Average. Here’s What I’m Watching: If Buyers Defend Support And Reclaim Resistance, A Recovery Could Follow. If SOL Breaks Down, The Next Major Demand Zone Sits Around $72–$74. A Liquidity Sweep Is Not A Buy Signal By Itself. I Want To See A Reclaim And Bullish Structure Shift Before Calling A Reversal. Do You Think SOL Holds This Zone Or Sweeps Lower First? $SOLUSDT #IMPACTbyTrade
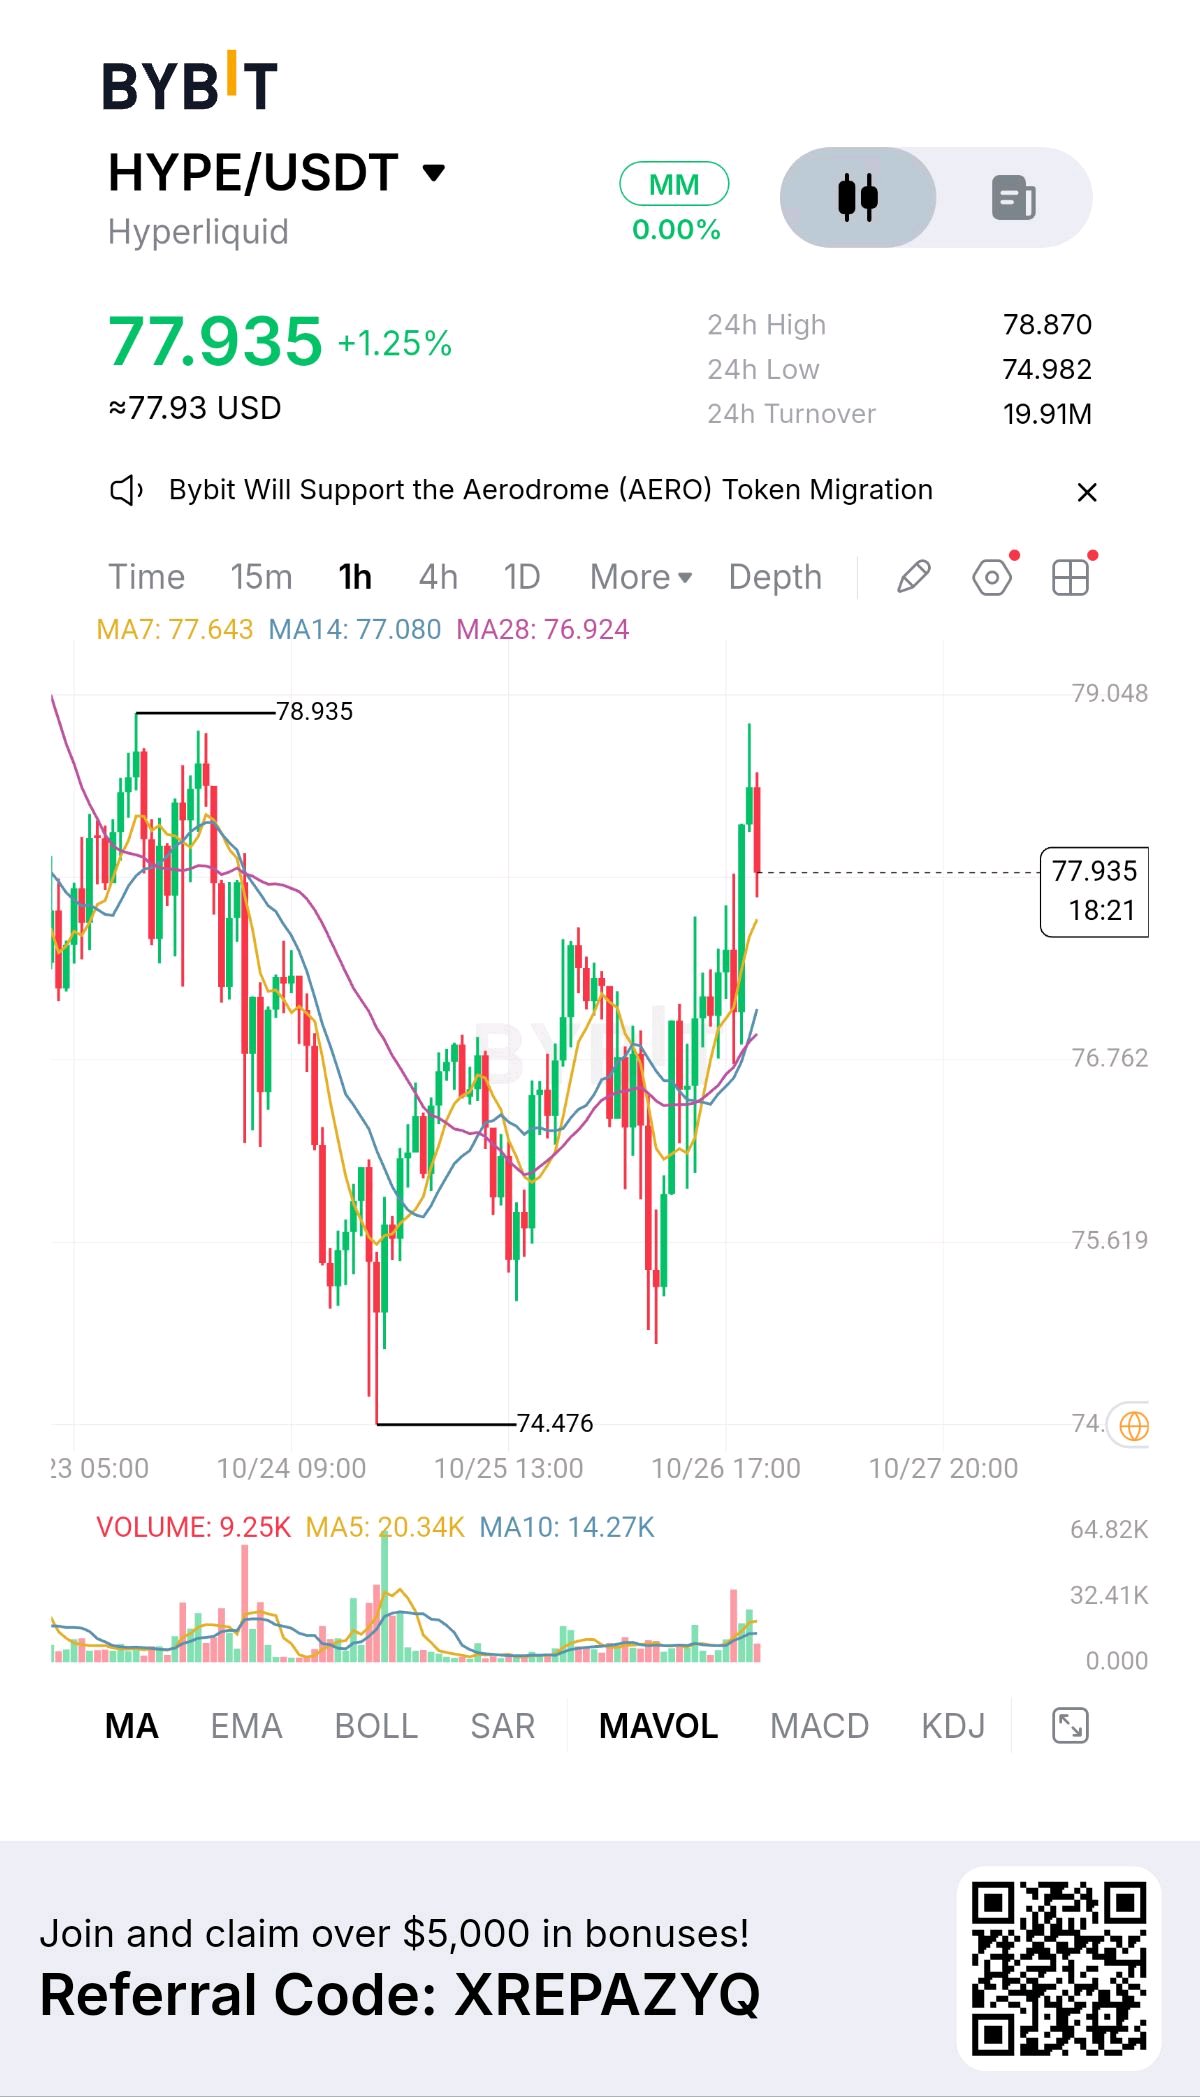
Hyperliquid’s chart is showing an interesting shift: HYPE is trading near $77.94 after recovering from the $74.48 area, but the real question is whether this move represents sustained demand or simply a strong short-term rebound. What interests me most is the difference between a token attracting trading interest and a token building durable economic value. For HYPE, that distinction matters because Hyperliquid is both a trading venue and an ecosystem whose activity, fee flows, and token economics need to be evaluated together. On the supplied one-hour Bybit chart, price is above the MA7 at $77.643, MA14 at $77.080, and MA28 at $76.924. That alignment favors short-term bullish momentum. However, the recent push toward the $78.87–$78.94 resistance area has already encountered selling pressure. A positive candle sequence alone cannot establish that buyers have absorbed the available supply or that a larger breakout is underway. The broader data makes the setup more complicated than a simple bullish chart suggests. Hyperliquid generated approximately $79.65 million in fees and $63.49 million in protocol revenue over the 30 days reported on October 26. Those figures indicate meaningful economic activity, but the same dashboard shows TVL down roughly 9.7% over that period. In other words, the protocol is still generating substantial revenue while capital deposited in its ecosystem has been contracting. That divergence deserves attention. The important mechanism is how that activity reaches HYPE holders. Hyperliquid’s official documentation explains that trading fees flow to designated destinations, including the Assistance Fund, which automatically converts funds into HYPE and burns the acquired tokens. This creates a direct link between eligible fee flows and token-supply reduction. It is stronger than a narrative based solely on user growth because there is a documented mechanism connecting trading activity to HYPE demand and reduced supply. However, burns do not guarantee price appreciation: the market can still reprice future earnings expectations, and selling pressure can outweigh the effect of token removal. My concern is valuation. DeFiLlama's October 26 snapshot places HYPE's circulating market capitalization around $17.2 billion and fully diluted valuation near $73.8 billion, with approximately 222.45 million tokens circulating against a maximum supply of one billion. These figures imply that only about 22% of the maximum supply is currently circulating. The gap between circulating valuation and FDV is not an automatic sell signal, but it means future supply dynamics cannot be ignored when estimating long-term returns. At this valuation, investors need continued fee generation, effective token burns and durable demand—not just a successful trading session. That is why I would not call HYPE obviously undervalued simply because it has bounced. The evidence supports a more balanced interpretation: its fee economics provide a credible fundamental case, while declining TVL, recent monthly weakness and the large FDV-to-market-cap gap leave meaningful risks. The current rebound could reflect improving sentiment, but confirming a lasting change requires stronger price acceptance and continued evidence that protocol economics remain resilient. On the one-hour chart, I would watch three areas. First, $77.60–$77.10 is the initial pullback zone, around the displayed short-term moving averages. Second, $76.90–$76.75 is a deeper support area; losing it would weaken the immediate bullish structure. Third, $78.87–$78.94 is the resistance zone that buyers need to reclaim convincingly. A conditional long setup would require a successful retest of $77.10–$77.60 and a clear recovery in buying momentum, with a protective stop below $76.70. Potential upside reference points would be $78.90, $79.50 and $80.00, provided price breaks resistance rather than rejecting it again. These are illustrative levels derived from the supplied chart, not confirmed liquidity zones or guaranteed targets. A sustained break below $76.70 would invalidate that particular setup; a rejection near $78.90 followed by a loss of $76.75 would favor waiting for a clearer structure instead. I would wait for confirmation rather than chase the current candle. Ultimately, the market may be underestimating the significance of Hyperliquid’s fee-to-burn mechanism, but it may also be correctly demanding a discount for future supply and uncertain growth. The thesis becomes more bullish if fee generation holds up, TVL stabilizes and HYPE breaks resistance with sustained demand. It weakens if protocol revenue contracts, capital continues leaving the ecosystem and price loses support. For me, the real opportunity is not assuming HYPE must rise because Hyperliquid is successful; it is identifying whether the token’s economic value can justify its valuation. $HYPEUSDT #IMPACTbyTrade
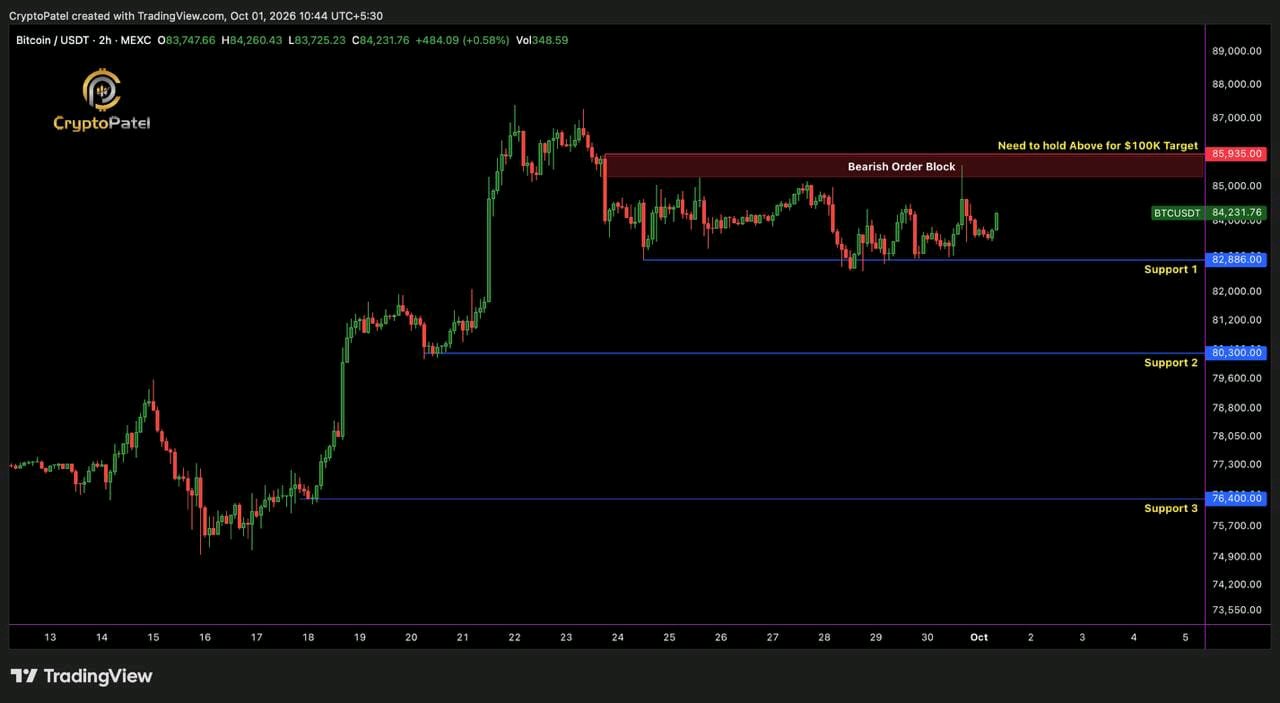
$BTC UPDATE: CRITICAL BREAKOUT ZONE Bitcoin is consolidating below the key 2H bearish order block at $85,300–$86,000 🔹 $86,000 reclaim & hold → bullish confirmation, opening $100K+ 🔹 Key Support: $82,886/$80,300/$76,400 The $100K macro Setup remains dependent on BTC reclaiming and holding above $86K. Don’t chase the first breakout. Wait for confirmation and acceptance. NFA | DYOR $BTCUSDT #ByXIMPACT
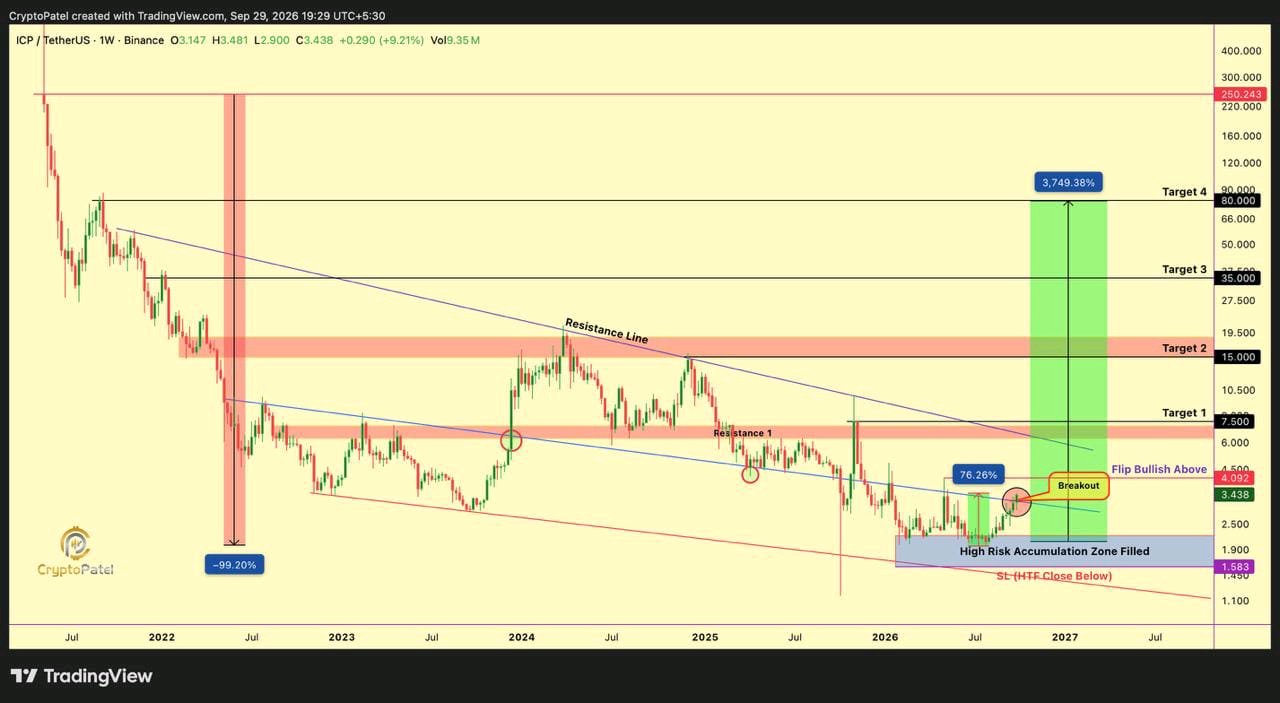
$ICP Price Prediction: Internet Computer Breaks Multi-Year Trendline, Is $80 Next? 🚀 $ICP IS WAKING UP: Crashed from a $250 ATH to a brutal -99% wipeout… and now the ICP comeback has officially started. ✅$ICPUSDT up 75%+ from our High Risk Accumulation Zone ✅ Multi-year Trendline Resistance BROKEN on the weekly chart Next key level for the ICP Breakout: Flip $4.092 and HOLD Above = Super Bullish. That's where the real ICP rally begins. Macro Targets: $7.50 → $15 → $35 → $80 Invalidation: HTF close below $1.58 #ByXIMPACT
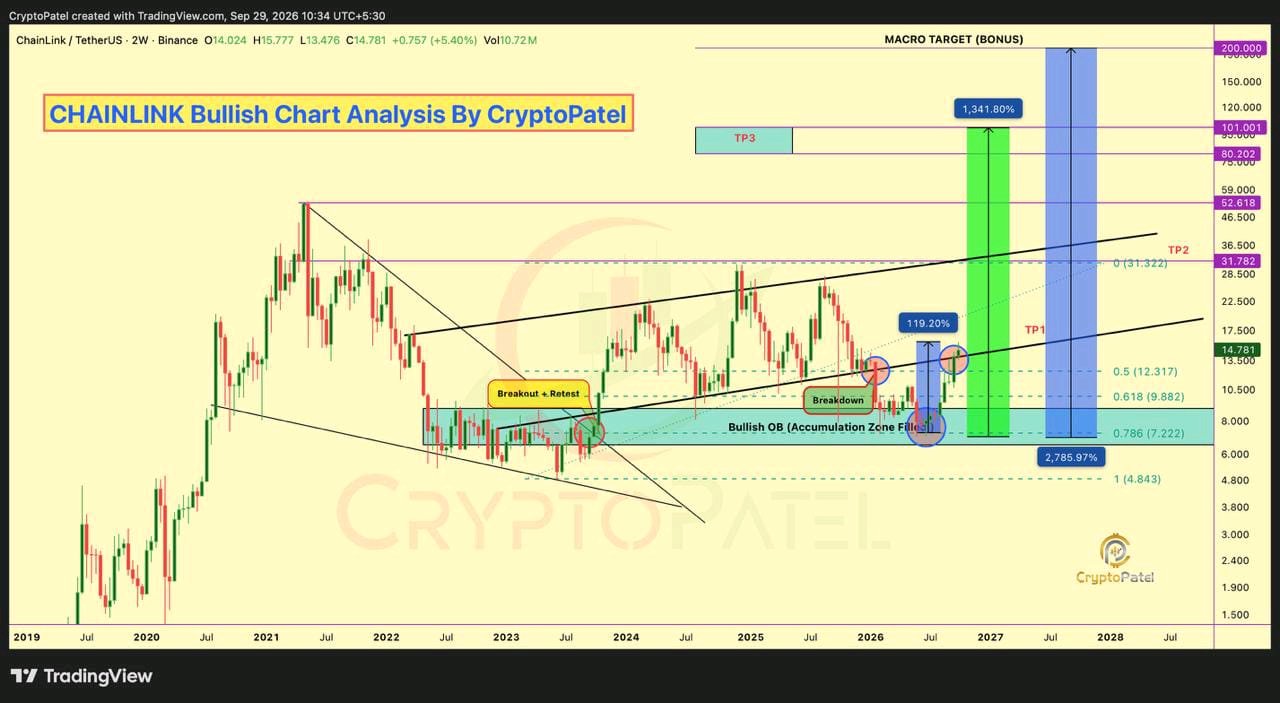
$LINK Price Prediction: The $200 Macro Target Is Still on the Chart $LINK is showing a major higher-timeframe recovery after spending years inside a broad accumulation structure. The 2-week chart shows that Chainlink has repeatedly reacted from the same long-term demand area, with the major accumulation zone around $7–$8 already filled. From that region, LINK has delivered a powerful recovery and is now trading around $14.78, representing roughly a 120% move from the original accumulation zone. The bigger picture remains interesting because LINK has reclaimed the broader breakout structure and is holding above the bullish order block. Price has also moved back into the ascending trend structure, suggesting that the market is attempting to transition from long-term accumulation into a new expansion phase. The next major area to watch is $15–$18. A sustained higher-timeframe breakout above this resistance could open the path toward the $31–$32 region, which is the next major resistance shown on the chart. If LINK successfully breaks and holds above that area, the following technical levels come into focus around $50, then $80–$100, with the extended macro projection reaching as high as $200. My chart targets are $18 → $32 → $50 → $100, with $200 as the long-term macro target. These levels should be viewed as technical projections rather than guaranteed prices, because every target depends on LINK maintaining its higher-timeframe structure and successfully breaking the resistance levels along the way. The most important demand area remains around $10.5–$8.5. If LINK experiences a correction, this zone becomes an important area to watch for support. As long as price continues to respect this broader demand region and maintains the sequence of higher lows, the bullish structure shown on the chart remains intact. The key risk is a sustained breakdown below the major demand structure. If LINK loses the $8–$10.5 region and fails to reclaim it, the bullish continuation thesis would become significantly weaker. Until then, the higher-timeframe chart continues to show the potential for another major expansion phase. The setup is therefore simple: $7–$8 accumulation zone → breakout and recovery → $14.78 current level → $18 → $32 → $50 → $100 → $200 macro scenario. $200 is the macro target. The real confirmation comes one breakout at a time. NFA, DYOR $LINKUSDT #ByXIMPACT
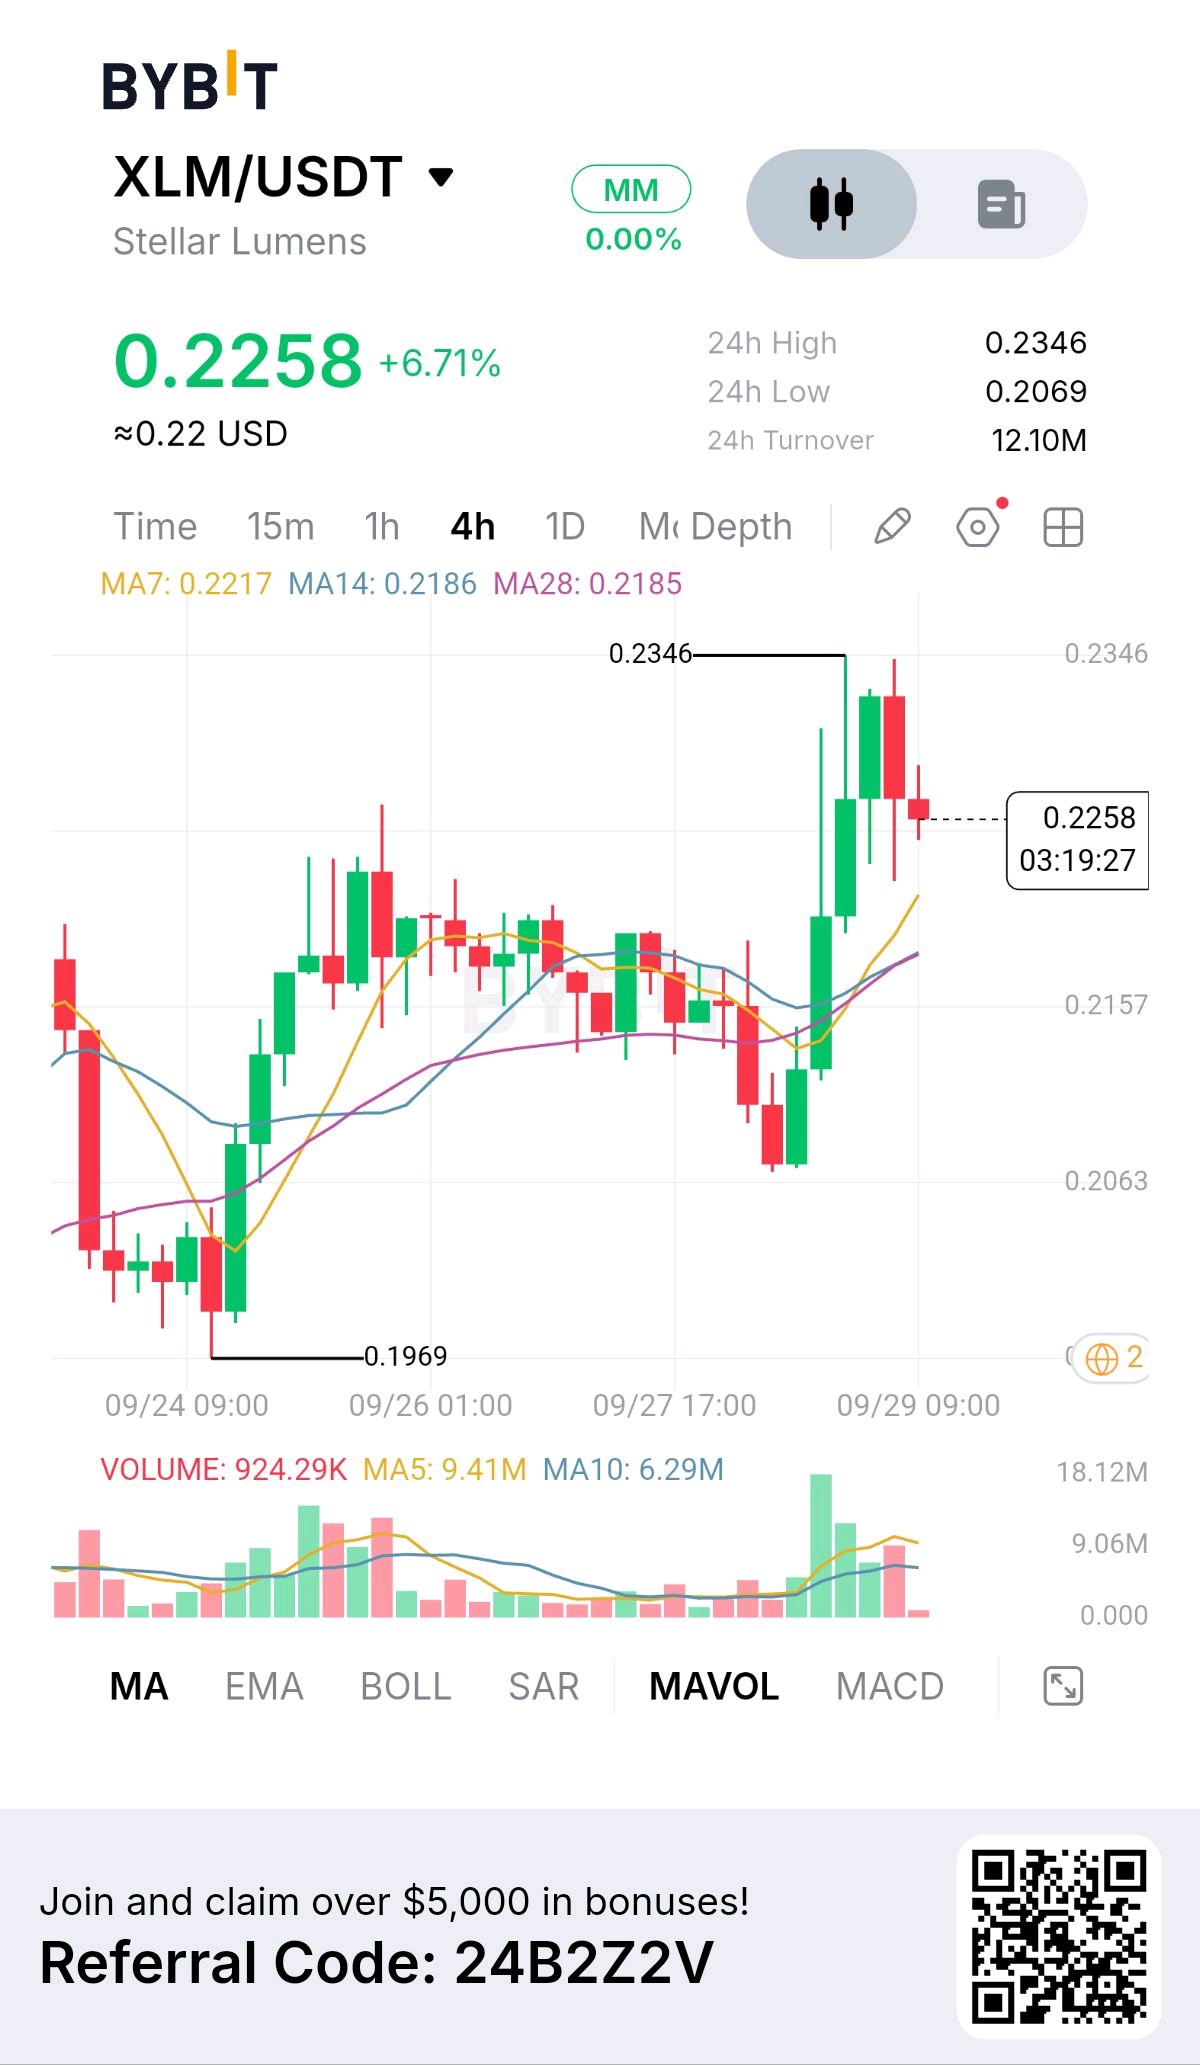
XLM is sitting around $0.2258 after a sharp 4H breakout, but the question I’m asking here is simple: is there still enough upside left to justify chasing this move? On the chart, XLM moved from roughly $0.207 to a 24H high of $0.2346, breaking above the previous consolidation around $0.215–$0.218. Price is also holding above the visible MA7 at $0.2217, MA14 at $0.2186 and MA28 at $0.2185. That alignment is constructive, but the latest candle is pulling back from the $0.2346 high. The move is not happening in isolation. Recent market data showed XLM gaining around 7% over 24 hours, while reported volume and market participation increased. Stellar has also had recent fundamental catalysts: Protocol 28 went live in September, and recent reports have highlighted growing tokenized real-world-asset activity on the network. But this is exactly where I become more selective. The market may already be pricing in part of that bullish narrative. XLM has just made a fast move from the $0.20 area, and the chart shows meaningful resistance around $0.2346. Buying directly underneath that level means I’m entering after a large impulse while resistance is only a few percent away. That creates the main risk: a failed breakout. If XLM loses the $0.218–$0.221 area, the breakout begins looking less convincing. A deeper rejection could send price back toward the previous $0.2069–$0.2157 structure. That would tell me buyers were unable to turn the breakout into sustained support. My read is bullish, but I don't want to chase blindly. The better risk/reward comes from either a controlled retest of the breakout zone or a confirmed break above $0.2346. My trade plan: Entry zone: $0.218–$0.223 on a successful retest. Bullish trigger: 4H close above $0.2346, preferably followed by a hold/retest. Stop/invalidation: Below $0.2069 for the wider setup. TP1: $0.245 TP2: $0.260 TP3: $0.280 Using a $0.221 entry and $0.2069 invalidation, the initial risk is approximately $0.0141. A move to $0.260 represents roughly $0.039 upside, giving an approximate 2.8R setup. At $0.280, the theoretical reward rises to about 4.2R. For the bearish scenario, my trigger would be a clear rejection from $0.2346 followed by a loss of $0.218. The first bearish target would be the $0.2069 area, with invalidation back above $0.2346. The key catalyst from here is simple: can XLM convert $0.218–$0.223 from resistance into support and then break $0.2346? If yes, the structure becomes much more interesting. If price loses the breakout area instead, I would rather protect capital than force a trade. I would take the trade on a confirmed retest or breakout with controlled risk. If XLM keeps running without giving me either, I WAIT rather than chase the candle. $XLMUSDT #ByXIMPACT
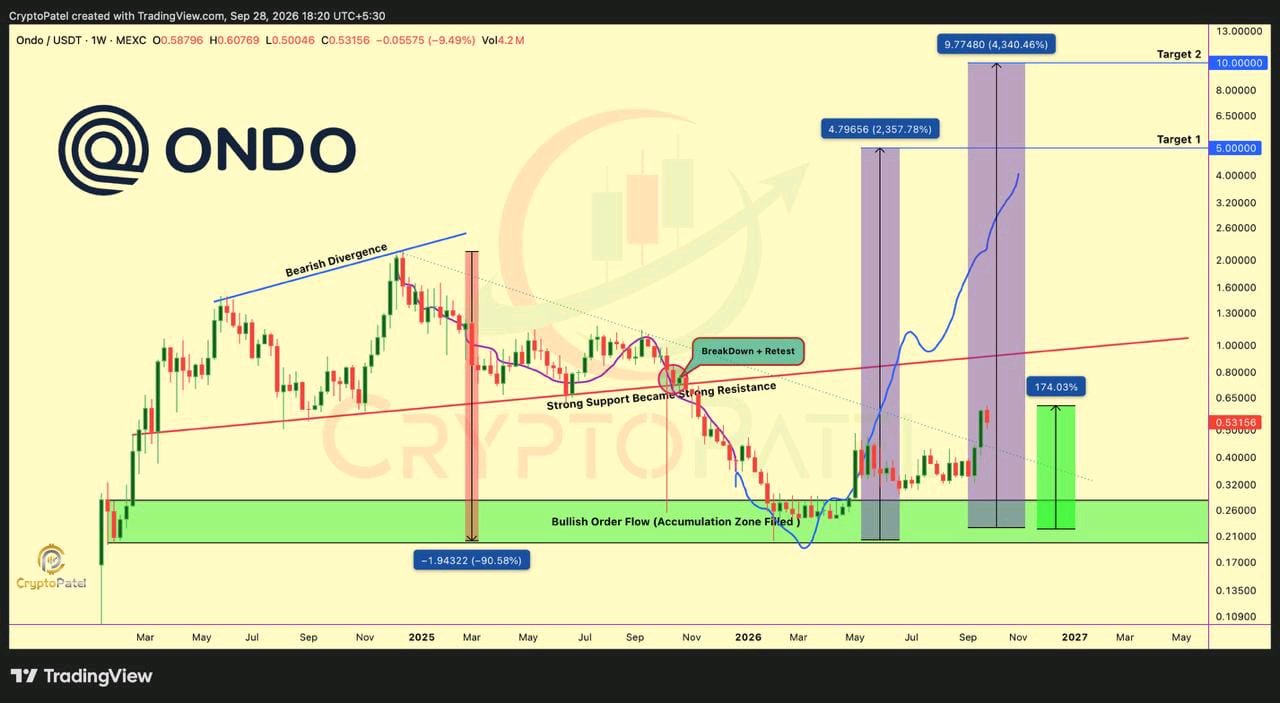
$ONDO is setting up for a potentially major macro expansion after spending months building a base and reclaiming important higher-timeframe structure. The chart shows a clear sequence: a major bearish divergence formed near the previous cycle high, followed by a brutal ~91% correction. That decline eventually brought $ONDO into the $0.28–$0.20 accumulation zone, where the selling pressure began to exhaust and a longer-term base developed. From that accumulation area, the structure has changed significantly. $ONDO has already rallied strongly from the zone, and the key development now is the weekly trend reversal. The former macro downtrend resistance has been broken, while the previous support area around the $0.80–$0.90 region became an important resistance zone after the breakdown and retest. The next major battle is therefore around $0.90–$1.00. A sustained weekly close above this region would strengthen the case that the broader accumulation phase has transitioned into a new expansion phase. Until that happens, this area remains the key confirmation zone rather than assuming the breakout is already complete. If $ONDO can reclaim and hold $1, the chart projects substantially higher levels. The first major upside objective is around $5, followed by the larger $10 target shown on the chart. From the current area, those levels would represent extremely large percentage moves, so the path would likely require several consolidation and retracement phases rather than a straight-line rally. There is also an important fundamental backdrop: $ONDO operates in the real-world-assets/tokenization sector, and current market data shows significant trading activity and a market capitalization around $2.5B. Recent market coverage has also highlighted renewed attention around Ondo's tokenized-asset initiatives. The invalidation to watch is equally important. If price repeatedly fails around the $0.90–$1.00 resistance zone and loses the reclaimed structure, the bullish breakout thesis would need to be reassessed. Likewise, the original $0.28–$0.20 accumulation region remains a major historical demand area on this chart. So the roadmap is simple: hold the higher-timeframe structure → reclaim $0.90–$1.00 → confirm the breakout → target $5 → potentially $10. $ONDO is no longer just a recovery from the lows; the key question is whether this developing structure can evolve into a full macro expansion. $ONDOUSDT TA only. Not financial advice. Always DYOR. #ByXIMPACT
FRANKLIN TEMPLETON × BYBIT: TOKENIZED FUNDS ENTER CRYPTO COLLATERAL Franklin Templeton has partnered with Bybit to let eligible clients use BENJI tokenized fund shares as collateral for USDT and USDC trading credit. 🔹 Franklin Templeton AUM: ~$1.7T 🔹 Tokenized Fund Assets: ~$686.6M 🔹 Recent Yield: ~3.7% 🔹 Collateral: BENJI / FOBXX 🔹 Stablecoins: USDT & USDC 🔹 Custody: ByCustody 🔹 Future: Tokenized wealth product on Mantle The assets remain in regulated custody while their value can support crypto trading liquidity. Tokenized Treasuries + Stablecoins + Institutional Capital = RWA adoption accelerating. $USDCUSDT #ByXIMPACT #BybitOdds #ByPickMakeYourPickCount

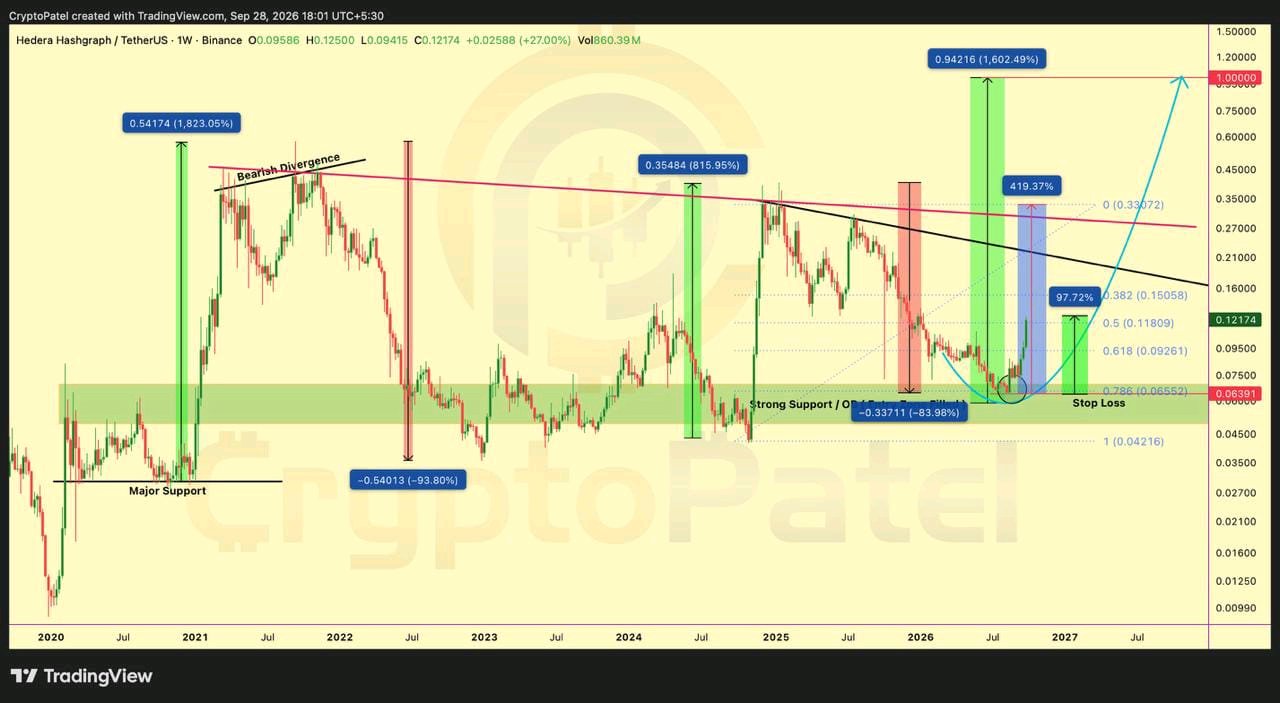
$HBAR PRICE PREDICTION: IS A 400%+ EXPANSION PHASE NEXT? $HBAR is showing a major shift in its higher-timeframe structure after spending an extended period consolidating around the long-term support zone. The latest move has pushed price back above the key $0.092–$0.118 Fibonacci area, turning a previously important resistance region into a potential foundation for the next leg higher. The interesting part is the location of this move. HBAR spent months compressing near the $0.06–$0.08 accumulation/support region, repeatedly defending that area. From the accumulation zone, the token has already delivered roughly a 100% move, and the current breakout is now putting the larger descending trend structure under pressure. The chart shows several historical examples where HBAR experienced explosive expansions after extended accumulation phases. Previous major rallies produced gains of hundreds to more than 1,000%, followed by deep corrections and long consolidation periods. The current structure is attempting to repeat that type of cycle, although there is no guarantee that the historical pattern will repeat. The first important area to watch is $0.15. A sustained move above this level would strengthen the breakout structure and potentially open the door toward $0.21, where the next major resistance zone comes into focus. Above $0.21, the chart points toward $0.33, which is another major higher-timeframe level and could become the next significant profit-taking or rejection area. If HBAR can eventually break through the $0.33 region and establish it as support, the larger chart projection becomes much more aggressive, with $1.00 as the major long-term target shown on the setup. At the current chart price around $0.12, reaching $1 would actually represent roughly a 720% gain from $0.12, while a move from $0.20 to $1 would represent approximately 400%. So the exact percentage depends on the starting point, but the chart is clearly presenting a potential multi-stage expansion rather than a single straight-line move. The key level that could invalidate this thesis is around $0.07. A decisive loss of that HTF support would weaken the accumulation-breakout structure and suggest that the market may still need more time to build a base. For now, the levels I’m watching are: $0.15 → $0.21 → $0.33 → $1.00 The bigger question is whether this is simply a short-term breakout after a sharp move or the beginning of a much larger higher-timeframe expansion. September 28 price action has already been extremely volatile, with HBAR trading above $0.12 after starting the day around $0.096 on some market feeds. If the breakout holds and the major resistance levels are reclaimed one by one, the structure could become increasingly interesting. But if HBAR loses the $0.07 invalidation zone, this bullish thesis would need to be reconsidered. $0.07 = HTF invalidation $0.15 = first major target $0.21 = next resistance $0.33 = major breakout level $1.00 = long-term chart target Could $HBAR be entering its next major expansion cycle? NFA. $HBARUSDT #ByXIMPACT
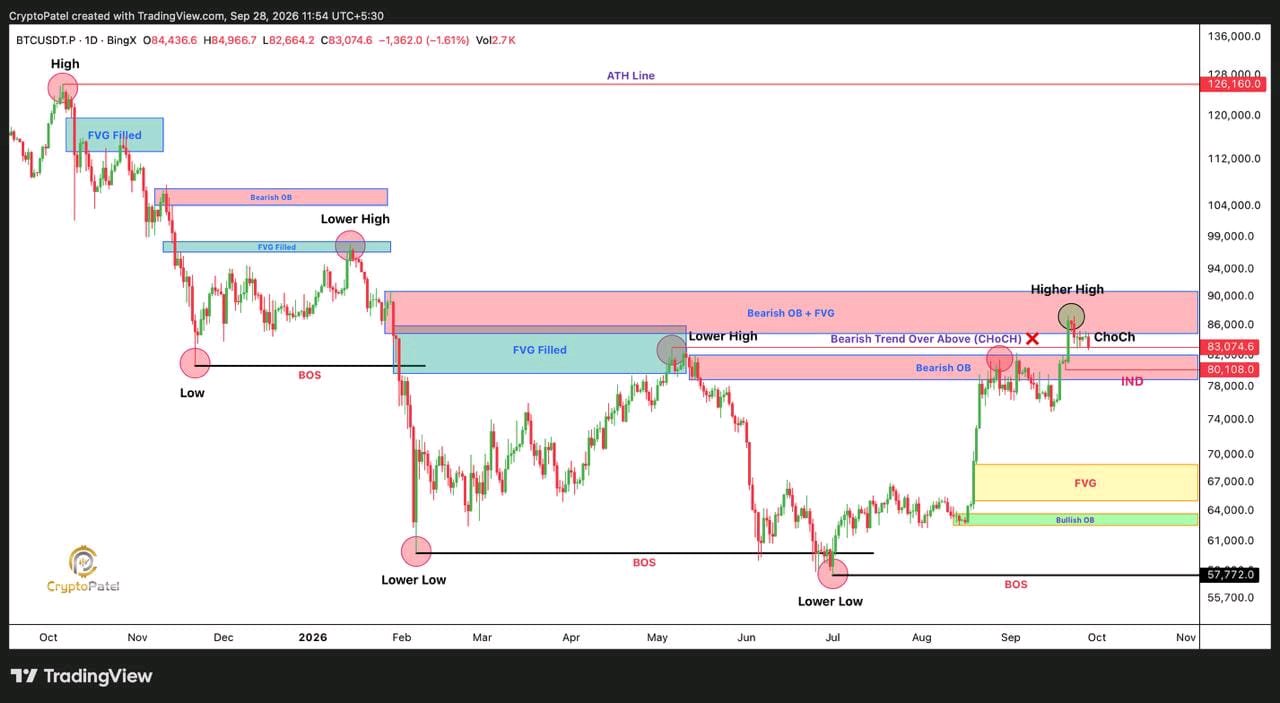
$BTC BULLISH CHoCH CONFIRMED: Is Bitcoin Preparing For The Next Massive Rally? My Previous $BTC Thesis Is Playing Out. After Breaking The Previous LH + LL Structure, Bitcoin Confirmed A HTF CHoCH With A Daily Close Above $82,850. $BTC Then Expanded To $87,368. Now The Key Question: Is $87,368 The New Higher High? Not Confirmed Yet. For HH Confirmation, I’m Watching A Daily Close Above $80,108 (Inducement) After The Current Retracement Structure Develops. If HH Gets Confirmed, I’ll Be Watching For A HL Reaction Into: 🔹 FVG: $68,883–$65,019 🔹 Bullish OB: $63,700–$62,500 These Zones Could Become Major Demand Areas For The Next Bullish Expansion. Currently, BTC Has Rejected From A Strong Bearish OB + FVG Resistance: $90,585–$84,694 🔻 As Long As BTC Respects The Bullish Structure And Holds Above The FVG/OB Demand Zones, The HTF Bullish Thesis Remains Intact. CHoCH → HH → HL → Continuation. Structure First. Liquidity Second. Entry On Retracement. $BTCUSDT NFA | Always DYOR #ByXIMPACT
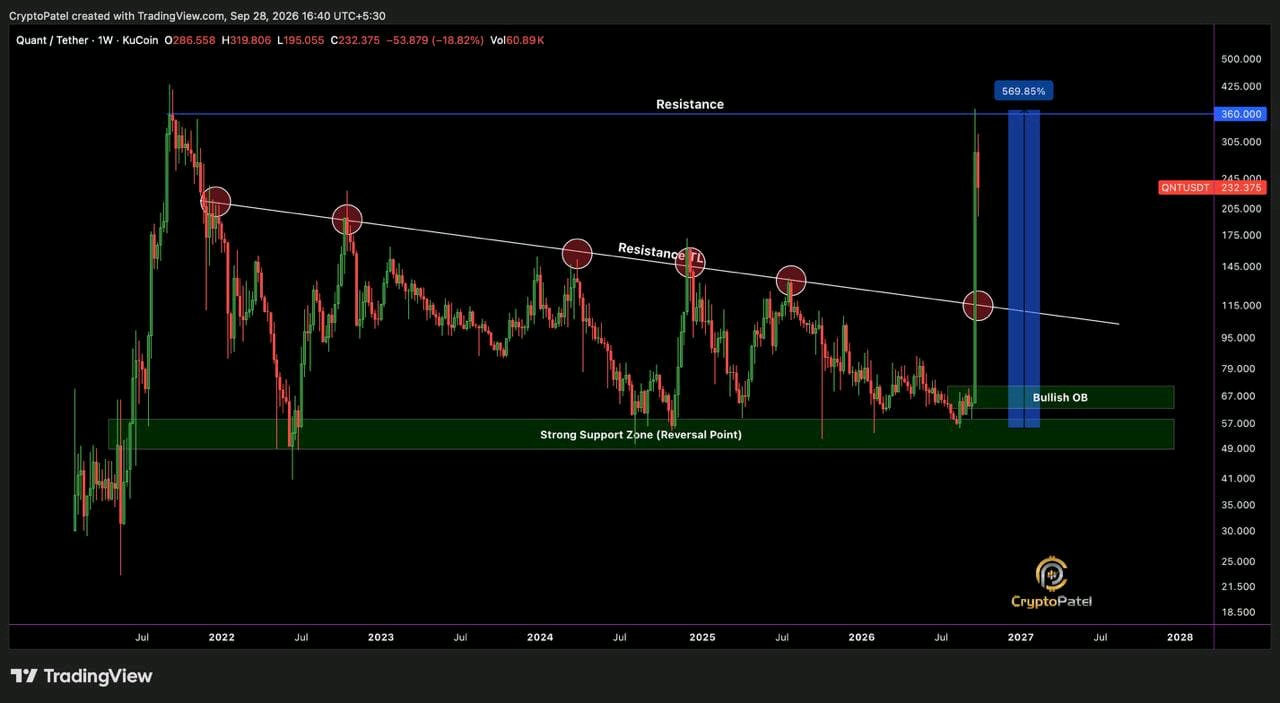
$QNT: FROM $115 BREAKOUT TO $373 — +300% FROM OUR SETUP! $QNTUSDT did exactly what we expected. After breaking the critical $115 HTF resistance, price exploded and yesterday reached $373 — roughly 300% above the setup zone I highlighted. But now the structure is changing. QNT has already dumped from $373 to $195 and is currently trading around $231. The recent pump is heavily driven by news, but NEWS DOESN’T LAST FOREVER. If you’re already holding from lower levels, this is where PROFIT BOOKING + RISK MANAGEMENT matters more than FOMO. QNT is now up roughly 500% in just 2 weeks. After such a parabolic move, major retracements and deep corrections can happen. I’m NOT suggesting holding blindly for the long term here. Protect your capital. Secure profits. Let the next structure develop. No FOMO. No greed. RISK MANAGEMENT FIRST. #ByXIMPACT