
$$$$SYN
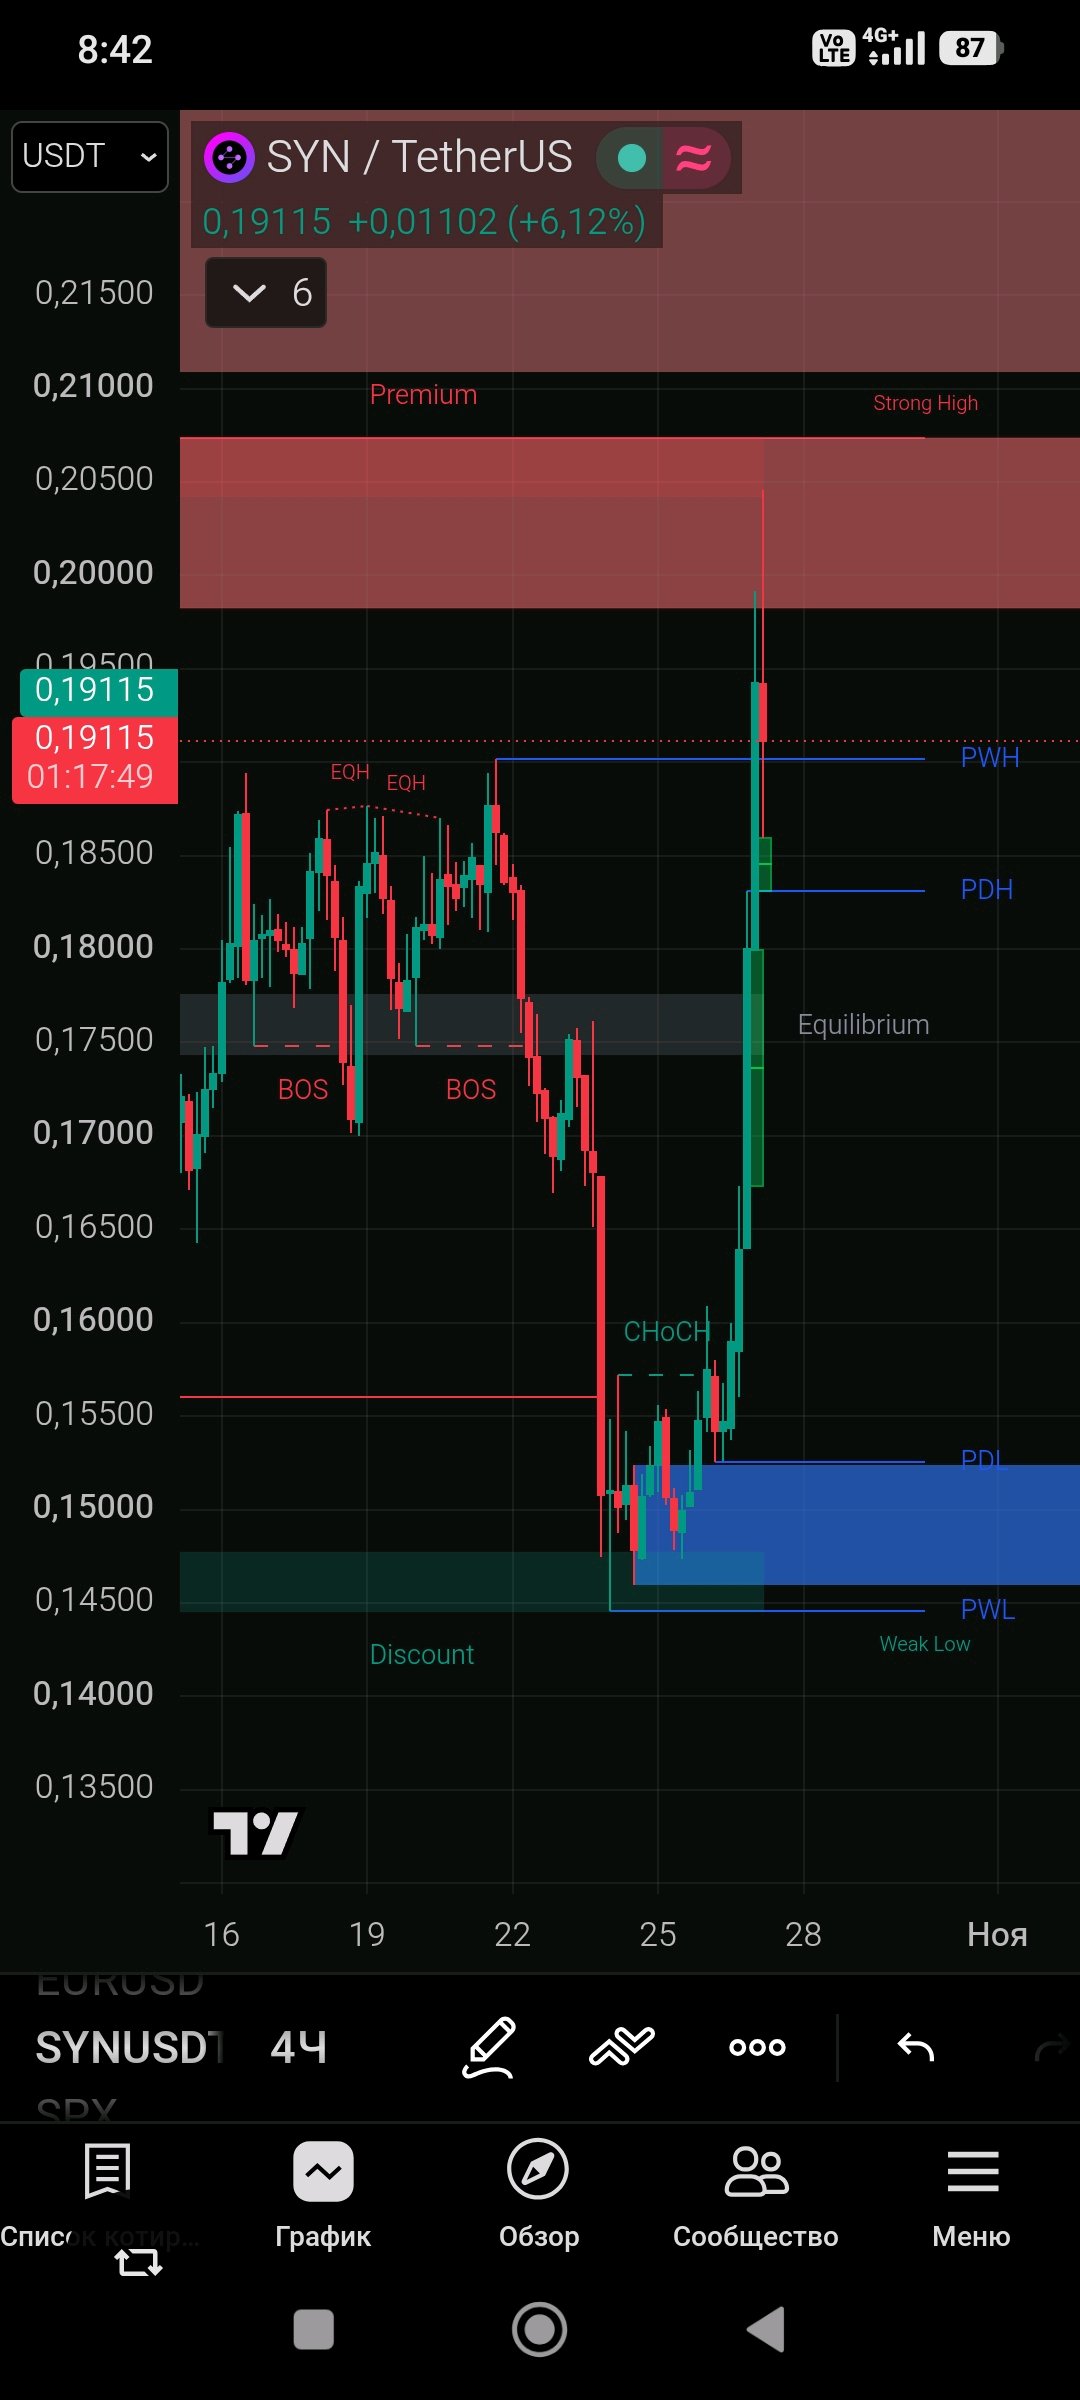
$SYN ЛОНГ: Потужний вихід із Discount-зони та пробій рівнів PDH/PWH 🚀 На 4-годинному графіку SYN/USDT ми спостерігаємо ідеальне відпрацювання концепції Smart Money. Ціна тривалий час накопичувала ліквідність, опустилася в зону найглибшого дисконту, де зняла ліквідність нижче рівнів PDL та PWL (Weak Low). Після цього покупці сформували сильний імпульсний розворот зі зламом структури (CHoCH), який одним рухом пробив межу Equilibrium та рівні попередніх максимумів (PDH/PWH). • Напрямок: LONG (Купівля) 🟢 • Точка входу: поточні (в районі 0.1911) або консервативно на ретесті пробитого рівня PWH (близько 0.1870) • Ціль 1: 0.2030 (вхід у червону Premium-зону) • Ціль 2: 0.2100+ (тест сильного максимуму Strong High) • Стоп-лосс: за лінію зламу структури CHoCH (нижче 0.1530) Імпульс вкрай сильний, але оскільки ціна вже підтискає Premium-зону, обов'язково контролюйте ризики та фіксуйте профіт частинами! 👇 Як гадаєте, чи вистачить у биків сили оновити Strong High без глибокого відкату? Пишіть свої прогнози в коментарях! #SYN #SYNUSDT #SmartMoney #CryptoNews #Trading

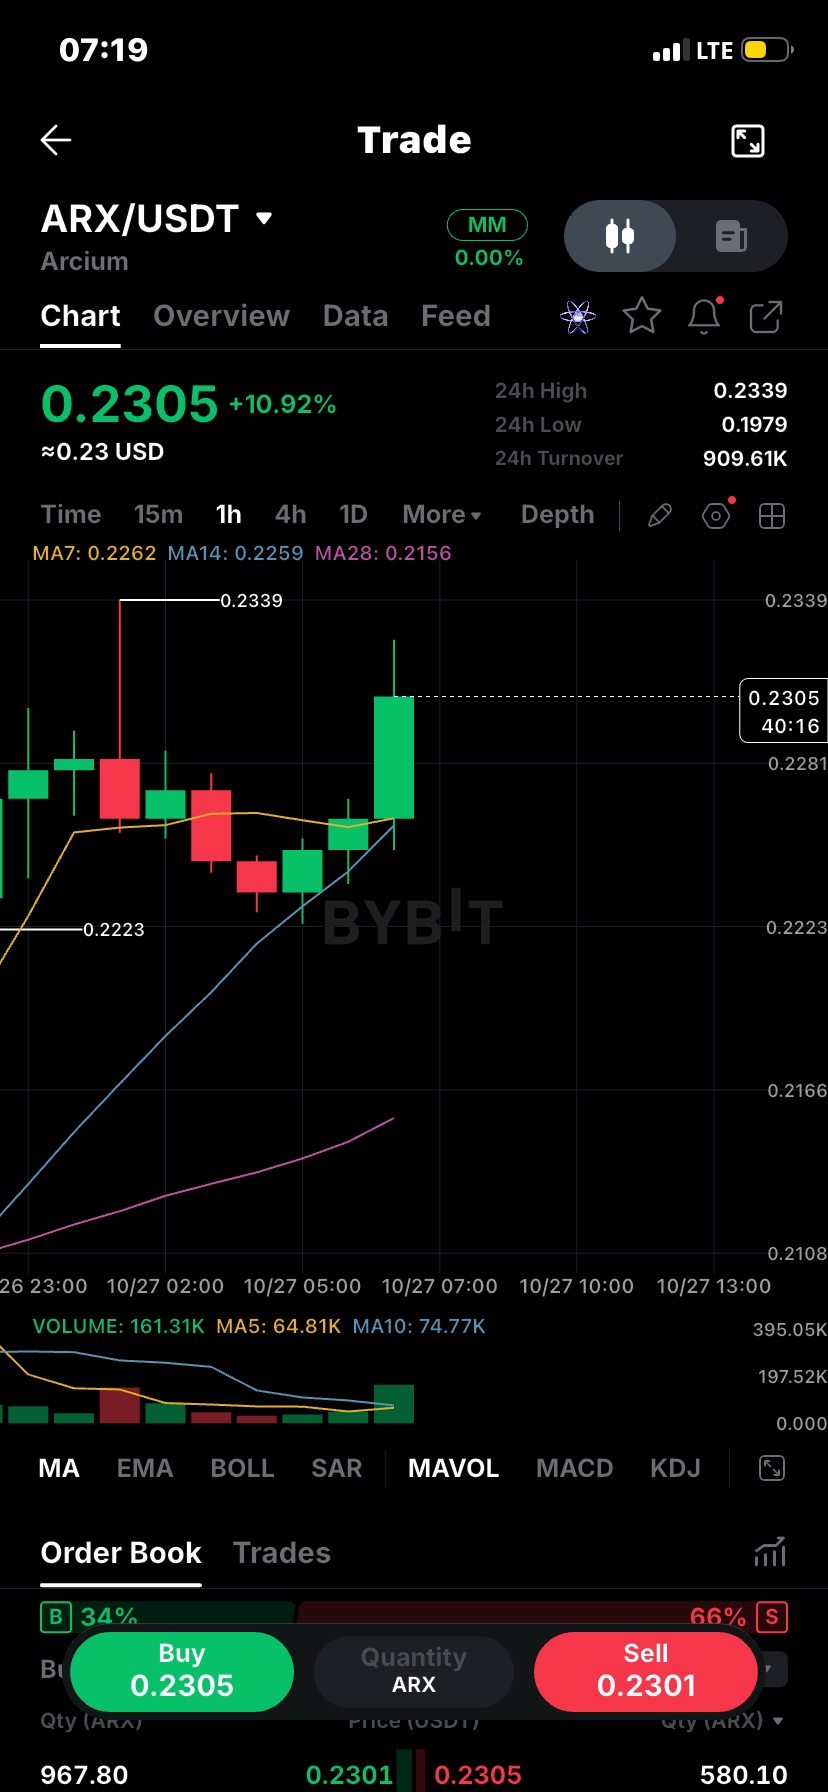
$ARXUSDT 📈 ARX/USDT Timeframe: 1H Price shown: 0.2305 USDT 24h change: +10.92% 1. Market trend ARX/USDT shows short-term bullish momentum. The latest green candle indicates strong buying pressure, but price is approaching resistance. 2. Moving averages (MA) Indicator Value MA7 0.2262 MA14 0.2259 MA28 0.2156 Price is above all three moving averages, suggesting bullish momentum. However, a pullback is possible after the sharp rise. 3. Support and resistance * Resistance: 0.2339 * Near support: 0.2281 * Moving-average support: 0.2262–0.2259 * Lower support: 0.2223 A strong breakout above 0.2339 could support further upside. Losing 0.2281 could indicate weakening momentum. 4. Volume analysis The displayed volume is 161.31K, compared with MA5 at 64.81K and MA10 at 74.77K. This suggests increased trading activity. A breakout supported by strong volume would be more convincing, but high volume can also accompany selling. 5. Order book * Buyers: 34% * Sellers: 66% The displayed order book leans toward sellers, but this alone cannot predict the next price movement. Order book quantities change quickly. 6. Possible trading scenarios 🟢 Bullish scenario * Watch for a 1H candle close above 0.2339. * Look for a successful retest before considering an entry. * Possible areas to monitor: 0.2350 and 0.2400, not confirmed resistance levels. 🟡 Pullback scenario * Watch 0.2281 and 0.2262–0.2259. * Look for bullish candle confirmation before considering a buy. 🔴 Bearish scenario * Rejection near 0.2339 followed by a break below 0.2281 could weaken the bullish setup. * Possible downside areas: 0.2260 and 0.2223. 7. Risk management Always define your entry, stop-loss, and take-profit before trading. Consider risking only 0.5–1% of your capital per trade, and be especially careful with leverage. Final verdict Bias: Short-term bullish, but resistance is close. The strongest bullish confirmation would be a 1H candle closing above 0.2339 with good volume. Avoid chasing the current green candle without confirmation. This analysis is based on your screenshot, not live market data. These levels are approximate and are not guaranteed trading signals. For a more accurate analysis, send me the updated 4H, 1H, and 15m charts. #WSOT2026 #IMPACTbyTrade #AnthropicS1Filing #MyByXTake #FOMCRateDecision $SOLUSDT
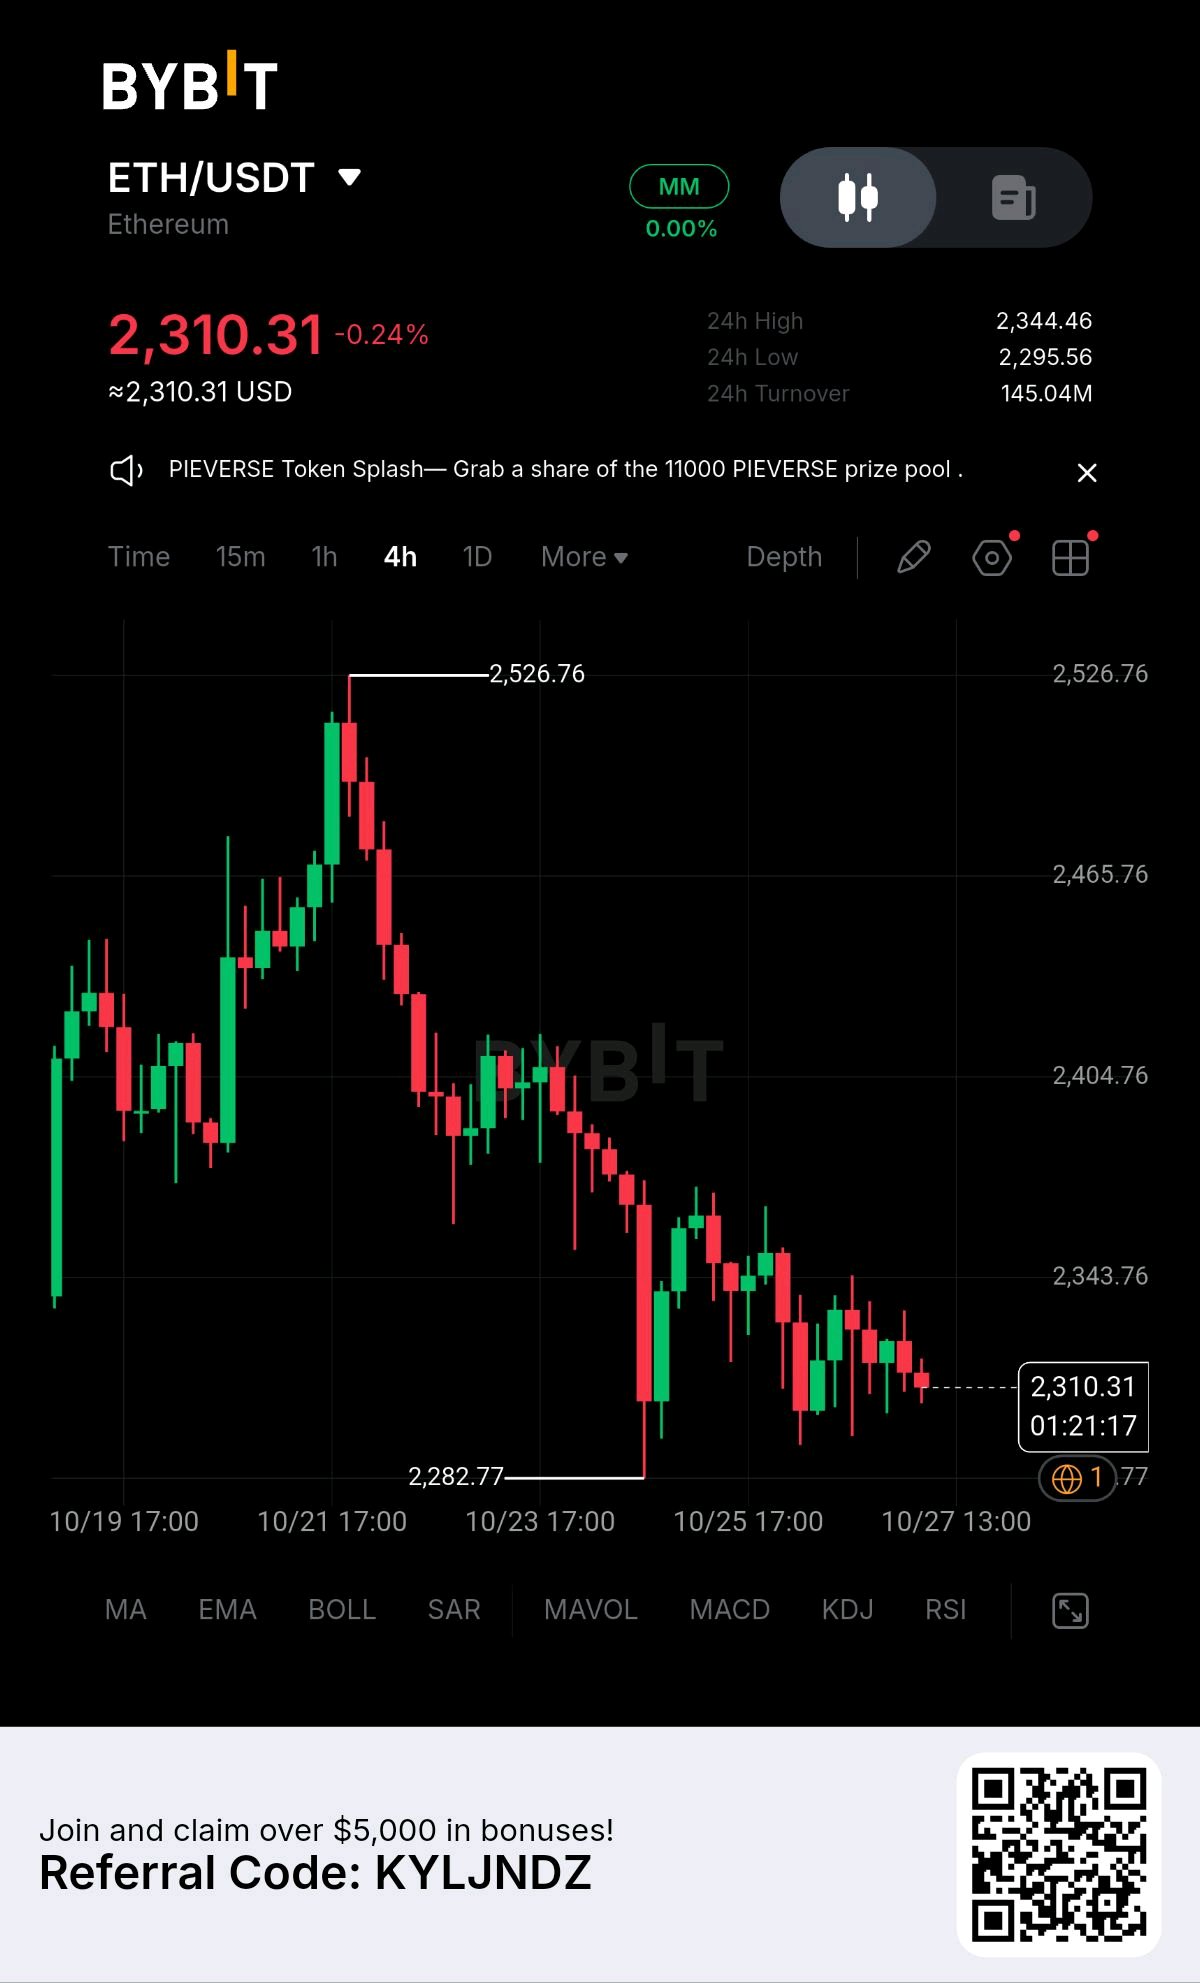
Who missed this one? 🔥 Bought the dip while everyone was panic-selling. If you missed this easy play, it’s time to start following my trades.

ETH: Institutional Access Expands Beyond the US
$ETHUSDT is becoming more accessible through regulated investment products—but what does that actually mean for ETH? Two developments deserve attention. 1. Thailand opens a regulated route for crypto ETFs Thailand’s SEC introduced a crypto ETF framework effective October 16, 2026, initially allowing Bitcoin and Ether. The rules require regulated custodians, minimum average exposure of 80% to the selected crypto asset, and trading through the Stock Exchange of Thailand. Why it matters: Investors can potentially gain crypto exposure through a familiar investment structure rather than managing tokens and wallets directly. Important distinction: A new framework creates a route to market; it does not guarantee immediate inflows or widespread adoption. 2. Ethereum staking enters the institutional product conversation Grayscale’s official Ethereum Staking Mini ETF data, dated October 23, 2026, reported approximately $2.23 billion in assets under management and 80.23% of the fund’s ETH staked. The fund reported a 2.43% net staking reward rate at that snapshot. This demonstrates how regulated investment products can combine ETH exposure with staking-related rewards. However, staking rewards fluctuate, are not guaranteed, and fund investors face fees and product-specific risks. 3. Why institutions may care about Ethereum Ethereum supports smart contracts, stablecoins, tokenized assets, and decentralized financial applications. Regulated investment vehicles can make ETH easier to access for investors who prefer traditional brokerage and custody arrangements. If access expands alongside genuine demand, it could support a deeper institutional market over time. 4. What could this mean for ETH? The bullish case: More regulated access may broaden the investor base. Sustained net inflows and long-term ETH holdings could strengthen demand. The bearish case: ETF products can still experience outflows. Regulatory access does not eliminate volatility, competition from other networks, or macroeconomic pressure. Staking products also introduce operational, liquidity, and reward-related considerations. 5. What traders should watch - Daily and cumulative ETH ETF net flows - Whether regulated products attract sustained new capital - ETH staking participation and reward-rate changes - Ethereum network activity and competition from other chains - Price reaction after the market has absorbed the news Trader takeaway: Institutional access is an important adoption signal, but access and actual buying are two different things. The stronger confirmation would be sustained capital inflows alongside healthy Ethereum ecosystem activity. Will regulated access become a lasting demand driver for ETH, or will institutional flows remain too sensitive to market conditions? DYOR. This is fundamental analysis, not a guaranteed price prediction. #WSOT2026 #AnthropicS1Filing #IMPACTbyTrade


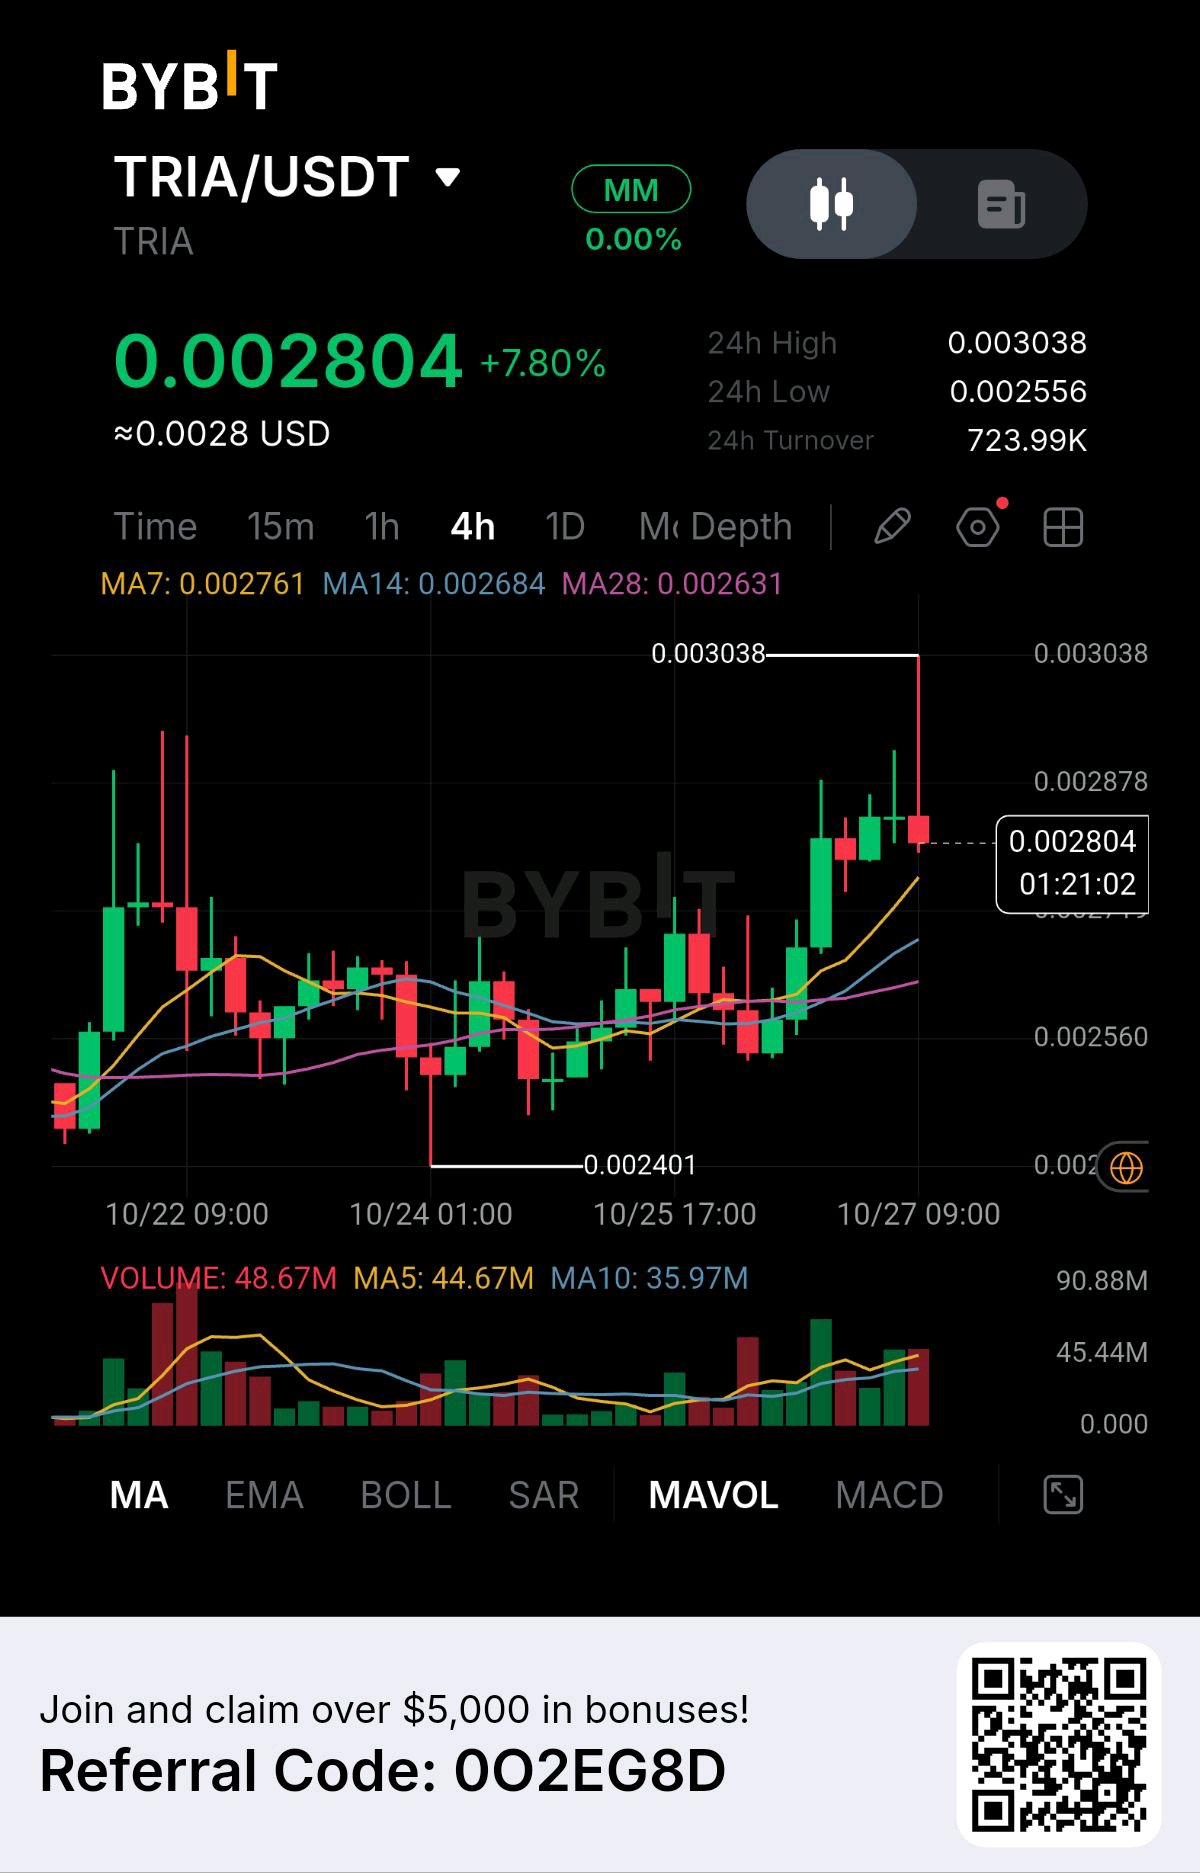
TRIA is showing a move that deserves attention for a reason beyond its 7.80% gain: buyers pushed price above the recent trading range, but the latest candle has already rejected the $0.003038 high. The next question is whether this is a healthy retest or the beginning of a failed breakout. At the time of the chart, TRIA is trading at $0.002804, up 7.80%, with a displayed 24-hour high of $0.003038, low of $0.002556, and turnover of approximately $723.99K. The 4H structure shows TRIA recovering from the $0.002401 low and spending time consolidating around $0.00256–$0.00265. Buyers then pushed through that range, lifting price above $0.00270 and toward $0.003038. That sequence matters because the market has moved from sideways trading into an attempted expansion. The moving averages support the recovery. MA7 is around $0.002761, MA14 at $0.002684, and MA28 at $0.002631. Price remains above all three, and the averages are stacked in a constructive order. This suggests the short-term trend has improved even though the latest candle is red. Volume provides additional evidence. The displayed volume is 48.67M, compared with MA5 at 44.67M and MA10 at 35.97M. Participation is elevated relative to those averages, which supports the idea that the breakout attracted meaningful activity. However, volume alone cannot tell me whether that activity represents sustained buying or profit-taking near resistance. My read is that TRIA's recovery remains intact, but $0.003038 is the level buyers must reclaim to confirm continuation. The rejection makes chasing the current candle less attractive. Bullish trigger: A 4H close above $0.003038, ideally followed by a successful retest. Entry: $0.00304–$0.00308 after confirmation. SL/invalidation: Around $0.00276, below the short-term MA7 area. TP1: $0.00320 TP2: $0.00340 TP3: $0.00360 These are conditional technical targets, not guaranteed outcomes. The bearish alternative is a loss of $0.002684, followed by a move below $0.002631. That would put price back beneath the MA14 and MA28 structure and weaken the breakout thesis. If selling accelerates, I would monitor the $0.002556 support area. Bearish invalidation: A sustained recovery above $0.003038. My thesis is that TRIA has improved its 4H structure, but the breakout is not fully confirmed while price remains below $0.003038. The elevated volume and bullish moving-average alignment support the recovery, while the rejection at the high warns that sellers are still active. A clean reclaim could open the next leg higher; losing the moving-average support zone would suggest the move needs a deeper reset. $TRIAUSDT #IMPACTbyTrade #ByXIMPACT

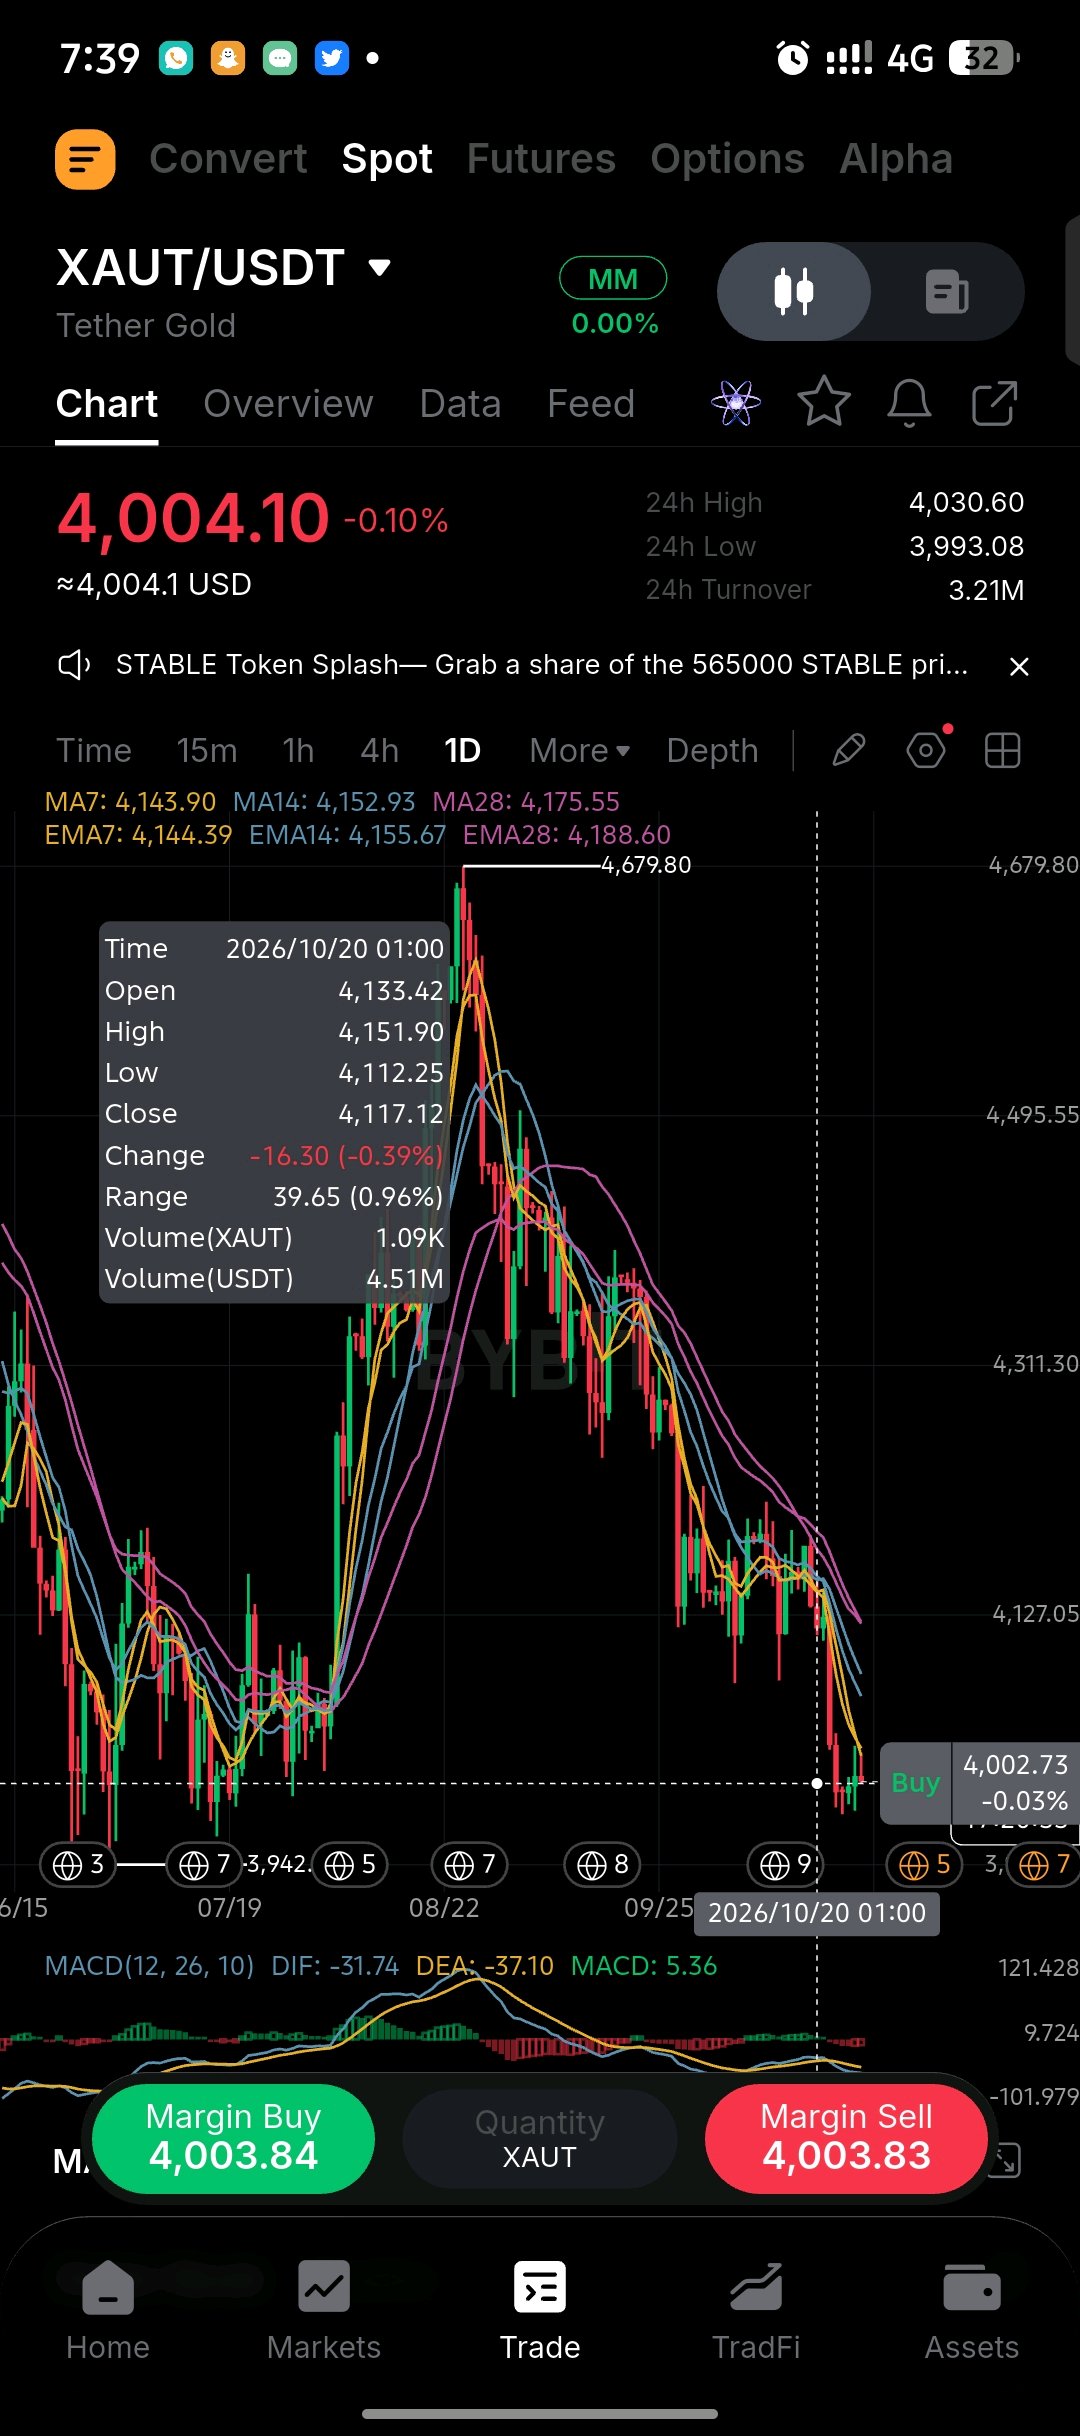
$XAUTUSDT is in a strong downtrend and is falling toward the important 4,000 price level after a big drop from its recent high. Price is at 4,004.10, down 0.10% today. After hitting a high of 4,679.80, the price has been dropping steadily. The daily chart shows the price is stuck at the bottom of the range with no signs that buyers are stepping in to stop the fall. Turnover 24h turnover is 3.21M. A recent 24-hour period showed 4.51M in turnover. This means a lot of money is still trading this asset; it's not quiet. People are actively selling and buying during this downtrend. Volume The current trading volume looks normal, but there is no massive spike in buying. A huge spike in buying is usually what stops a big drop. Because that is missing, sellers are still in control, and the price is likely to keep sliding. Moving Averages MA7: 4,143.90 | MA14: 4,152.93 | MA28: 4,175.55 EMA7: 4,144.39 | EMA14: 4,155.67 | EMA28: 4,188.60 The moving averages are very bearish. Price (4,004) is far below all of them. The lines are pointing down and acting like a heavy ceiling, making it hard for the price to go up. The first big hurdle to clear is the EMA7 at 4,144. Levels to watch · 4,679.80 — The recent high. · 4,188.60 — Heavy resistance above. · 4,144.39 — The first resistance level to beat. · 4,004.10 — Current price. · 4,000.00 — A very important mental support level. · 3,942.00 — The next support level if 4,000 breaks. Consideration The MACD (a trend indicator) is deeply negative but showing tiny green bars. This means the fall is still strong, but maybe slowing down a little. The biggest focus right now is the 4,000 level. If price falls below this big round number, it could cause a fast panic sell. Trade plan · For a bounce: Price must close a daily candle above 4,144 (the EMA7). That is the first real sign of a bounce. · For more downside: If price closes below 4,000, the fall will likely continue toward 3,942. · Main strategy: Until price gets back above the moving averages, the safest play is to sell when the price bounces up near 4,144. Support and resistance Support: 4,000.00 (Big round number) → 3,942.00 (Next historical low) Resistance: 4,144.39 (EMA7) → 4,175.55 (MA28) → 4,188.60 (EMA28) Invalidation and risk note The downtrend is only "paused" if a daily candle closes above 4,155. The main risk right now is losing the 4,000 level. If it breaks below 4,000 with high volume, expect the price to drop very quickly. #XAUTUSDT #ByXIMPACT

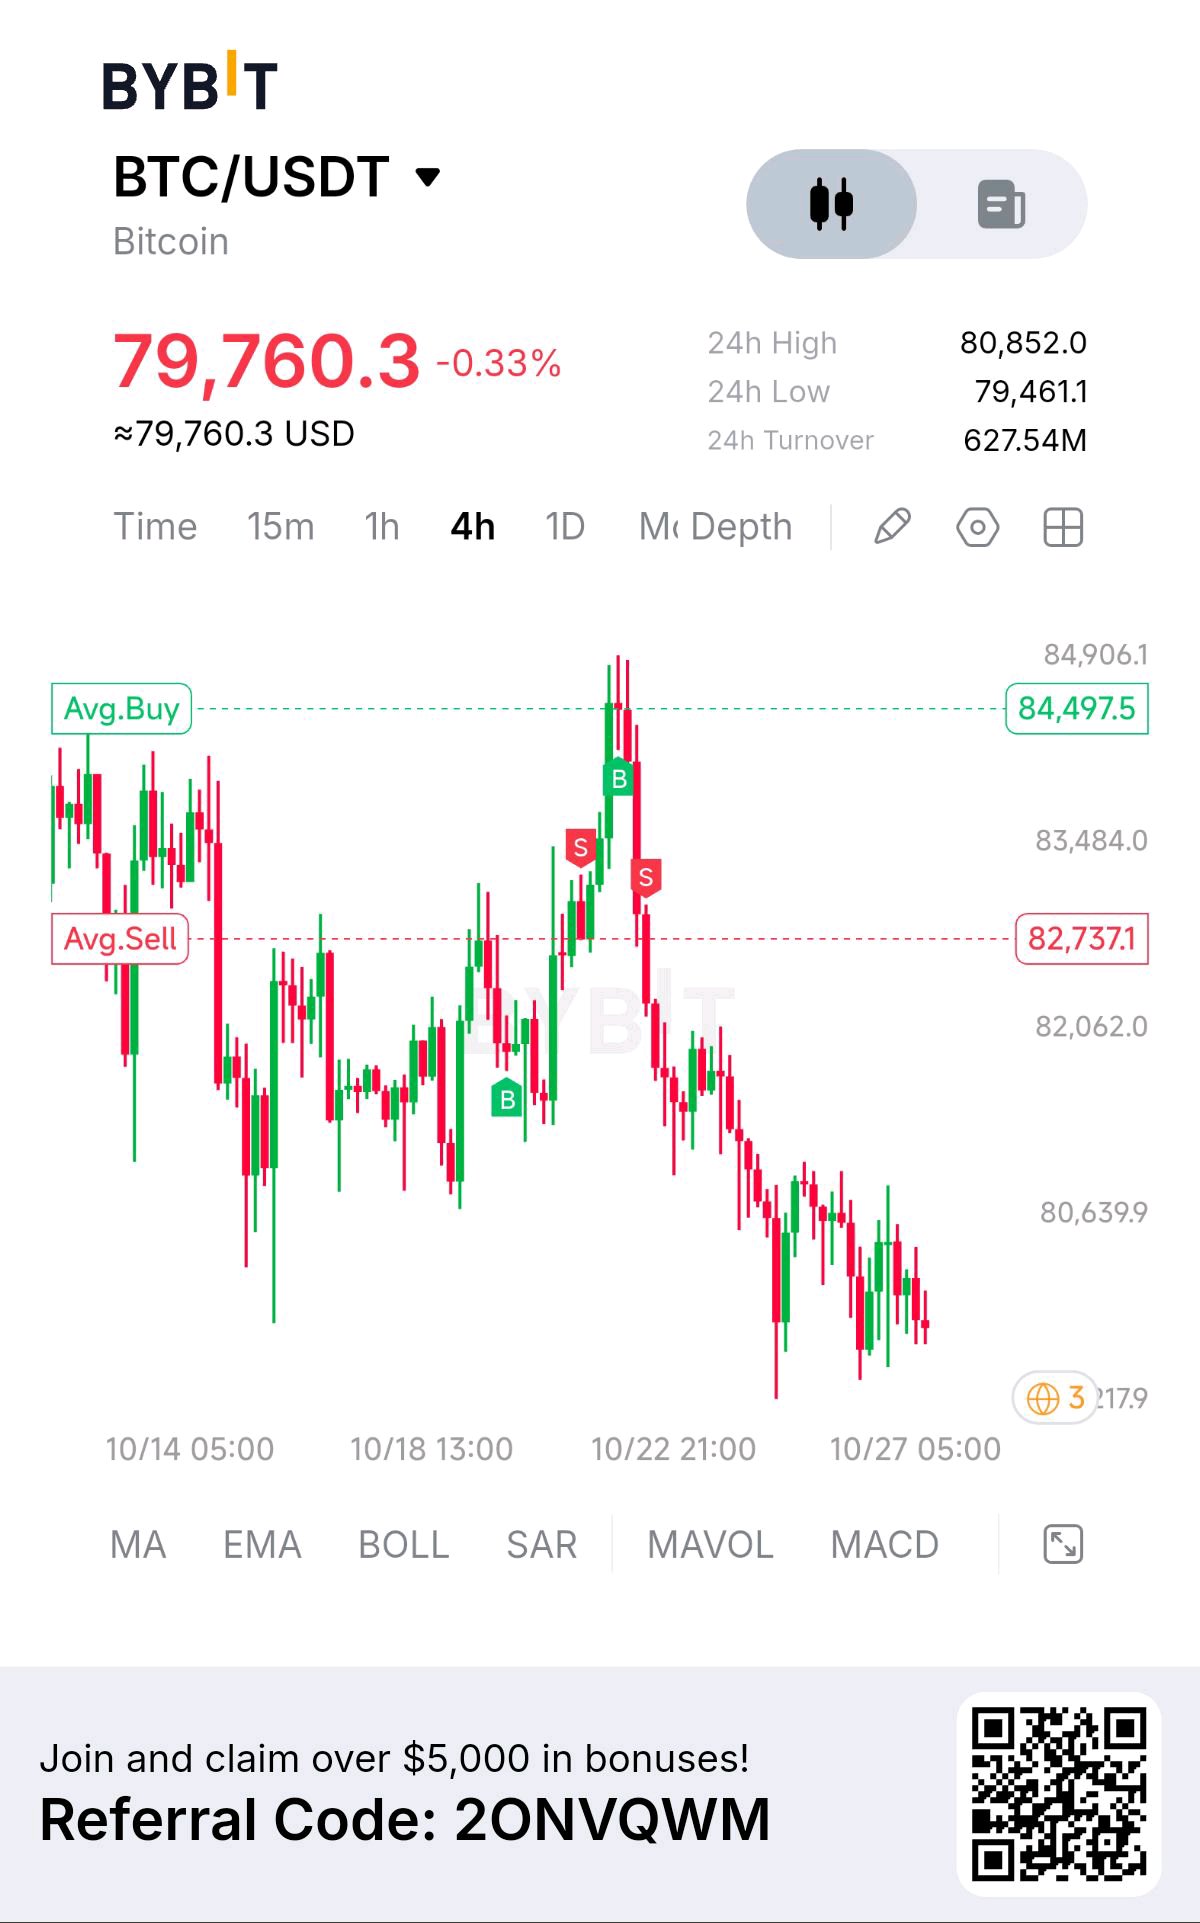
📉 Bitcoin (BTC) 4H Update: Key Levels to Watch
Bitcoin is trading around $79,760, showing continued bearish momentum on the 4-hour chart. BTC has dropped from the $84,500 area and is currently struggling to regain bullish strength. 🔑 Key Levels 🟢 Support Zones - $79,450 — Immediate support - $79,000 — Psychological support - $78,500 — Next potential downside area 🔴 Resistance Zones - $80,000–$80,200 — First resistance - $80,600–$80,850 — Stronger resistance - $82,060 — Major recovery level 📊 What to Watch Next? • A break below $79,450 could open the door to further downside toward $79,000 and $78,500. • If BTC reclaims $80,200 and holds above it, a recovery toward $80,600–$80,850 becomes possible. • Until buyers regain control, the 4H trend remains bearish. ⚠️ Beginner Tip: Avoid rushing into trades. Wait for a breakout or a confirmed rejection at key levels, and always use proper risk management.$BTCUSDT $BTCUSDC #WSOT2026 #AnthropicS1Filing #IMPACTbyTrade #MyByXTake #MidtermsMarketWatch

Lava Network Pushes Into RWA!
$LAVAUSDT Lava Network is making a notable move beyond its usual infrastructure narrative. The project has signed a non-binding agreement with developer BHL Group to design a tokenization sandbox for Alba Bay, a planned Caribbean residential project with over 40,000 housing units. This marks Lava's first real-world asset (RWA) mandate. The key detail here: no units are tokenized yet, and no infrastructure is deployed. Lava's role is coordination and ecosystem support, with a usage-based fee model rather than fixed fees or token grants. For a project focused on RPC and modular data infrastructure, this opens a new angle. The question is whether the sandbox moves beyond planning. What's your take on infrastructure protocols entering RWA? 👇 #ByXIMPACT #IMPACTbyTrade

$XRP/USDT I’M NOT CHASING THIS MOVE. HERE’S WHY.
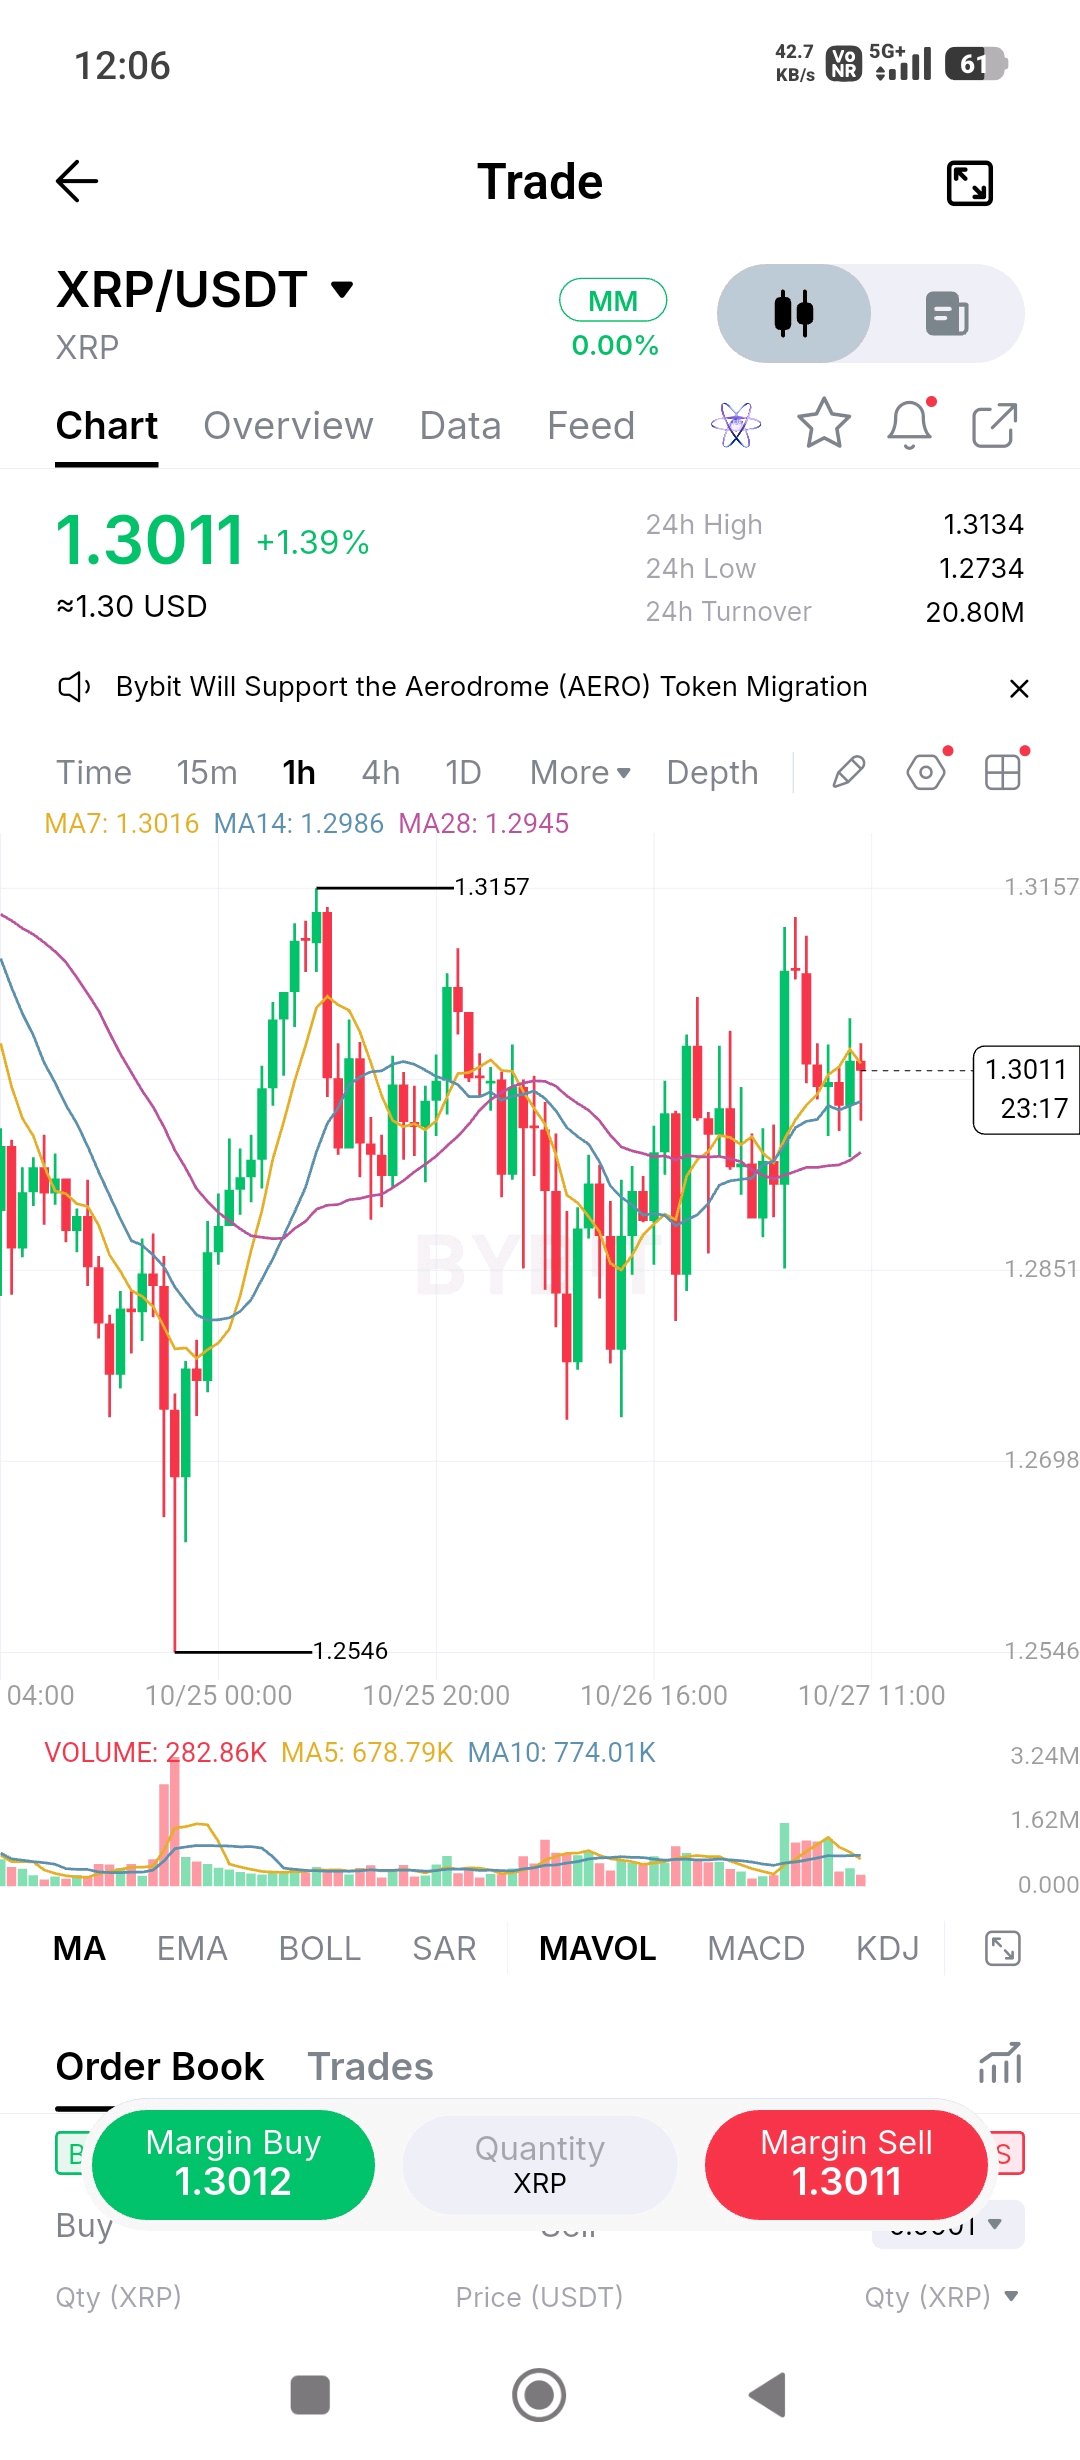
I’ve been looking at XRP’s 1H chart, and one thing stands out to me: price has recovered from $1.2546, but it still hasn’t convincingly broken above the recent resistance zone. At the time of my Bybit screenshot, XRP was trading around $1.3011. My reasoning is simple. The price is sitting near its short-term moving averages. That tells me the next move needs confirmation. I don’t want to mistake sideways movement for a breakout, especially when price has already faced rejection near $1.3157. Here’s how I’m approaching it: If XRP breaks above $1.3157 and holds on a retest: I’ll consider that stronger evidence that buyers are regaining control. . If XRP loses $1.2945 and struggles to recover: I’ll become more cautious and watch the $1.2851 area. Why am I waiting? Because entering without confirmation can leave me buying directly into resistance. I would rather have a clear reason to enter than feel pressured to catch every move. I’m not calling a breakout or a breakdown yet. I want the market to show its hand first. My question to the XRP Holders : What matters more to your decision here the resistance breakout or the way price reacts around $1.2945?$XRPUSDT #ByXIMPACT

SOLUSDT: Real Adoption Catalysts Are Building — But Traders May Be Getting Ahead of the Market. SOL is trading around $100–101, while derivatives positioning is becoming increasingly one-sided. On Binance, open interest rose roughly 3.3% in 24 hours even as price barely moved, and about 75% of accounts were positioned long in the latest available snapshot. That combination deserves attention: leverage is building, but price is not yet confirming a decisive recovery. The fundamental story is stronger than price alone suggests. Samsung Wallet’s late-October rollout of USDC cross-border transfers on Solana targets 82 million U.S. Galaxy devices. That creates a meaningful distribution opportunity—but device reach is not the same as active users, transaction volume, or sustained demand for SOL. Actual usage will matter more than the headline. The conflict: adoption potential is expanding, but leveraged traders are already leaning bullish. Positive funding means longs are paying shorts, while recent forced closures have been concentrated among longs. If spot demand does not strengthen, crowded positioning can turn a modest pullback into a sharper flush. What matters next: SOL needs to reclaim and hold the $102–103 area with stronger spot participation to support a recovery thesis. Failure to hold near $99–100, especially alongside falling open interest and long liquidations, would point to leverage unwinding rather than healthy consolidation. These are monitoring levels, not guaranteed turning points. Bottom line: Solana has a credible adoption catalyst, but the near-term trade depends on whether real buying can catch up with bullish positioning. Watch spot follow-through—not just the headline$SOLUSDT #ByXIMPACT #WSOT2026 #MyByXTake

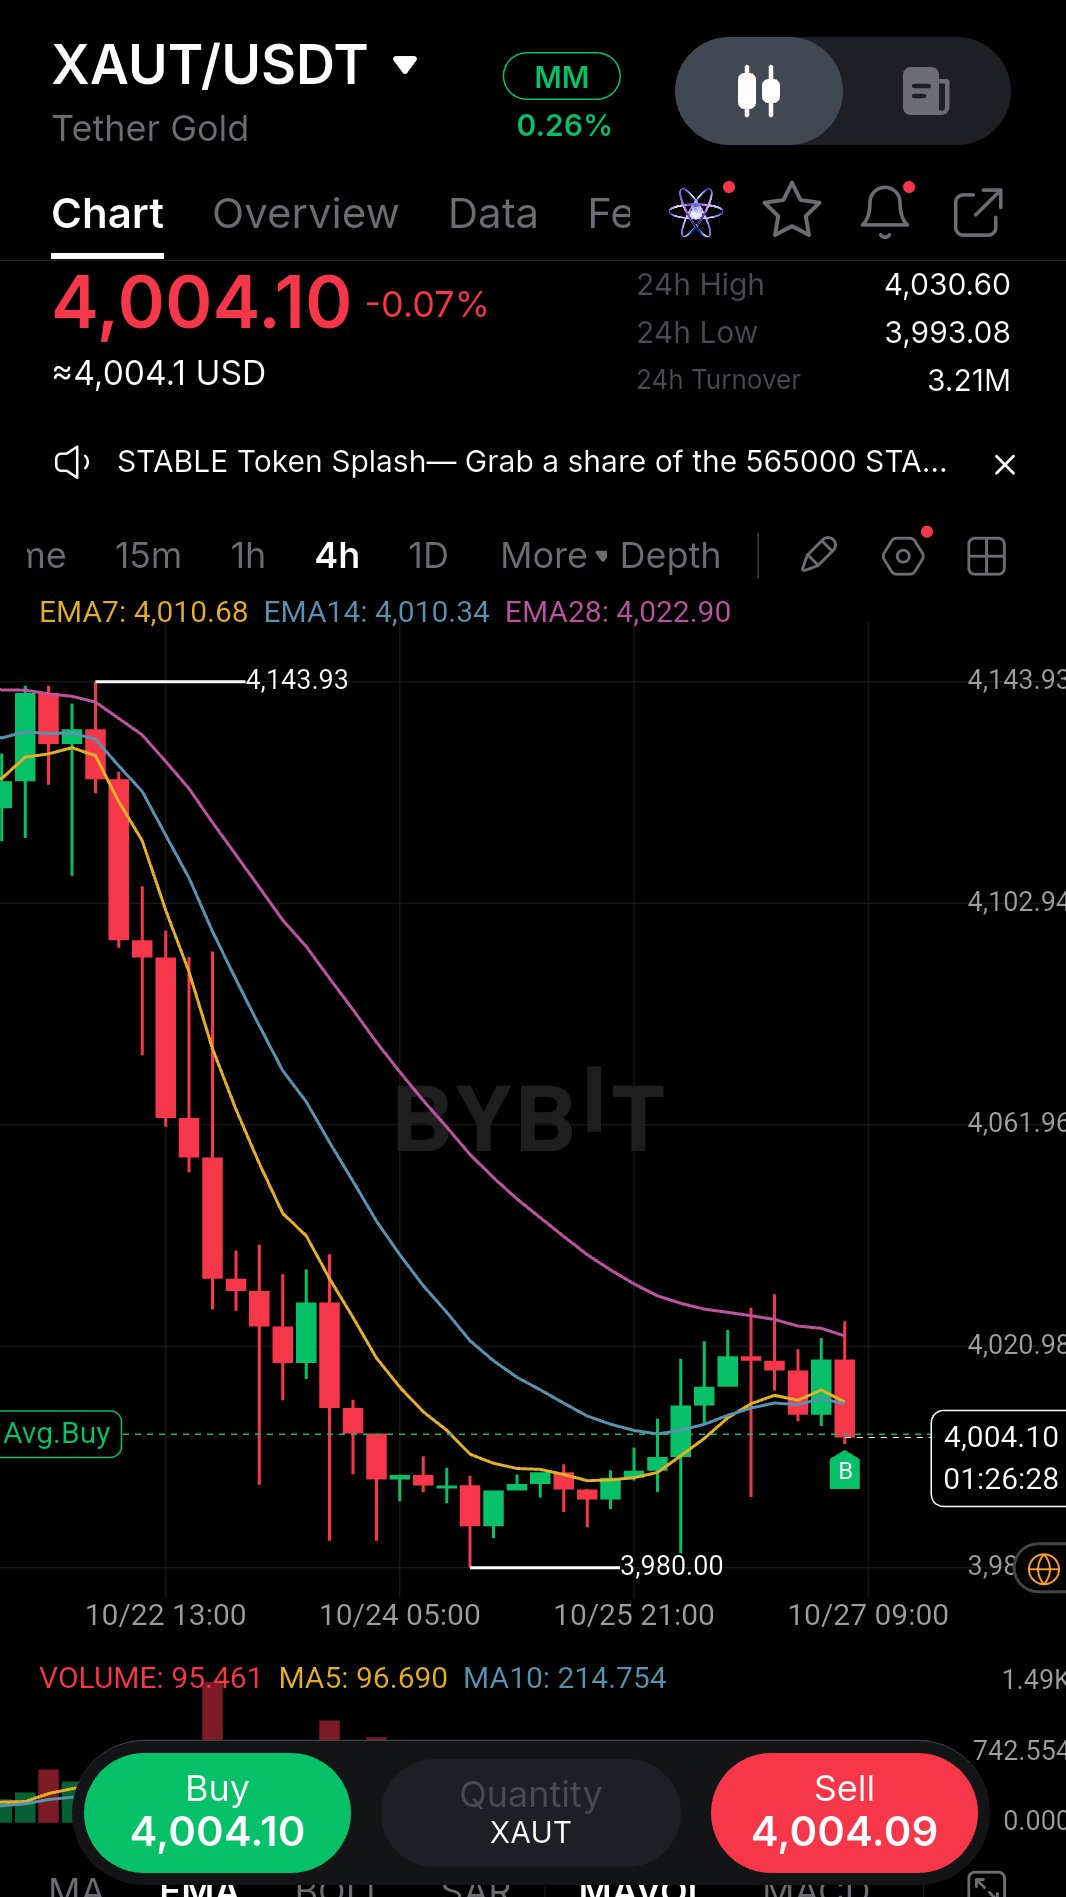
Mastering Gold On Bybit. The global bullion market meets high-speed crypto execution on Bybit. Tether Gold (XAUT) is currently hovering at $4,004.10, down a marginal -0.07% over the past session. Price action shows heavy battle lines drawn between the 24-hour peak of $4,030.60 and the crucial lower support floor sitting tightly at $3,993.08, with total turnover locked at 3.21M. Looking closely at the 4-hour chart structure, XAUT previously faced strong rejection from the $4,143.93 swing top, triggering a sharp descending wave down to a local base of $3,980.00. Following that sweep of liquidity, the asset has initiated a gradual structural recovery, currently consolidating right near the Exponential Moving Average cluster where EMA7 stands at 4,010.68, EMA14 at 4,010.34, and the overhead trend filter EMA28 resting at 4,022.90. This tight compression right beneath the moving averages signals that a decisive volatility expansion is loading. If buyers successfully flip the EMA28 resistance line into support, we could see a powerful push back toward mid-range targets. Lock in your positions and trade the gold standard with maximum efficiency. $XAUTUSDT #WSOT2026 #AnthropicS1Filing #IMPACTbyTrade #MyByXTake #ByXIMPACT


$SOL: Медвежий сетап на локальном отскоке 📉
Solana $SOLUSDT находится под серьезным давлением продавцов. Текущая техническая картина на младших таймфреймах указывает на высокую вероятность продолжения нисходящего движения после локальной коррекции к уровню сопротивления. 📊 * Направление: SHORT (на отскоке) * Зона входа: $100.25 – $100.50 * Стоп-лосс: $100.95 (отмена сценария при закрытии свечи на 15м выше этого уровня) * Тейк-профиты: * TP1: $99.65 * TP2: $99.30 * TP3: $98.90 🔬 Фундаментальные и технические аргументы * Трендовый контекст (Таймфреймы 15м и 1ч): Цена уверенно закрепилась ниже скользящих средних (MA) как на 15-минутном, так и на часовом графиках. Это подтверждает доминирование медвежьей инициативы на внутридневной дистанции. Любые попытки покупателей перехватить инициативу пока гасятся на подходе к динамическому сопротивлению. * Локальная структура и положение у минимумов: Актив торгуется вблизи минимальных отметок текущих суток. Подобное поджатие к локальным поддержкам часто предшествует их пробою, однако перед импульсом вниз крупные участники рынка часто стремятся собрать ликвидность через технический отскок вверх — именно поэтому вход планируется на ретесте зоны MA (около $100.3). * Оценка рисков и соотношение риск/прибыль: * Риск: Ограничен жестким стопом за локальным экстремумом ($100.95). Рекомендуемый риск на сделку — не более 0.5% от депозита. * Потенциал: Цели расположены на ключевых уровнях поддержки, где ожидается фиксация шорт-позиций. Пробой минимумов дня может ускорить движение к TP3. > Криптовалютный рынок сопряжен с высокими рисками. Данный анализ отражает текущую рыночную структуру и не является прямым финансовым советом. Управляйте рисками осознанно. #WSOT2026 #IMPACTbyTrade #MyByXTake #ByXIMPACT

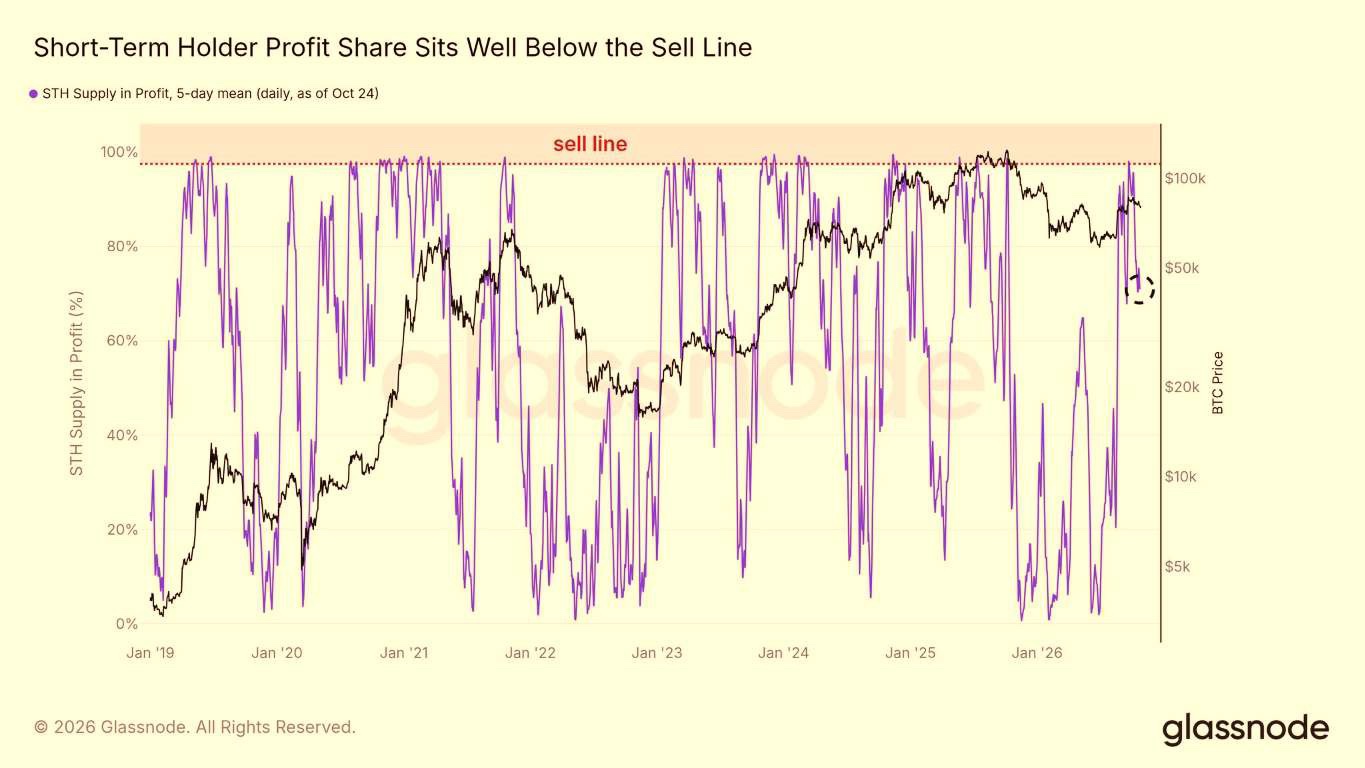
Glassnode data shows Bitcoin's Short-Term Holder (STH) supply in profit is still sitting below the 100% sell-line threshold 📈 What this tells us: • Market hasn't hit extreme profitability yet. • Heavy profit-taking pressure hasn't kicked in. • Historically, room remains before reaching the overheat zone. Watching STH profitability closely as price evolves. Still potential upside before retail sell-offs spike. 📊 #IMPACTbyTrade #Bitcoin #BTC $BTCUSDT

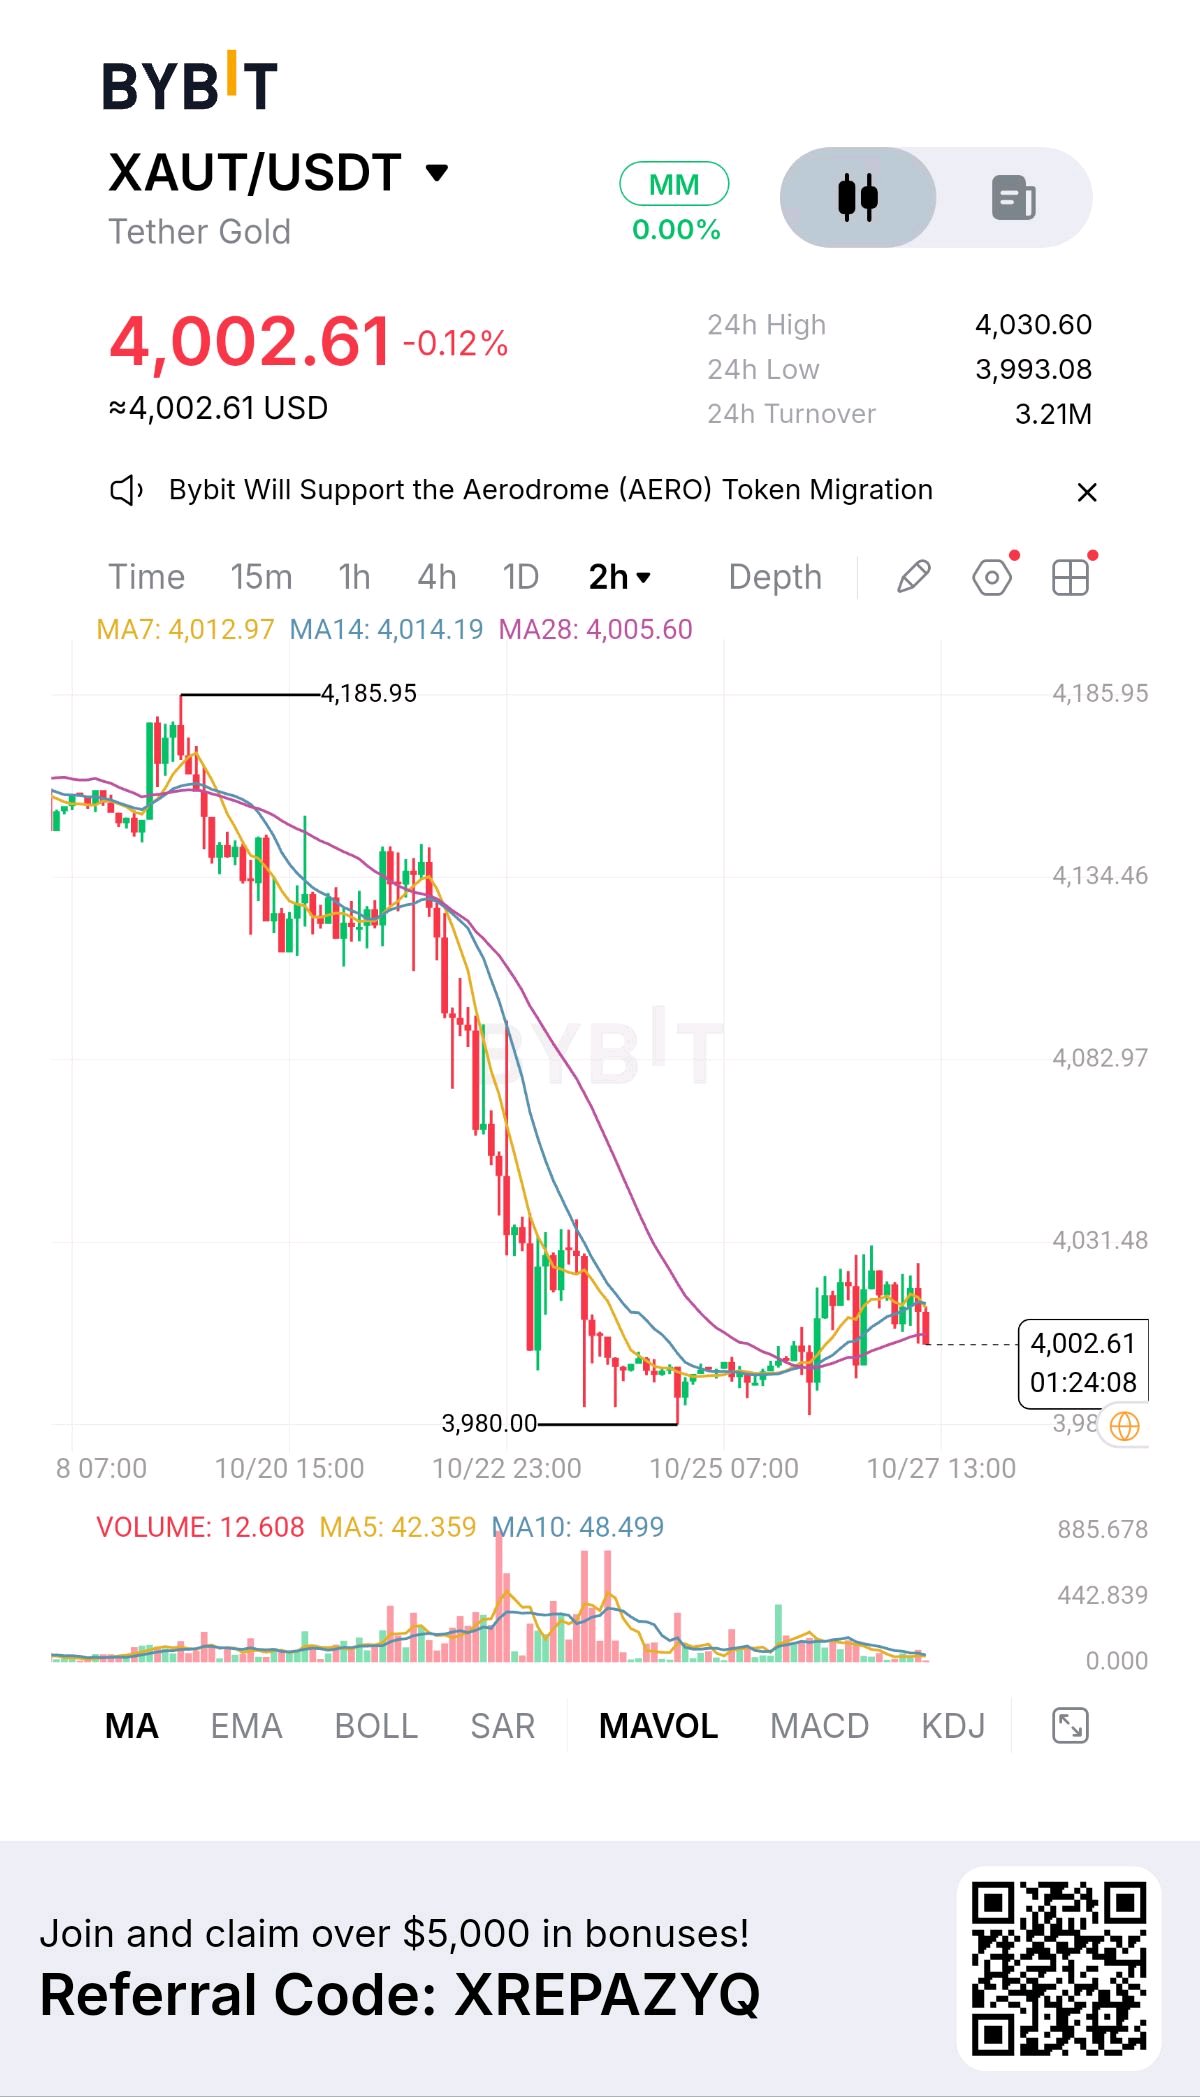
The surprising thing about XAUT/USDT is that gold is hovering around $4,000 even after a sharp sell-off, but the chart still looks weaker than a traditional safe-haven narrative would suggest. I see a potential divergence between gold’s long-term role as a store of value and its short-term price behavior. On Bybit, XAUT is trading at $4,002.61, down 0.12%, with a 24-hour high of $4,030.60, a low of $3,993.08, and turnover of $3.21M. The question is whether $4,000 becomes a base for recovery or merely a temporary pause. The two-hour chart shows a steep decline from $4,185.95 to the $3,980 area, followed by sideways consolidation and a modest rebound. Price is now below MA7 at $4,012.97, MA14 at $4,014.19, and MA28 at $4,005.60. This cluster around $4,005–$4,014 is important: buyers need to reclaim it before a recovery becomes convincing. The first resistance sits near $4,030, followed by $4,083 and $4,134. Support lies around $3,993–$3,980. A clean break below that floor would weaken the stabilization thesis. The macro backdrop explains why gold is struggling despite persistent demand for safe assets. The World Gold Council reported that September gold prices fell 8.5% month over month as rising Treasury yields and a stronger dollar pressured the metal, even while gold ETFs attracted $10 billion in inflows. That divergence suggests some investors were accumulating exposure while futures positioning contracted. It does not guarantee a reversal, but it shows why price alone may not tell the whole story. XAUT also has a different economic model from speculative crypto tokens. Tether reported 707,747 fine troy ounces of physical gold reserves at the end of Q2 2026, backing XAUT on a one-to-one basis. Still, token holders must consider issuer, custody, redemption, and exchange-liquidity risks. My bullish plan would require a reclaim of $4,030 and a successful retest, with a possible entry around $4,032, a stop at $3,990, and a target near $4,134. That offers roughly 2.4:1 reward-to-risk before fees. Bearishly, a confirmed break below $3,980 followed by a failed retest would favor caution, although the screenshot alone cannot justify a reliable downside target. For me, the real signal is whether price can reclaim resistance while broader gold markets stabilize. A hold above $3,980 keeps recovery possible; a breakdown would suggest sellers remain in control. I would watch the dollar, Treasury yields, and the Fed’s next signals before committing to either direction. $XAUTUSDT #IMPACTbyTrade #MyByXTake #ByXIMPACT

TSLAX has rebounded sharply toward $394, but the real question is whether Tesla's renewed momentum can sustain this move—or whether investors are getting ahead of the company's next growth phase. Tesla xStock jumped from around $372 on October 25 to nearly $394 on October 26. Trading activity increased substantially, with one market tracker recording approximately $9.3M in daily volume. The $390–$394 zone is now the immediate decision area, while $380 becomes the first support to watch. The underlying catalyst is Tesla's changing investment story. Its Q3 results showed $1.5B in free cash flow, but net income fell 44% year over year to $787M. Meanwhile, Tesla and SpaceX have formed special committees to explore a potential merger. Discussions are preliminary, and neither a completed transaction nor its terms are confirmed. That creates a tension between improving cash generation and a potentially transformative—but uncertain—corporate development. Tesla shares rose more than 5% on October 26, helping lift the tokenized representation as well. Key figures $394 — Recent rebound area $390–$394 — Immediate resistance $380 — First support $372 — Previous price area $497 — Historical token high $9.3M — Reported October 26 volume Bullish confirmation: Hold above $390 and establish acceptance above $394, supported by Tesla's underlying share price. That would strengthen the rebound and bring $400–$410 into focus. Bearish confirmation: Fall below $380 and fail to reclaim it. That would weaken the recovery and expose the $372–$375 area. TSLAX is responding to Tesla's equity momentum and merger speculation, but neither a strong trading session nor preliminary merger discussions guarantees sustained upside. The signal to watch is whether Tesla can hold its breakout while investors separate measurable business performance from the uncertainty surrounding a possible merger. $TSLAXUSDT #ByXIMPACT

$NVDAXUSDT real business isn't what most people think 🤯💚 $CHIPUSDT Data center revenue reached $193.7B in fiscal 2026, about 90% of Nvidia's $215.9B total 💰 AI computing chips alone brought in about $160B of that, the biggest slice by far 🧠⚡ Networking is growing even faster, up 142% in a year 🔌🚀 Nvidia looks like the toll road of AI, because most big AI builds need its chips and its networking gear 🛣️ The risk: two direct customers made up 36% of revenue, so if either one slows spending, it will show ⚠️ Which number surprises you most? 👇💬 Not financial advice 🚫💸 Follow for more AI and crypto explained simply 🔔💎 #WSOT2026 #ByXIMPACT #2026FinancialPassport #Bybit8thAnniversary #FOMCRateDecision @BybitX @Underrated @killer901



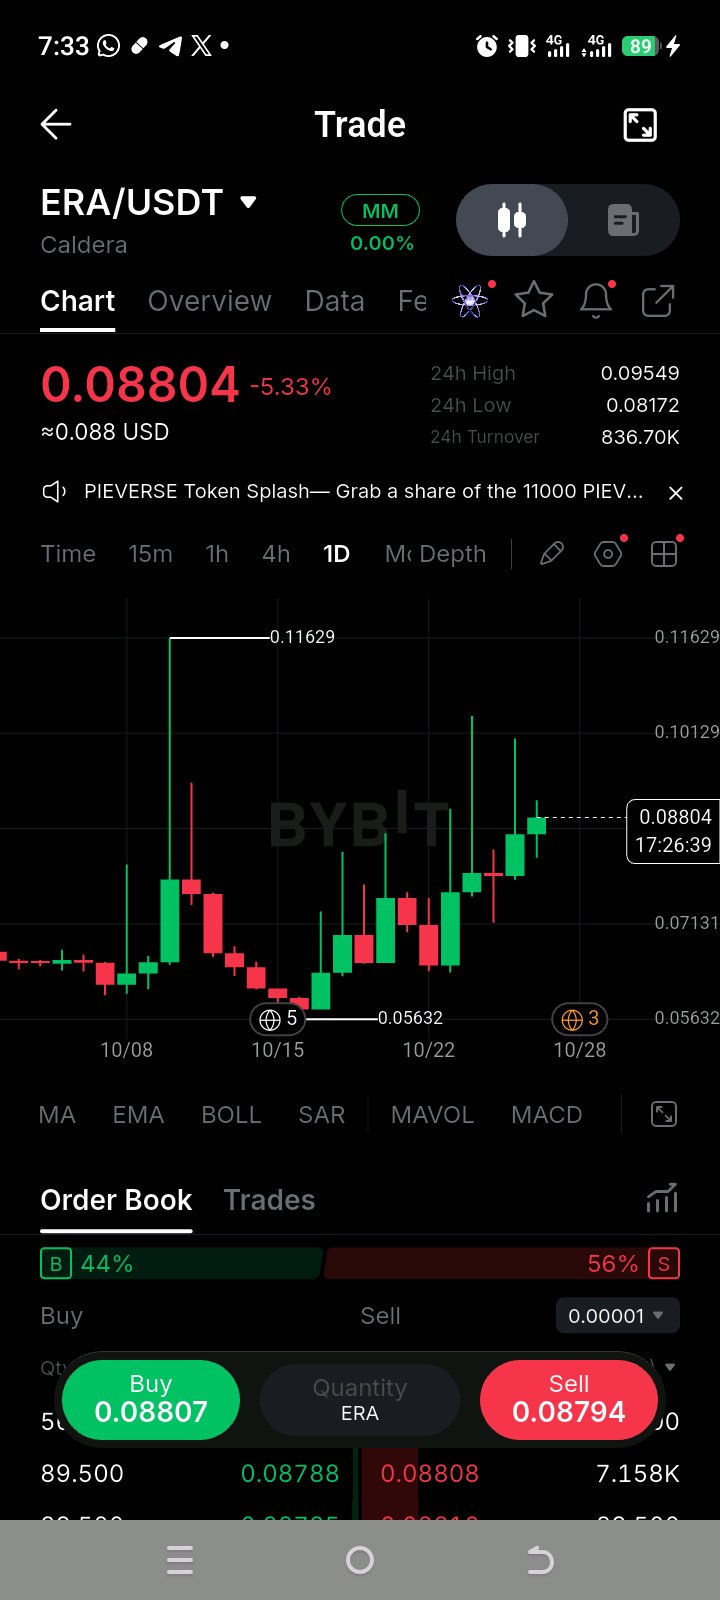
$ERAUSDT: Reversal or a Fakeout? ERA is showing signs of recovery after dropping to 0.05632. Price is now around 0.088, but can the bulls sustain this momentum? Here’s what I’m watching: • 0.095–0.101: Immediate resistance zone. • 0.081–0.083: Near-term support to watch. • 0.1163: A major resistance level from the previous spike. The daily chart is showing improving momentum, but a convincing breakout above resistance would strengthen the bullish reversal thesis. If support fails, another pullback remains possible. No blind entries. Wait for confirmation and manage risk. Do you think ERA is building toward a genuine reversal or approaching another rejection? #IMPACTbyTrade #MyByXTake #WSOT2026

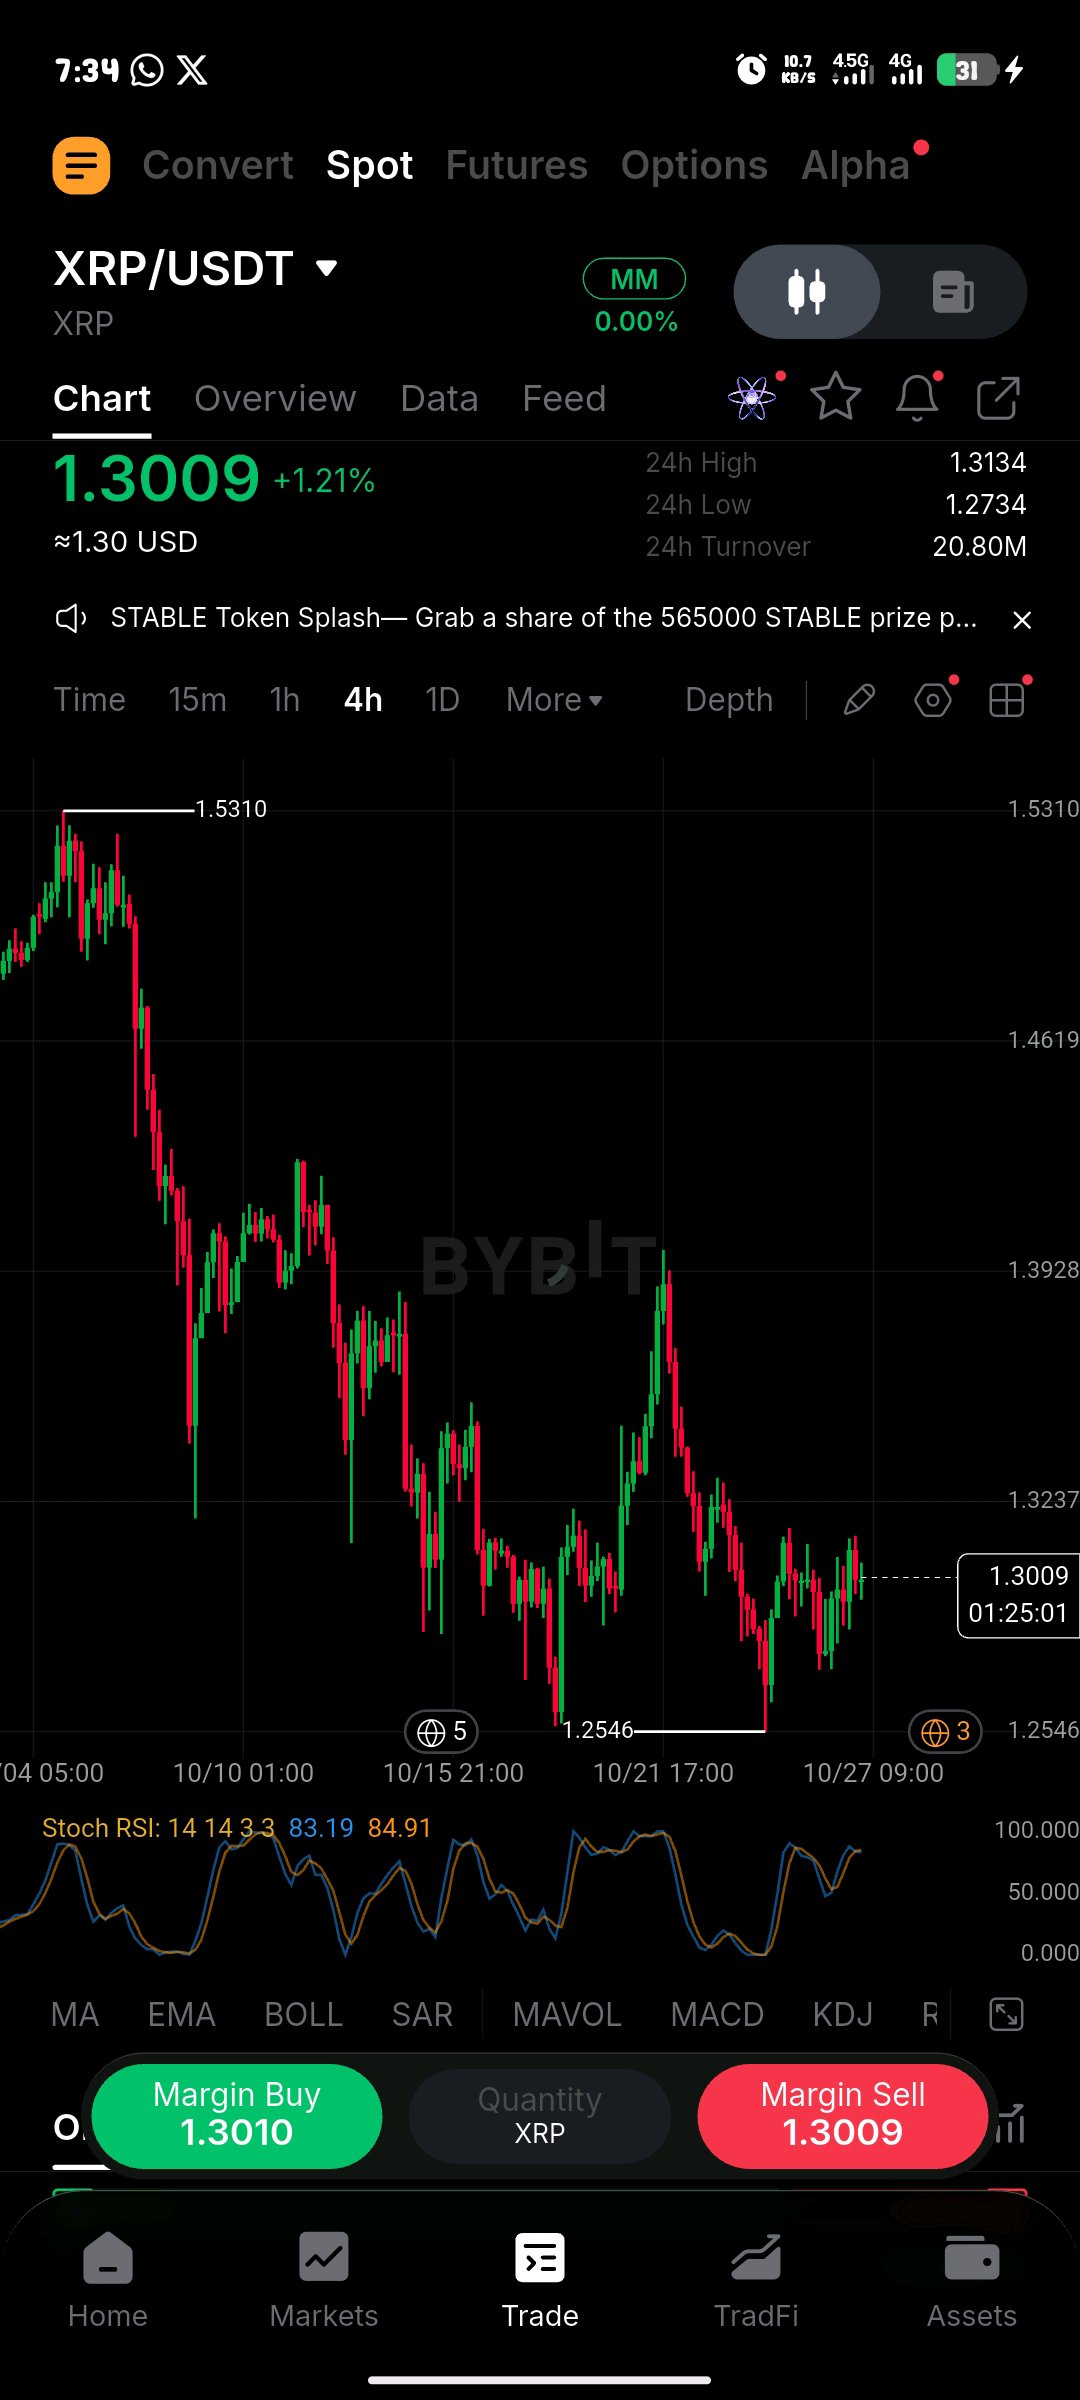
I’ve Analyzed Ripple, Here’s What I’m Watching
$XRPUSDT | Traders, I’ve been analyzing XRP, and honestly, the chart is showing some weakness right now. I’m watching the $1.30 area closely because the way price reacts around this zone could determine the next move. From my analysis, XRP is trading around $1.31, and the short-term structure remains bearish. Momentum is weak, and buyers still need to prove that they can regain control. However, I’m not ruling out a recovery if the market gives us a strong confirmation. Here are the key levels I’m watching. KEY SUPPORT LEVELS Support 1: $1.30 Support 2: $1.28 Major Support: $1.25–$1.26 Lower Support: $1.20 Extended Downside Target: $1.15 KEY RESISTANCE LEVELS Resistance 1: $1.32 Resistance 2: $1.34–$1.35 Major Resistance: $1.37–$1.40 Higher Resistance: $1.46 BEARISH SCENARIO If XRP loses the $1.28 support and confirms a breakdown, I’ll be watching the $1.26 zone next. A clean break below $1.25 could open the door toward $1.20, with $1.15 as a further downside level to monitor. BULLISH SCENARIO On the other hand, if buyers defend the support zone and push XRP above $1.32, I’ll start watching for a possible recovery toward $1.34 and $1.35. If the price breaks above that zone and holds, the next area I’ll be watching is $1.37–$1.40. MY PERSONAL OUTLOOK Traders, I’m staying cautious because the short-term momentum is still weak. I want to see how XRP reacts around $1.28–$1.30 before drawing a stronger conclusion. I’m not going to assume that every bounce is a reversal or that every drop will continue. For me, confirmation is what matters. The main question is whether buyers can defend support or sellers will push XRP lower. What do you think, traders? Are you expecting another move down on XRP, or do you believe buyers are preparing for a recovery? Drop your analysis in the comments. Let’s discuss it together. #IMPACTbyTrade

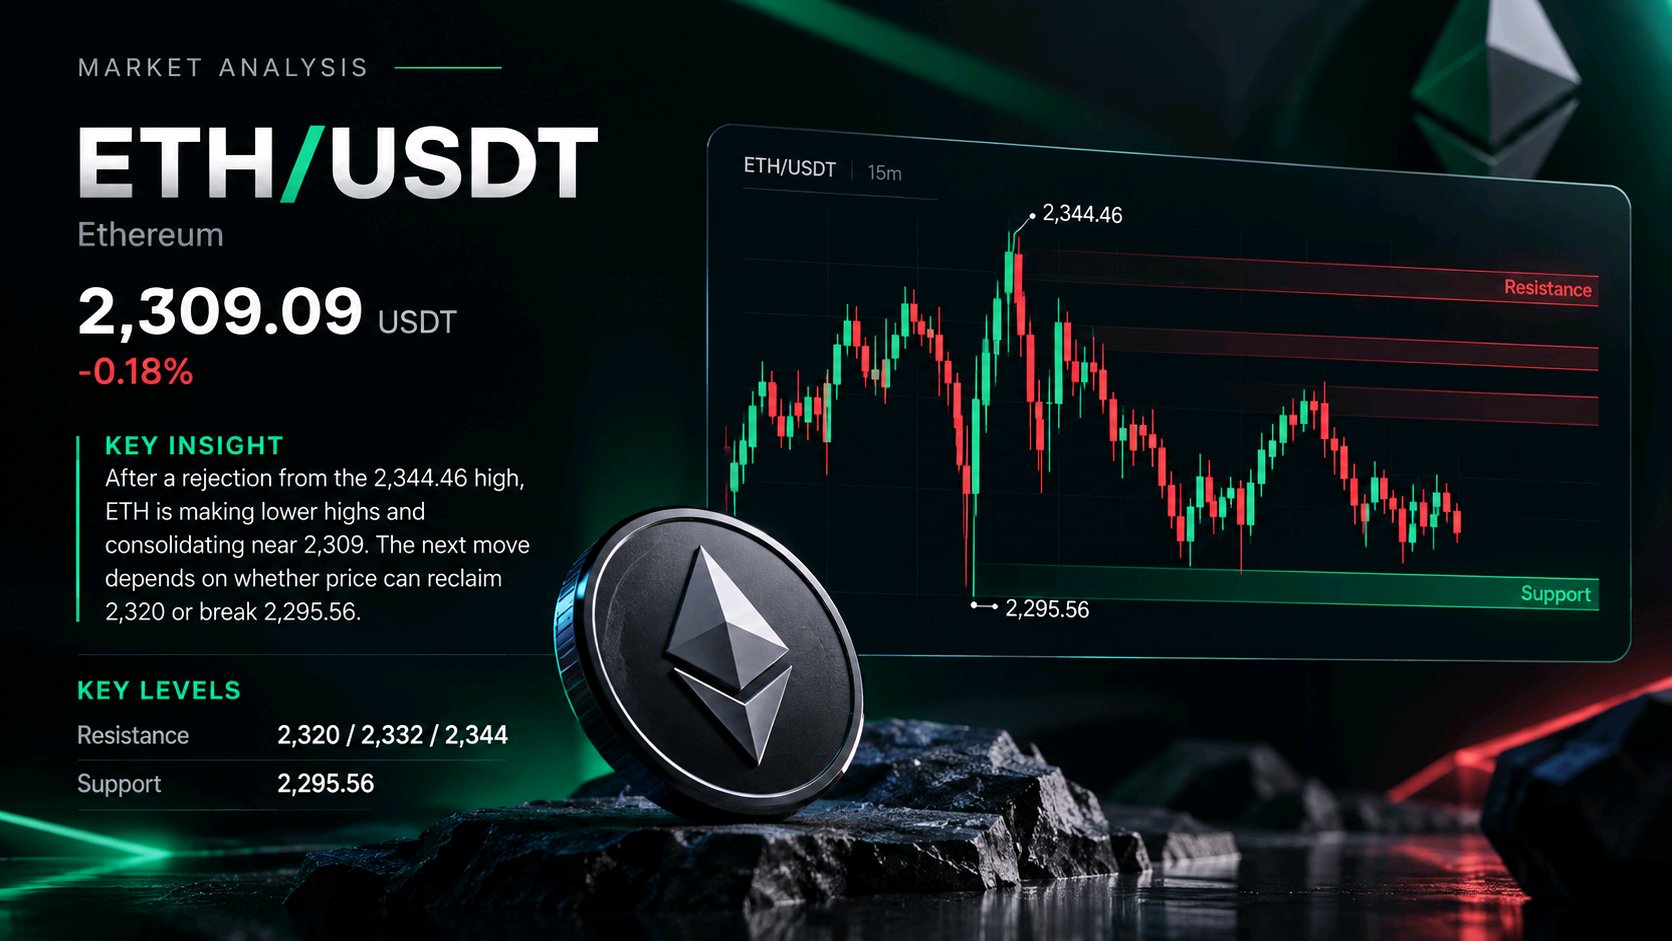
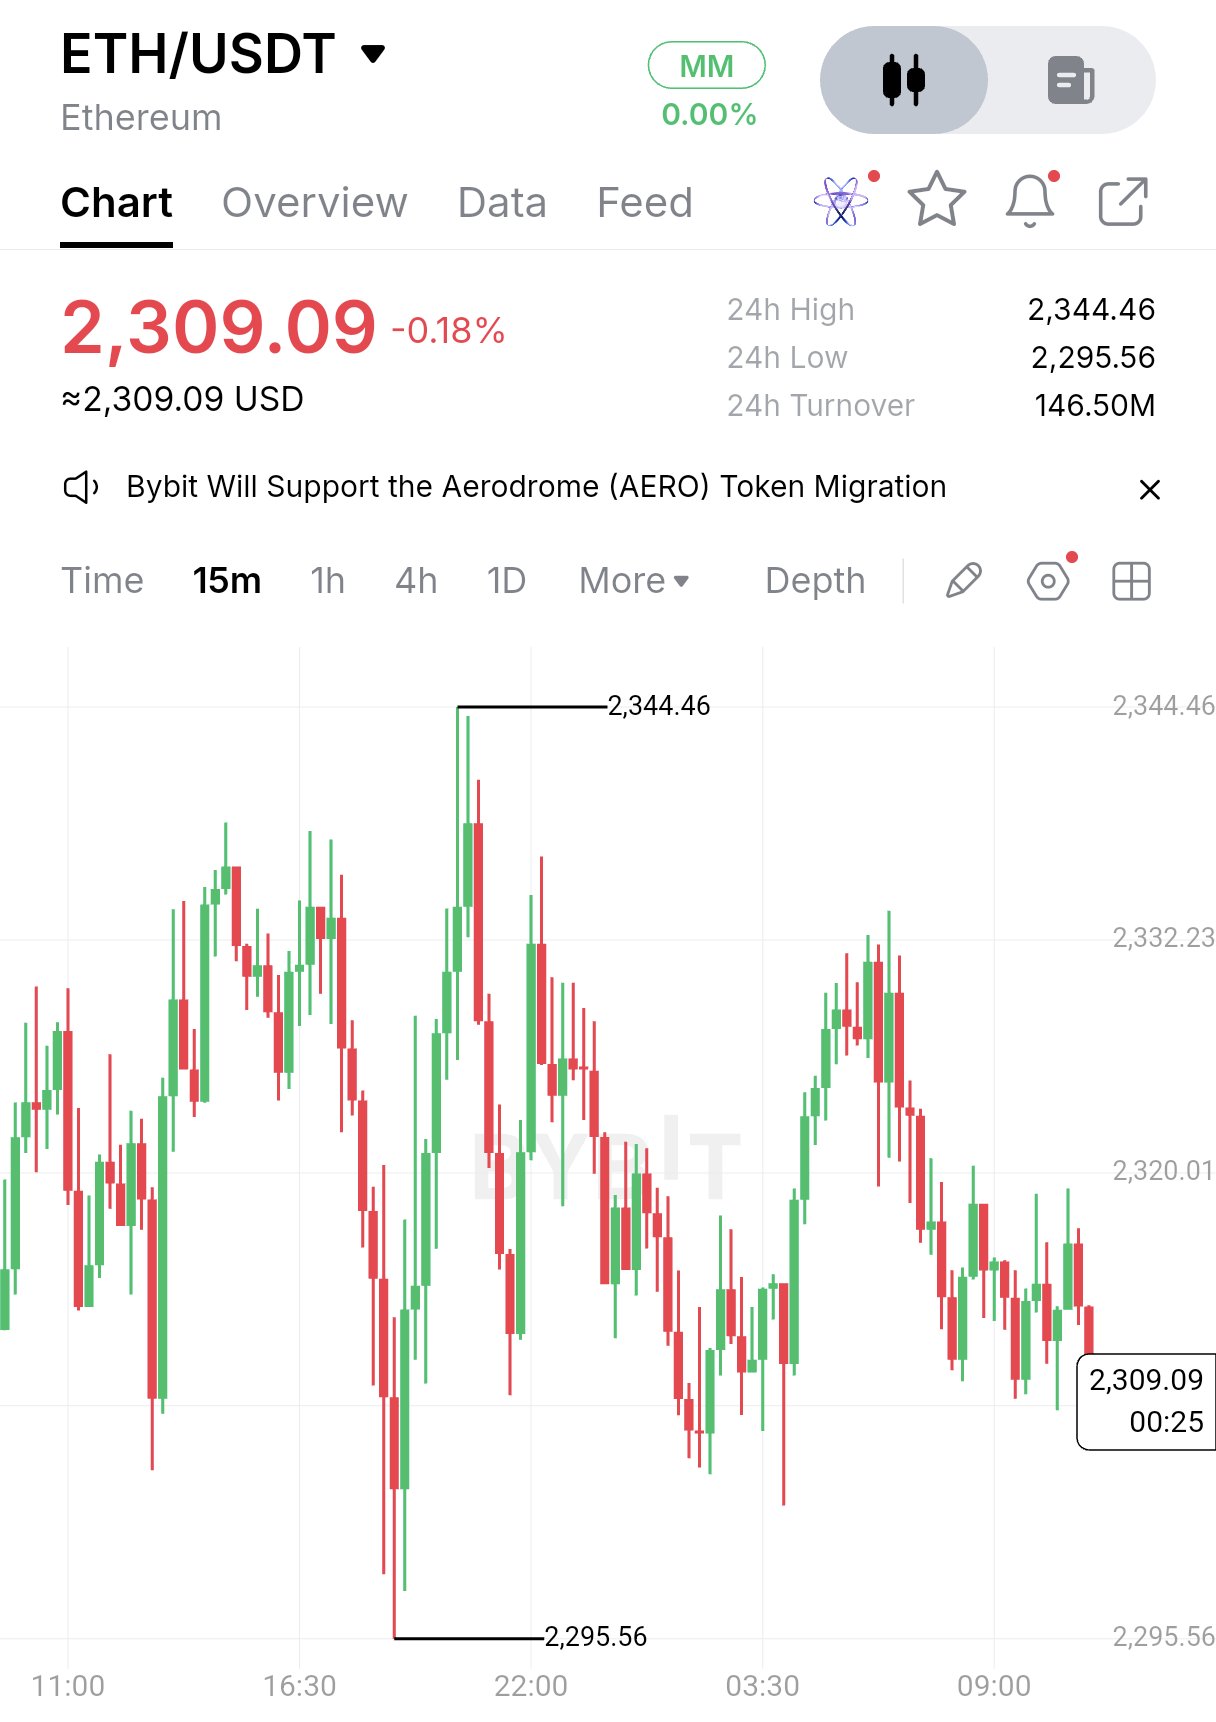
$ETHUSDT is sitting around $2,309.09 on the 15-minute chart, down 0.18%, and the structure looks indecisive after a sharp rejection from the $2,344.46 high. Price has been making lower highs from that peak, while the latest candles are consolidating close to the $2,309 area. The key support is around $2,295.56, which held after the earlier sell-off. Above, $2,320 is the first level to reclaim, followed by the $2,332 area and then $2,344. A sustained move back above $2,320 could improve short-term momentum toward those resistance zones. If $2,295.56 breaks decisively, the recent range structure would weaken and sellers could gain control. For now, ETH looks more like a waiting game than a clean breakout setup. $ETHUSDC #ByXIMPACT
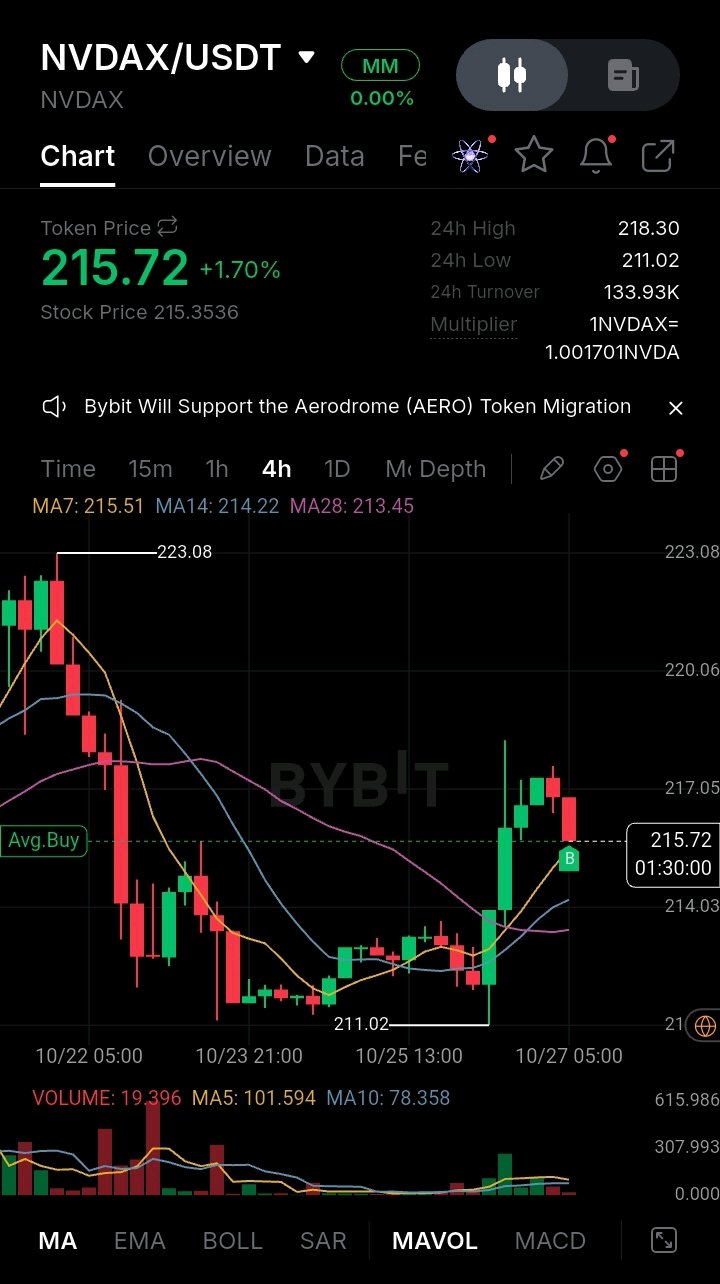
🔍 Market Analysis: $NVDAXUSDT Bullish Rebound & Trend Reversal (4h Chart) 📈 NVDAX/USDT is showing a strong bullish recovery on the 4-hour timeframe, currently up +1.70% and trading at 215.72. After testing a local low of 211.02 and rebounding from previous downward pressure, the asset has established a solid base and is forming an aggressive upward momentum wave. ▪️ Technical Setup: The price action has broken back above its key moving average cluster, trading healthily over the MA7 (215.51), MA14 (214.22), and MA28 (213.45). This short-term convergence and upward crossover signal that buyers have reclaimed control after the earlier correction toward the 211 support zone. ▪️ Indicators: The volume profile reflects renewed buying interest following the successful defense of the 211.02 swing low. With the price holding firmly above the moving average stack, upward pressure remains intact, paving the way for a test of immediate overhead resistance near the 218.30 - 223.08 range. ▪️ Outlook: Maintaining position support above the 214.00 - 215.00 zone is vital for continuation. A sustained breakout past local resistance could trigger an accelerated push toward the 223.08 previous high target. ⚠️ Risk Disclosure: High-volatility markets can experience rapid price swings. This analysis is for educational purposes only and does not constitute financial advice. #ByXIMPACT #IMPACTbyTrade #MyByXTake


SOSO is showing a very different picture after the recent supply event: the market absorbed a major unlock, reclaimed its short-term averages, and is now testing whether this recovery has enough strength to continue. The Bybit screenshots show SOSO around $0.3113, up 7.9% over 24 hours, with a $0.2854–$0.3207 range and roughly $508K turnover. The interesting part is how the three timeframes are lining up. On 15M, price is sitting around MA7 $0.3110 and MA14 $0.3107, while MA28 at $0.3126 is slightly above. Momentum has cooled after the sharp rebound, so $0.3126–$0.3207 is the immediate supply area. The 1H structure is stronger. Price is above MA7 $0.3107, MA14 $0.3066 and MA28 $0.2971. The move from $0.2854 into $0.3207 also came with a clear expansion in volume. This suggests buyers have regained short-term control, although the rejection from $0.3207 still needs to be resolved. The 4H chart is where the recovery becomes more meaningful. SOSO has moved back above MA7 $0.2977, MA14 $0.2935 and MA28 $0.2950 after spending several sessions near the lower end of the range. The latest candles also came with increasing volume. But there is a fundamental supply test behind this move. SOSO has a 1B maximum supply and roughly 342M circulating. A major 23.46M-token unlock occurred on October 24, increasing available supply shortly before this rebound. The next scheduled unlock is another 23.46M SOSO on November 24, worth roughly $6.8M at current estimates. That makes demand absorption more important than the headline percentage gain. The positive side is that SOSO is no longer only a data-platform token. SOSO is the native gas and governance token of ValueChain and has utility across SoDEX, including trading-fee discounts, staking and ecosystem functions. ValueChain activity has also become substantial: recent data shows roughly $121M TVL, about $1.86M in fees over 30 days and more than $14B cumulative perpetual volume. This gives the token a stronger fundamental foundation than a pure narrative asset, although protocol growth does not automatically translate one-for-one into token appreciation. Derivatives are comparatively small versus the broader ecosystem. Current SOSO futures open interest is only around the low hundreds of thousands of dollars on CoinGlass, so this move appears less dependent on large leveraged positioning than many high-beta altcoin rallies. That is constructive — but liquidity is also thinner, meaning relatively modest flows can still produce large candles. Macro remains a near-term variable. The Fed meets October 27–28, with 94 of 100 economists expecting rates to remain at 3.75%–4.00% in October, while the Reuters poll showed all 100 expecting another hike in December. A hawkish reaction through the dollar and Treasury yields could pressure smaller altcoins even if SOSO's own structure remains positive. The levels now matter: $0.3207 = immediate breakout resistance. A confirmed 1H/4H move above $0.3207 with expanding volume would strengthen the continuation setup, with $0.33, $0.35 and potentially $0.37 becoming the next areas to watch. $0.306–$0.310 = first recovery support. $0.295–$0.298 = major structural support. Below $0.2854, the current recovery structure is invalidated. Conditional long setup: Confirmation entry: $0.321–$0.324 after a clean breakout with volume. Invalidation: sustained weakness below $0.295. Targets: $0.33 → $0.35 → $0.37. What I like: the 1H and 4H structures have turned constructive, price reclaimed the major moving averages, and the market absorbed a sizeable unlock without collapsing. What I don't like: $0.3207 is still unbroken, liquidity is relatively thin, and another 23.46M-token unlock is scheduled for November. My setup: BULLISH RECOVERY / CONDITIONAL LONG ABOVE $0.3207. The real test for SOSO is no longer whether buyers can produce another green candle. It is whether they can absorb the supply sitting above $0.3207 and turn this recovery into a sustained expansion. Is SOSO building a genuine post-unlock reversal, or is $0.3207 still the ceiling buyers cannot break? $SOSOUSDT #ByXIMPACT

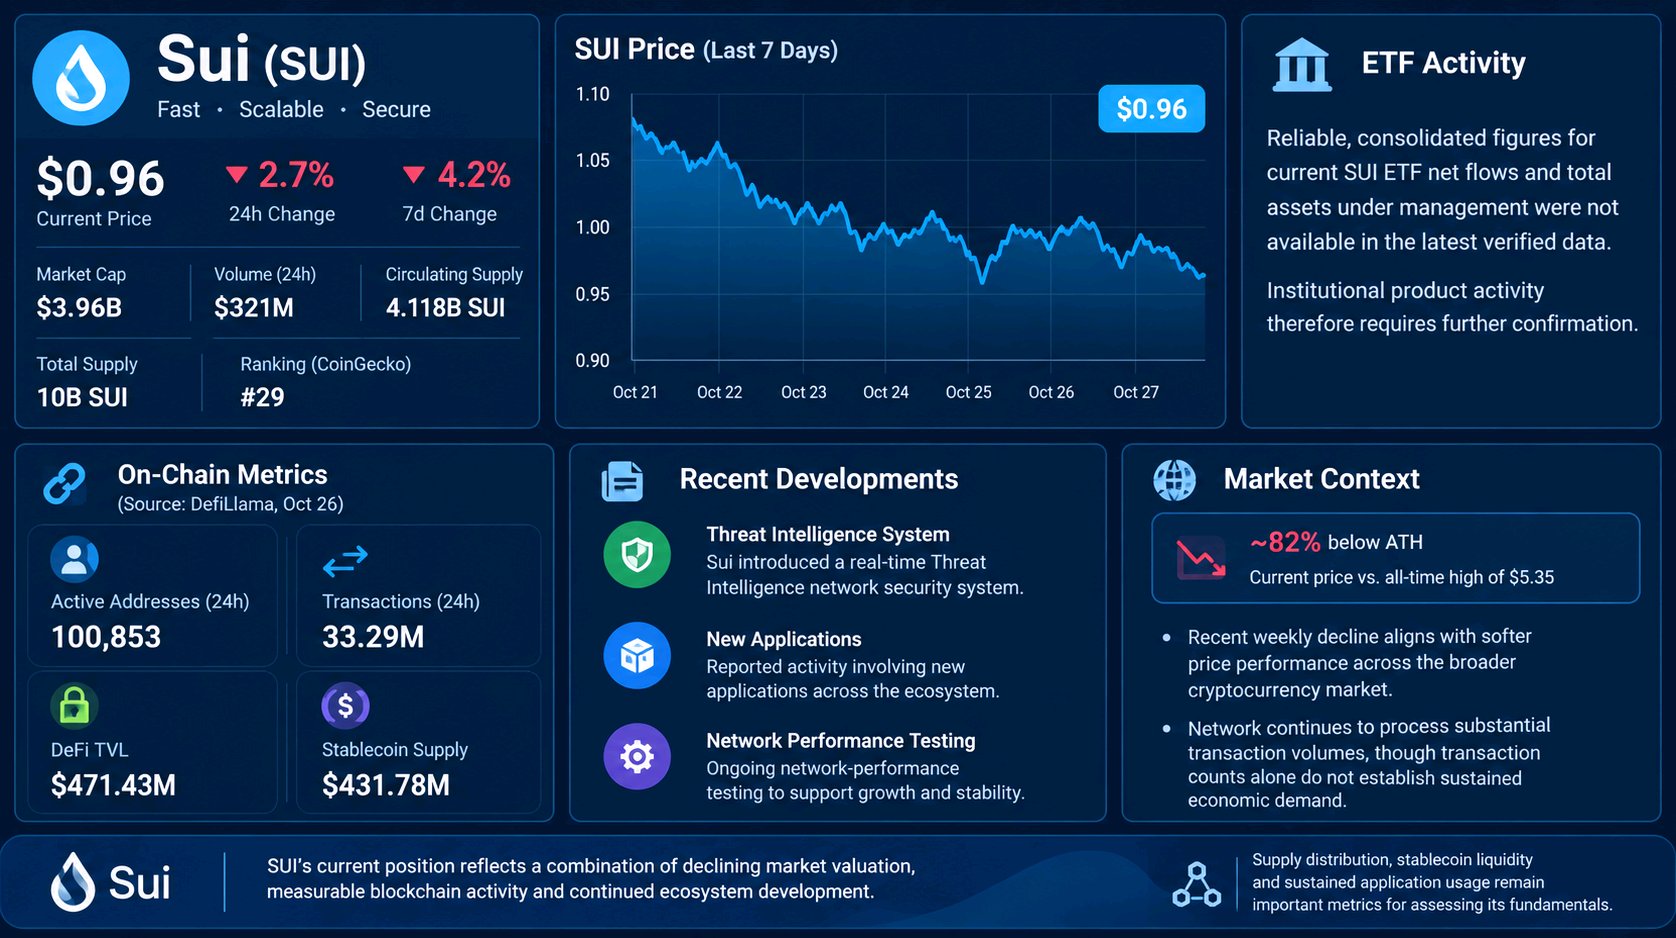
Sui (SUI) is trading near $0.96, with a market capitalization of approximately $3.96 billion, ranking #29 on CoinGecko. Its price has declined approximately 2.7% over 24 hours and 4.2% over seven days. Daily trading volume stands near $321 million. Circulating supply is approximately 4.118 billion SUI, against a maximum supply of 10 billion tokens. ETF Activity: Reliable, consolidated figures for current SUI ETF net flows and total assets under management were not available in the latest verified data. Institutional product activity therefore requires further confirmation. On-Chain Metrics: According to DefiLlama data dated October 26, Sui recorded approximately 100,853 active addresses and 33.29 million transactions over 24 hours. DeFi total value locked (TVL) stood at $471.43 million, while stablecoin supply was approximately $431.78 million. These figures provide a snapshot of network usage and available liquidity. Recent Developments: Recent ecosystem updates include Sui's introduction of a real-time Threat Intelligence network security system, alongside reported activity involving new applications and network-performance testing. These developments highlight ongoing work around security, infrastructure and application development. Market Context: SUI is trading approximately 82% below its all-time high of $5.35. Its recent weekly decline coincides with softer price performance across the broader cryptocurrency market. Meanwhile, the network continues to process substantial transaction volumes, although transaction counts alone do not establish sustained economic demand. Overall, SUI's current position reflects a combination of declining market valuation, measurable blockchain activity and continued ecosystem development. Supply distribution, stablecoin liquidity and sustained application usage remain important metrics for assessing its fundamentals. $SUIUSDT #ByXIMPACT

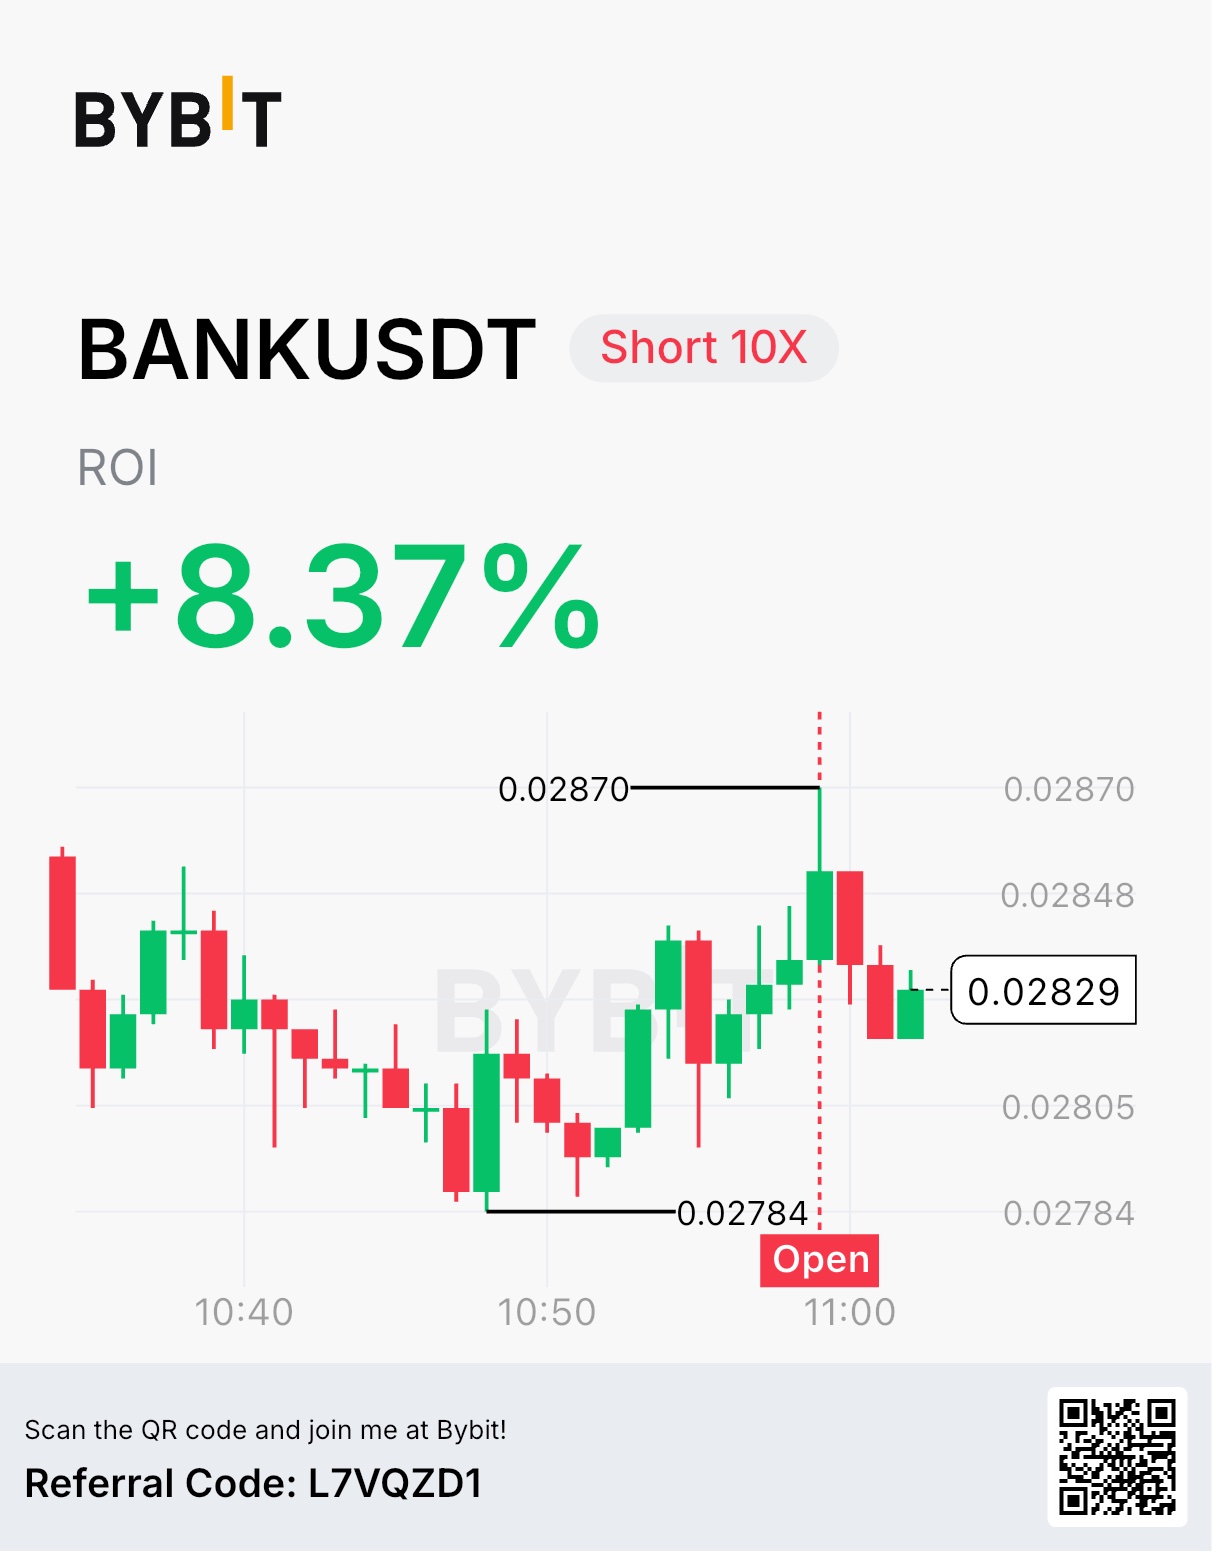
$BANKUSDT: SHORT DYOR🔍🛡️🔍
I am short on $BANKUSDT #Bybit8thAnniversary #ByXIMPACT #2026FinancialPassport #FOMCRateDecision #BybitStocks $SOLUSDT $BTCUSDT

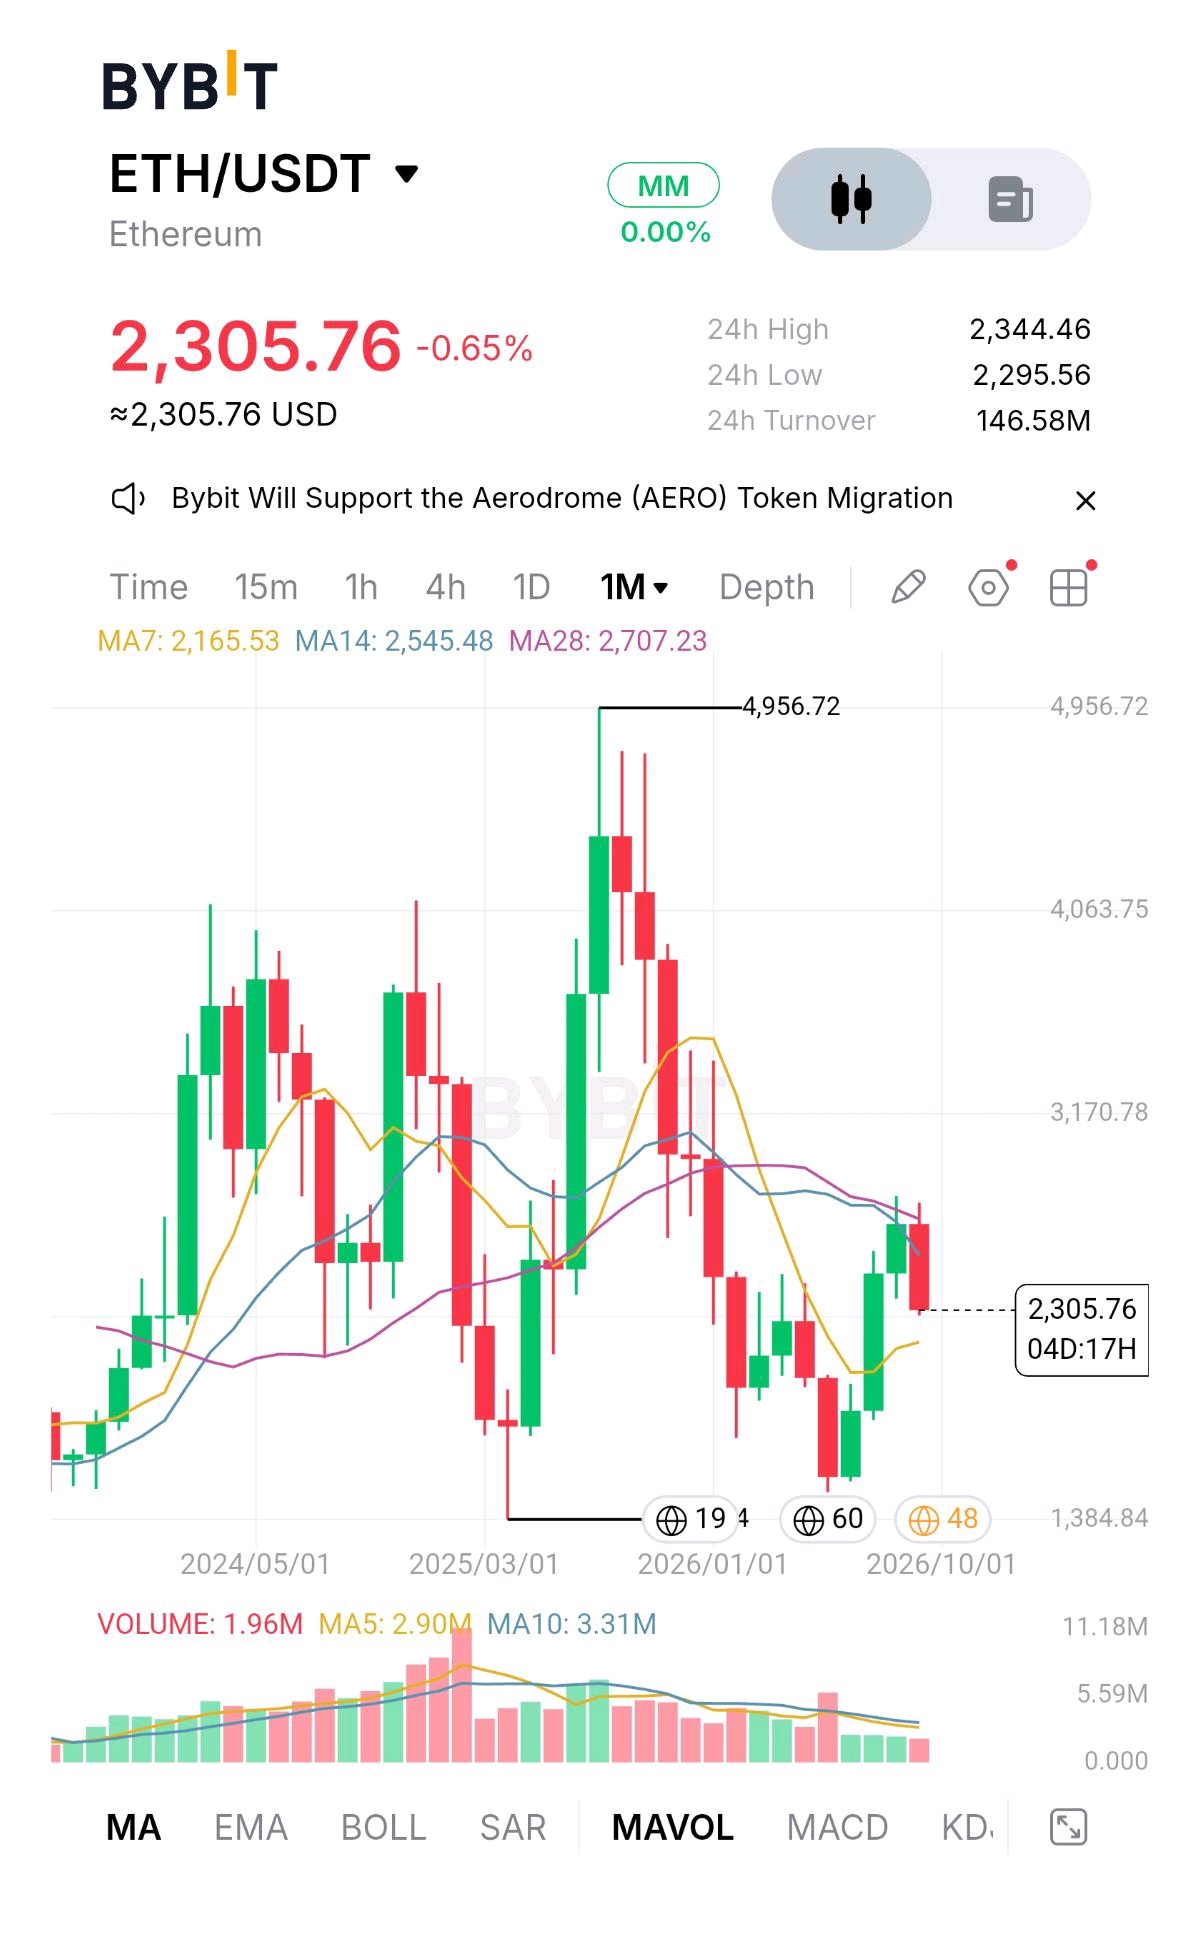
⚡ ETHEREUM (ETH) SITS AT 2,305.98 USDT — DECLINING (-0.65%) ⚡ Ethereum (ETH) is trading at 2,305.98 USDT on the spot timeframe, attempting to defend key psychological ground (-0.65% 24h change) following a tight local consolidation range near recent swing lows under the 2,335.00 USDT zone. MARKET SITUATION Price is currently consolidating around 2,305.98 USDT after testing immediate order book liquidity near the lower range (24h Low: ~2,276.00 USDT / 24h High: ~2,345.00 USDT). Order book depth shows concentrated bids clustered around the 2,305.86–2,305.98 USDT support shelf. MY OBSERVATION Price is hovering right on the edge of the immediate order book demand wall, with tight seller pressure resting directly overhead from 2,306.02 to 2,306.14 USDT. Short-term order book weight shows a delicate balance attempting to absorb incoming market sells. TECHNICAL ANALYSIS Moving Averages: Short-term moving average compression reflects ongoing downside momentum testing local structural floors following recent weekly declines. Candlestick Structure: Price action is exhibiting low-volatility compression right above the critical 2,300.00 USDT psychological floor, with lower wicks signaling tentative buyer defense on retests. KEY LEVELS Resistance: 2,306.14 USDT (Immediate Order Book Wall), 2,335.00 USDT (Local Recovery Resistance), 2,400.00 USDT (Key Structural Pivot) Support: 2,305.86–2,305.98 USDT (Immediate Bid Cluster), 2,276.00 USDT (Recent Monthly Low Floor), 2,250.00 USDT (Major Psychological Support) BULLISH AND BEARISH SCENARIOS Bullish Scenario: A decisive volume reclaim above 2,335.00 USDT opens up momentum toward the 2,400.00 USDT structural resistance zone, with continuation targeting higher liquidity pools. Bearish Scenario: A breakdown below the 2,300.00 USDT psychological floor triggers accelerated liquidations toward the 2,276.00 USDT local low and exposes deeper support near 2,250.00 USDT. ENTRY, TAKE-PROFIT AND INVALIDATION LEVELS Execution Strategy: Long retest on local support / order book absorption Entry: 2,305.50 USDT Take-Profit (TP): 2,385.50 USDT ($80.00 Gain per ETH) Invalidation / Stop-Loss (SL): 2,289.50 USDT ($16.00 Risk per ETH) MOMENTUM AND VOLUME Order book liquidity distribution shows active depth balancing between 2.55 ETH to 11.91 ETH blocks on immediate levels, indicating cautious market participation awaiting a directional volume expansion. RISK MANAGEMENT Maintain disciplined position sizing using max 10x cross leverage. Keep total risk per trade capped strictly at 1–2% of trading account capital. KEY FACTORS TO WATCH 2,300 USDT Defense: Holding above the crucial psychological support zone. Order Book Wall Absorption: Clearing the 2,306.14 USDT ask wall with increasing buy volume. Volume Expansion: Breakout volume confirmation above local consolidation ranges. FINAL TAKE ETH is consolidating delicately right above major psychological support near 2,300 USDT. Dips toward the 2,305.50 USDT zone offer a favorable 5.0R Risk/Reward long entry targeting 2,385.50 USDT with invalidation below 2,289.50 USDT. $ETHUSDT #ByXIMPACT

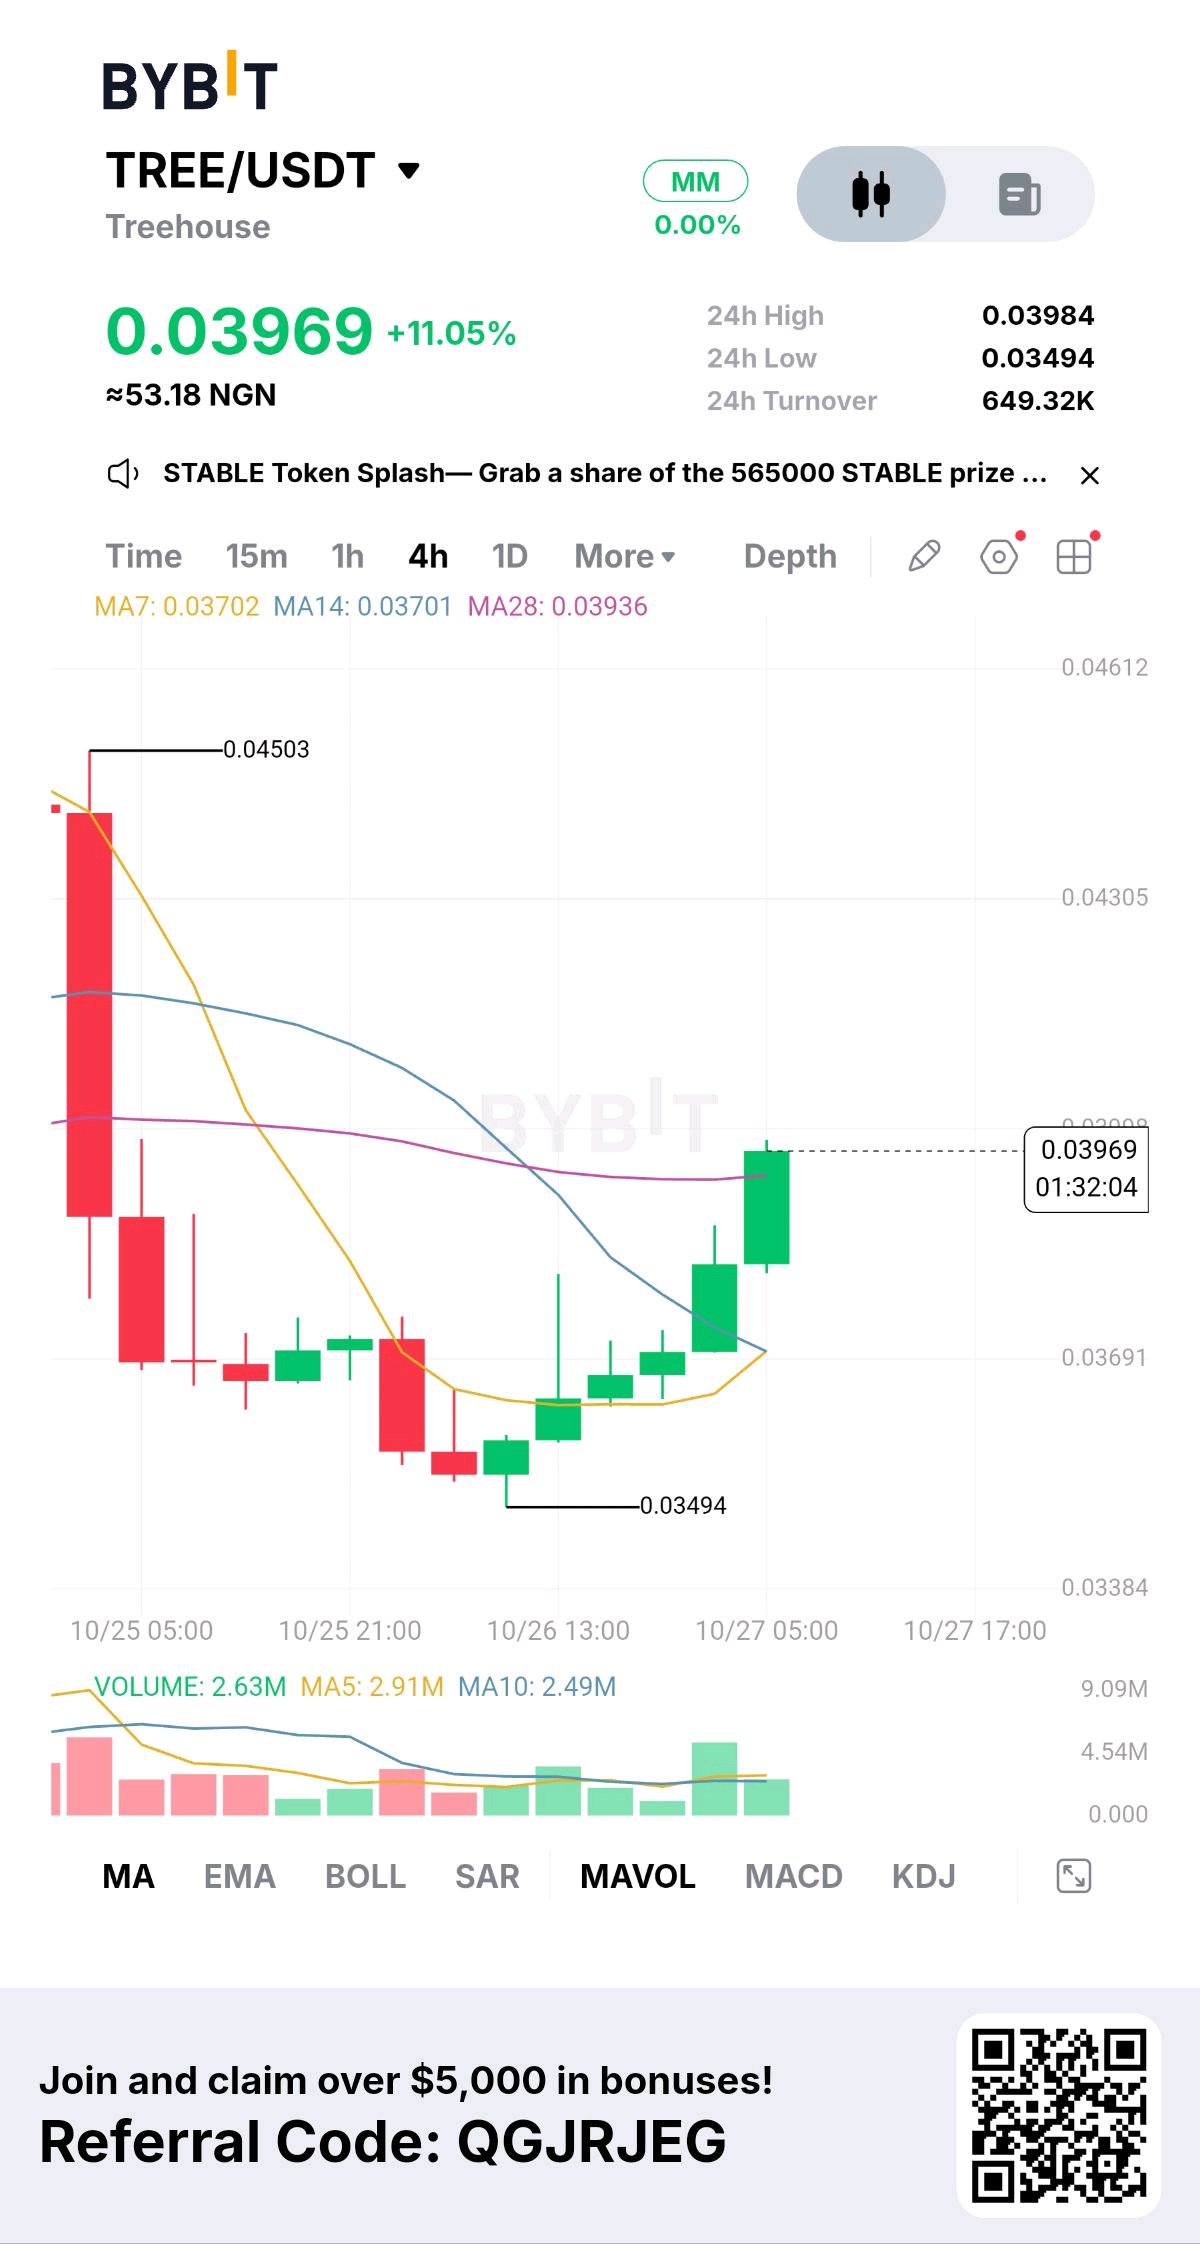
TREE/USDT: Technical Analysis
$TREEUSDT is reclaiming its 28-period average after a sharp sell-off, with a recovery leg in play 📈 Direction: LONG 💰 Entry Point (Market): 0.03940-0.03985 ➕ DCA: 0.03700 🎯 Take-profit targets: 0.04305 / 0.04503 / 0.04612 🛑 Stop-loss: 0.03650 📊 Deep market analysis and rationale * Price dynamics and trend structure: On the 4-hour timeframe, TREE sold off hard from the 0.04503 high on 10/25 and bottomed at 0.03494. Since then it has built a base with higher lows and a run of green candles. Price is now 0.03969 (+11.05% on the day), close to the 24h high of 0.03984, and the current candle is still forming. The 0.04503 swing high and the 0.04305 level above it are the natural resistance zones for a recovery. * Moving averages and volume: Price has pushed up to the MA28 (0.03936) and is trading just above it. MA7 (0.03702) and MA14 (0.03701) have flattened together and are turning up from below. That cluster around 0.0370 is the nearest support and the basis for the DCA level. Volume on the latest bar is 2.63M, below its MA5 (2.91M) but above its MA10 (2.49M). The strongest volume came on the previous green candle, so buyers showed up on the breakout leg. * Risk: MA7 and MA14 are still below MA28, so the trend is not confirmed until they cross above it. A move this fast near the 24h high can also pull back, so a retest of 0.0370 is a normal outcome. A 4h close below 0.03650 would break the base and invalidate the setup. The 0.03494 low is the deeper support behind it. ⚖️ Risk/Reward (entry midpoint 0.03963, stop 0.03650, risk about 7.9%) TP1 0.04305: +8.6% (1.1 : 1) TP2 0.04503: +13.6% (1.7 : 1) TP3 0.04612: +16.4% (2.1 : 1) This is market analysis, not financial advice. Only risk what you can afford to lose. #WSOT2026 #IMPACTbyTrade #MyByXTake

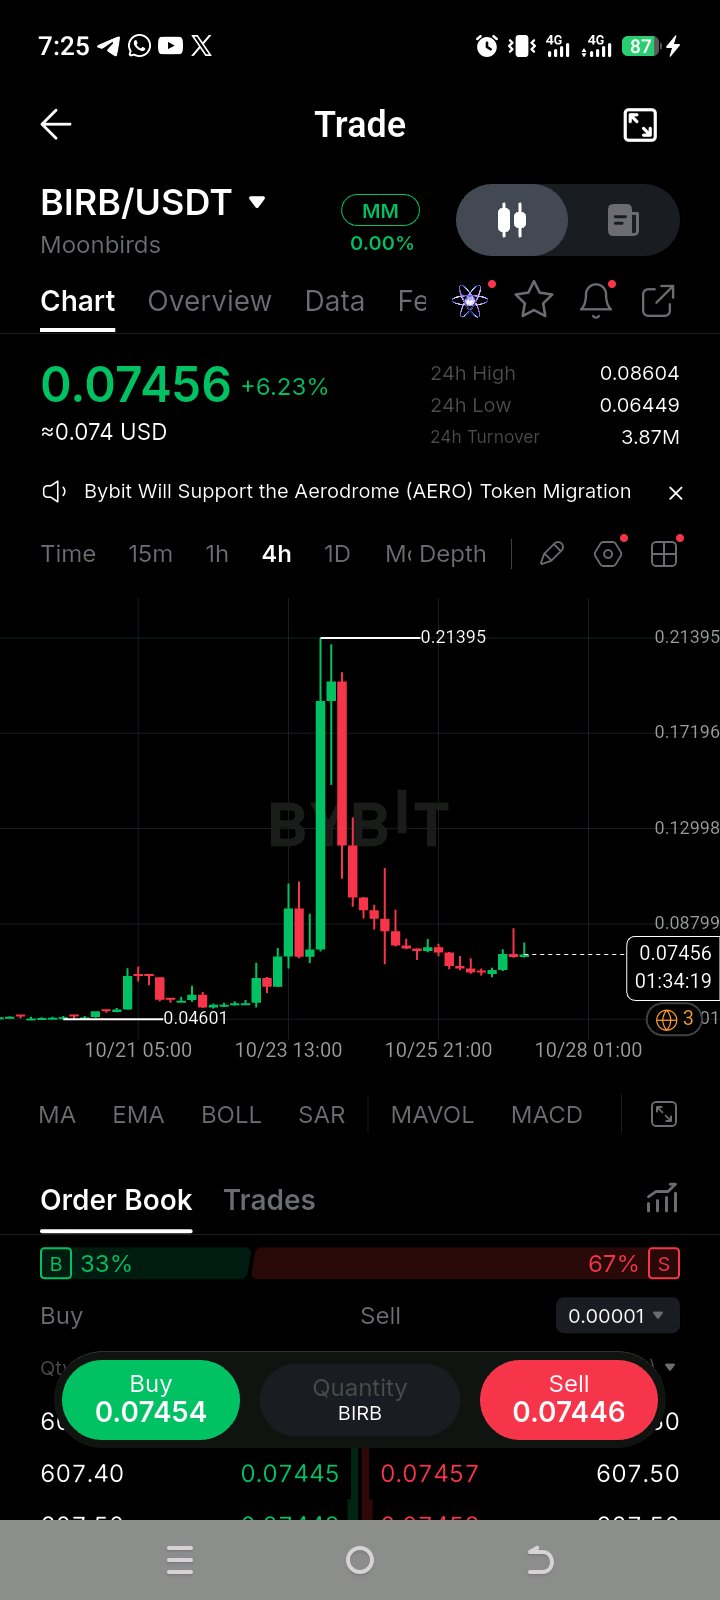
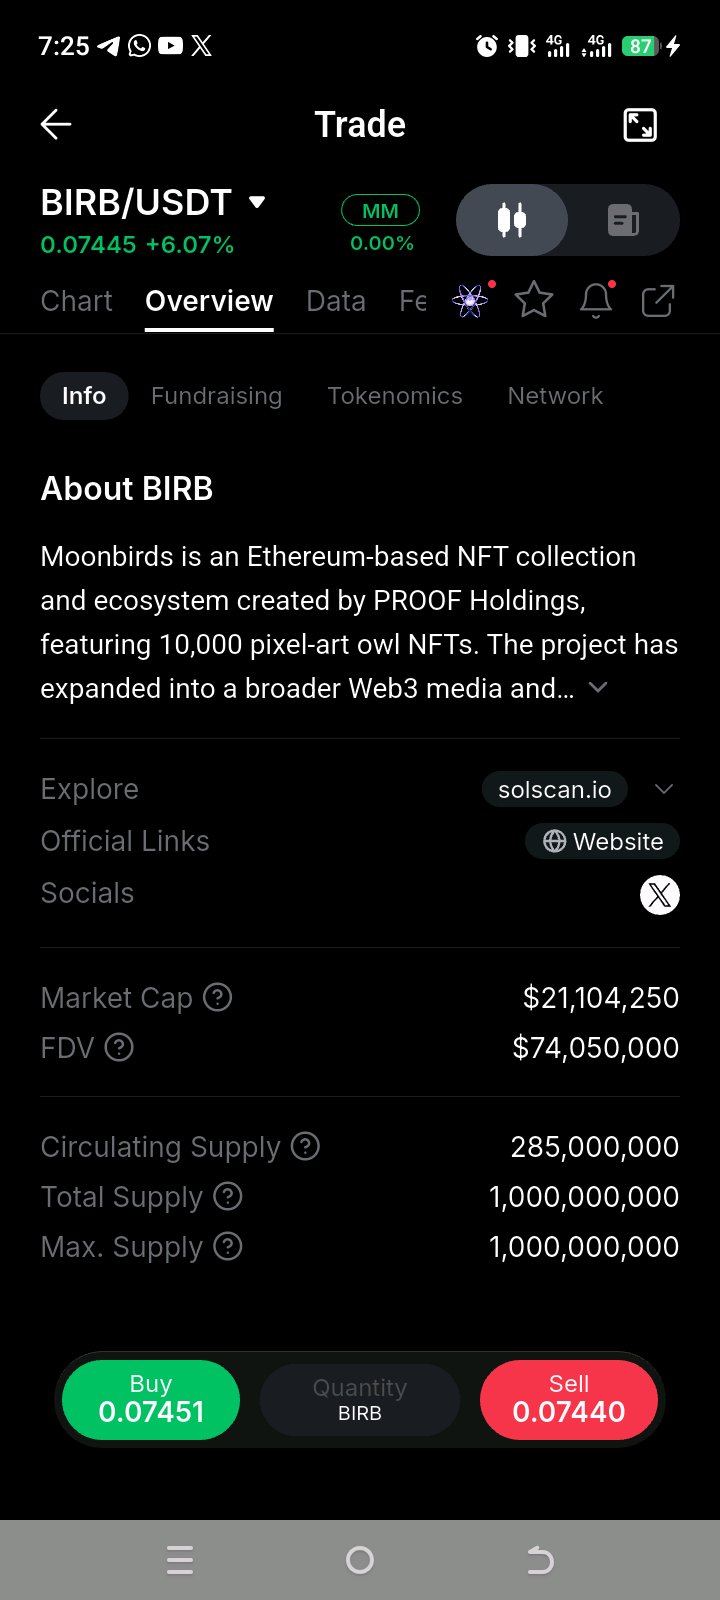
$BIRBUSDT: Reversal or Just a Relief Bounce? After surging to 0.21395, BIRB experienced a sharp correction and is now attempting to stabilize around 0.074. Here’s what I’m watching: • 0.080–0.088: First resistance zone. • 0.070: Key support to hold. • 0.0645: A break below this recent low could weaken the recovery setup. I want to see a convincing 4H breakout with volume before confirming a potential trend reversal. No blind entries. Confirmation first, risk management always. What do you see here: a potential reversal through accumulation, or another move lower? #IMPACTbyTrade #MyByXTake #MidtermsMarketWatch

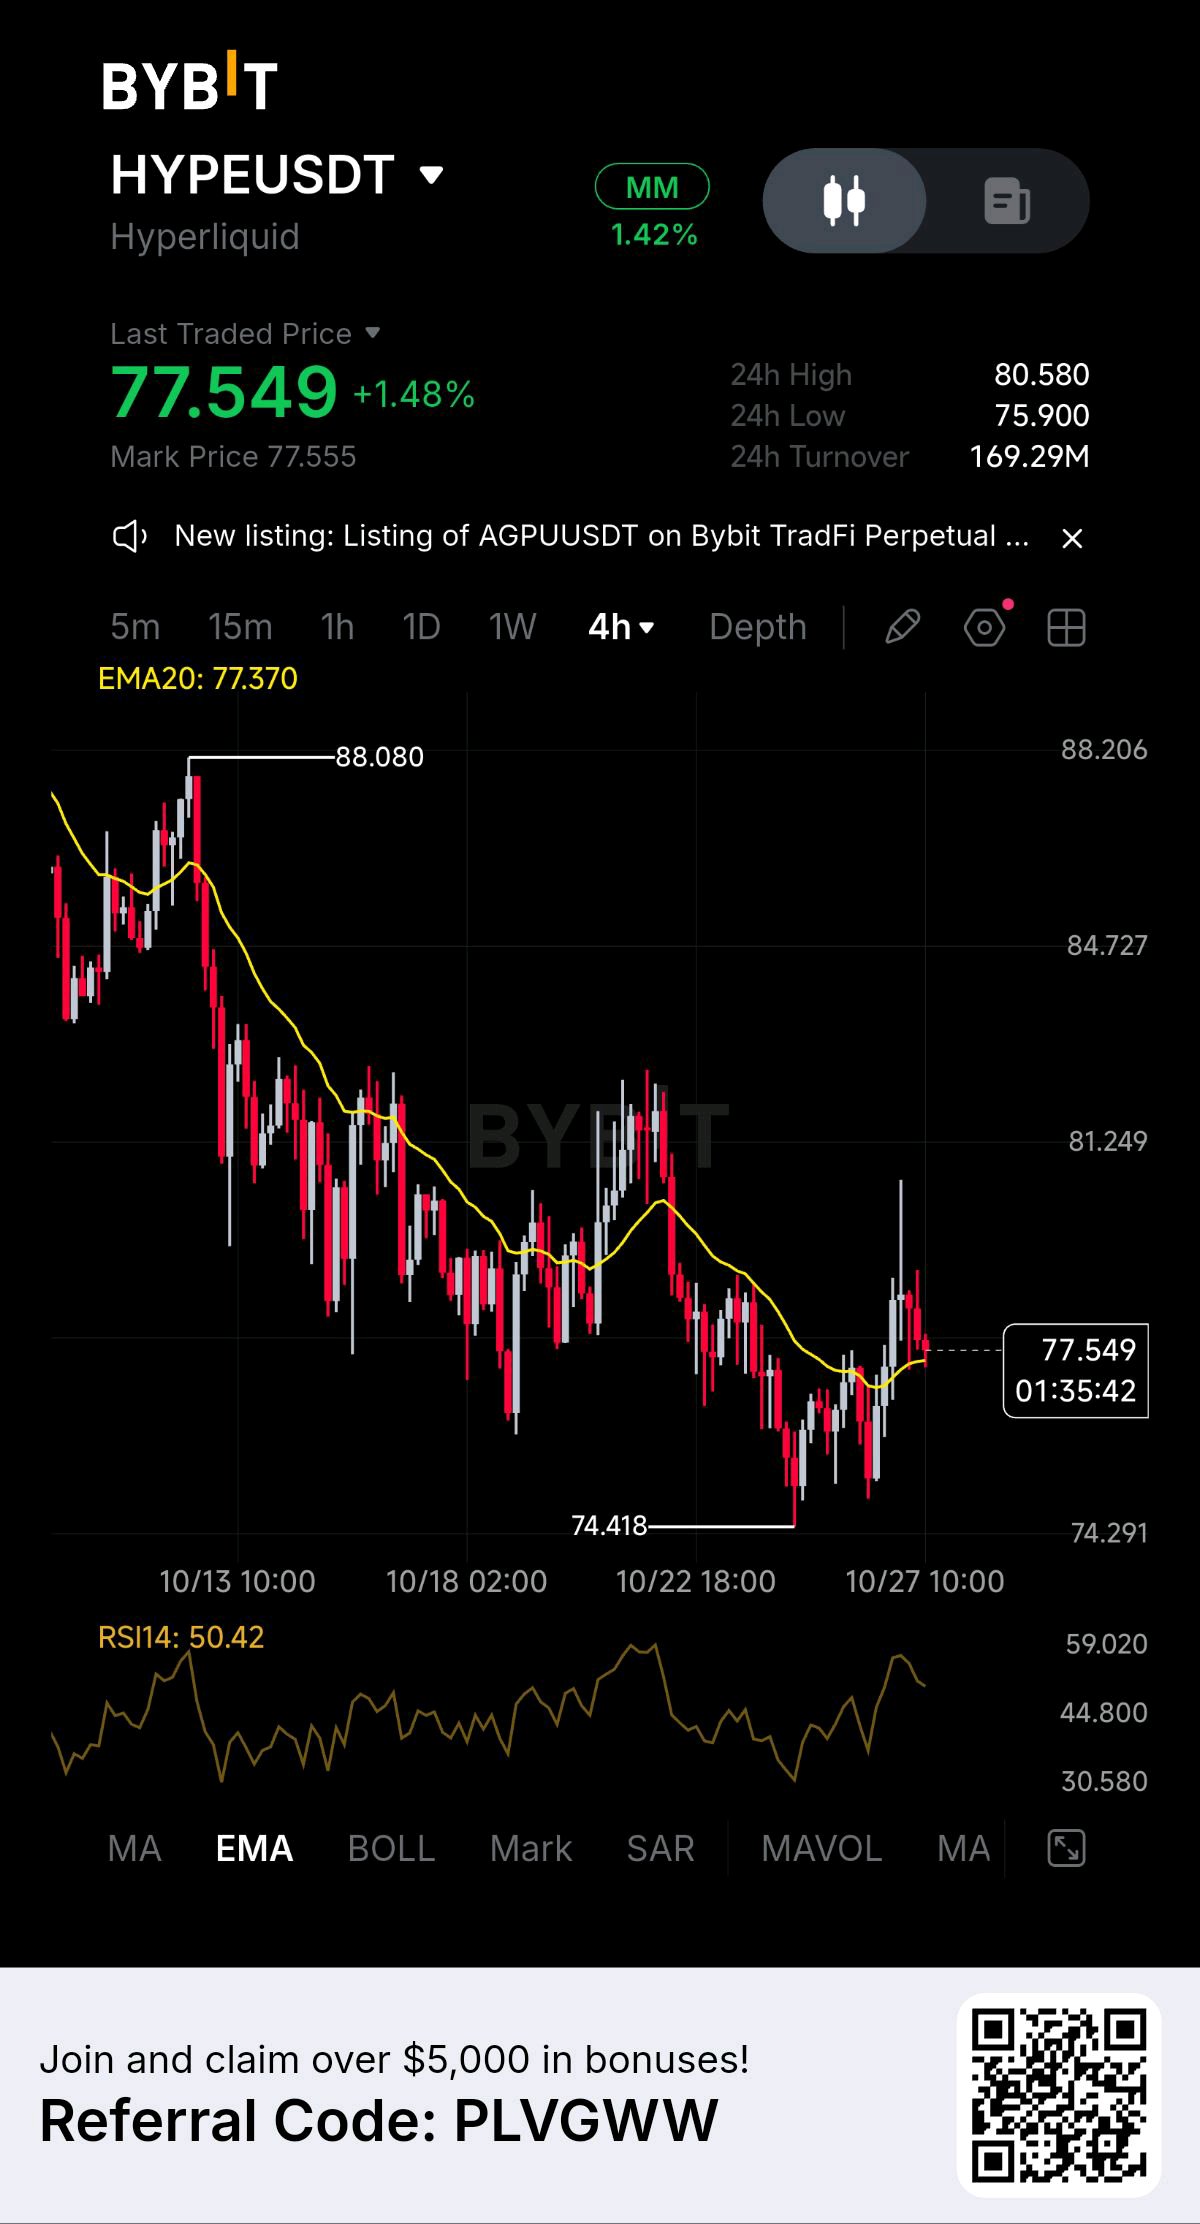
Looking at HYPE on the 4h, it's been in a downtrend since the 88 high, with lower highs the whole way down until buyers stepped in at 74.4. Since then it bounced to the 80.5 area, pulled back, and is now sitting right on the EMA20 at about 77.4. RSI is near 50, so momentum is neutral and nothing looks stretched. What I'm watching is whether it can hold above the EMA20 and push back toward 80.5. If it does, a move into the mid 80s is possible. If it loses the EMA and slips under 75.9, I'd expect a retest of the 74.4 low, and a break below that would kill the bounce idea. I opened a long around 77.5, so 74.4 is my line. Just my read, not financial advice. #IMPACTbyTrade #MyByXTake $HYPEUSDT


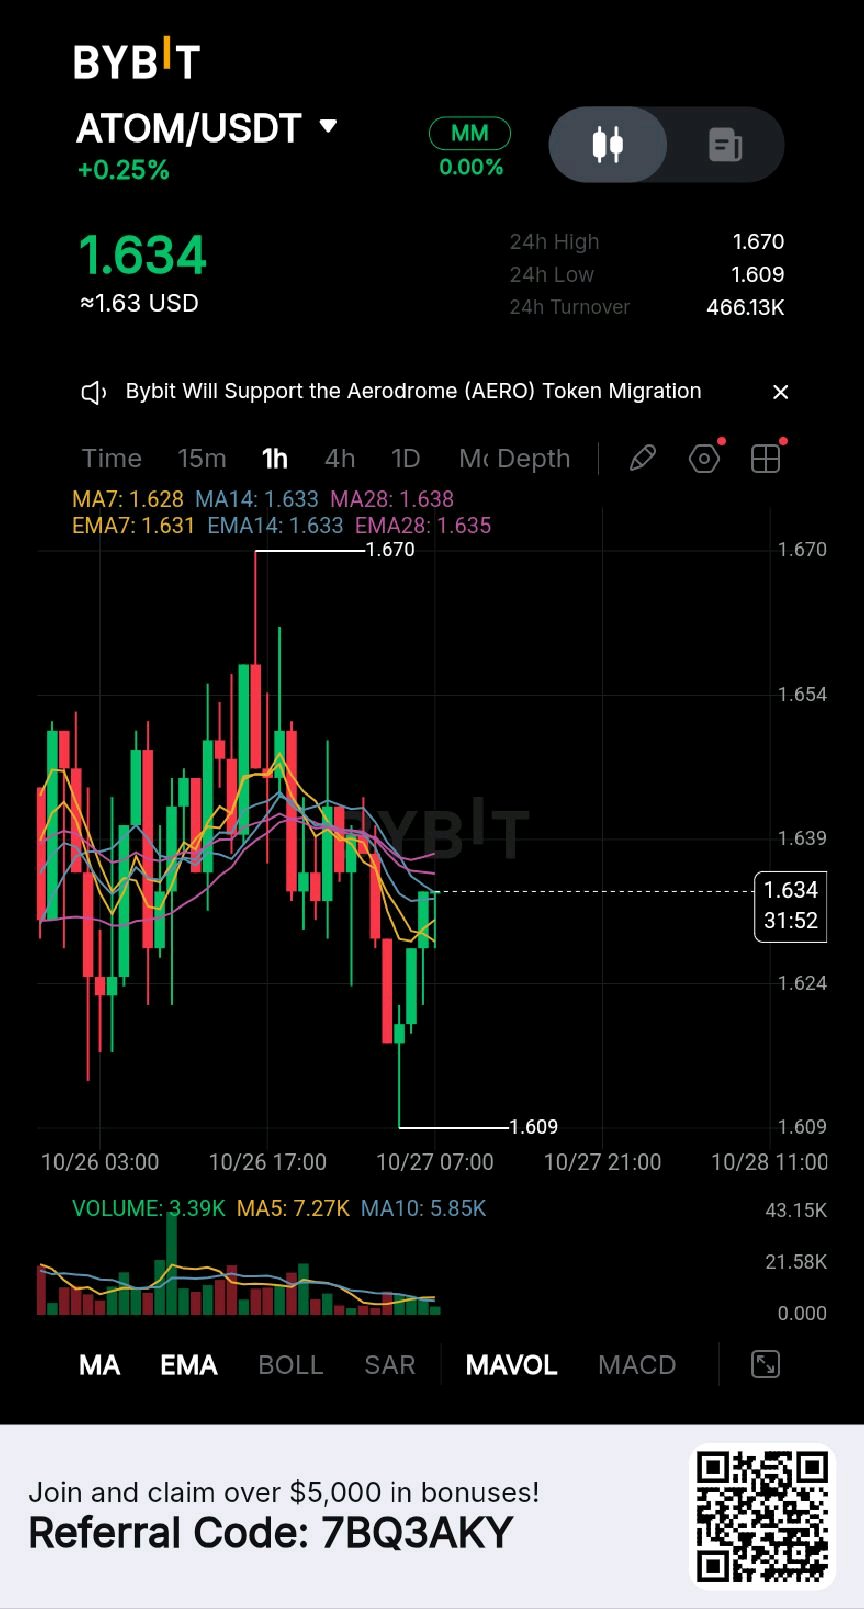
The fundamental investment thesis is that demand for interoperable blockchains, cross-chain finance and application-specific networks could grow as crypto infrastructure matures. Cosmos provides technology to support that development, including the Cosmos SDK, CometBFT consensus and Inter-Blockchain Communication (IBC). However, Cosmos ecosystem adoption and ATOM token appreciation are two different investment questions. A project can use Cosmos technology without needing to buy or hold ATOM. That makes token value capture, inflation and actual Cosmos Hub demand central to the investment case. The central research question is: Can Cosmos Hub create enough sustainable demand for ATOM to outweigh token dilution and competition from other blockchain ecosystems? The fundamental investment thesis is that demand for interoperable blockchains, cross-chain finance and application-specific networks could grow as crypto infrastructure matures. Cosmos provides technology to support that development, including the Cosmos SDK, CometBFT consensus and Inter-Blockchain Communication (IBC). However, Cosmos ecosystem adoption and ATOM token appreciation are two different investment questions. A project can use Cosmos technology without needing to buy or hold ATOM. That makes token value capture, inflation and actual Cosmos Hub demand central to the investment case. The central research question is: Can Cosmos Hub create enough sustainable demand for ATOM to outweigh token dilution and competition from other blockchain ecosystems? $ATOMUSDT

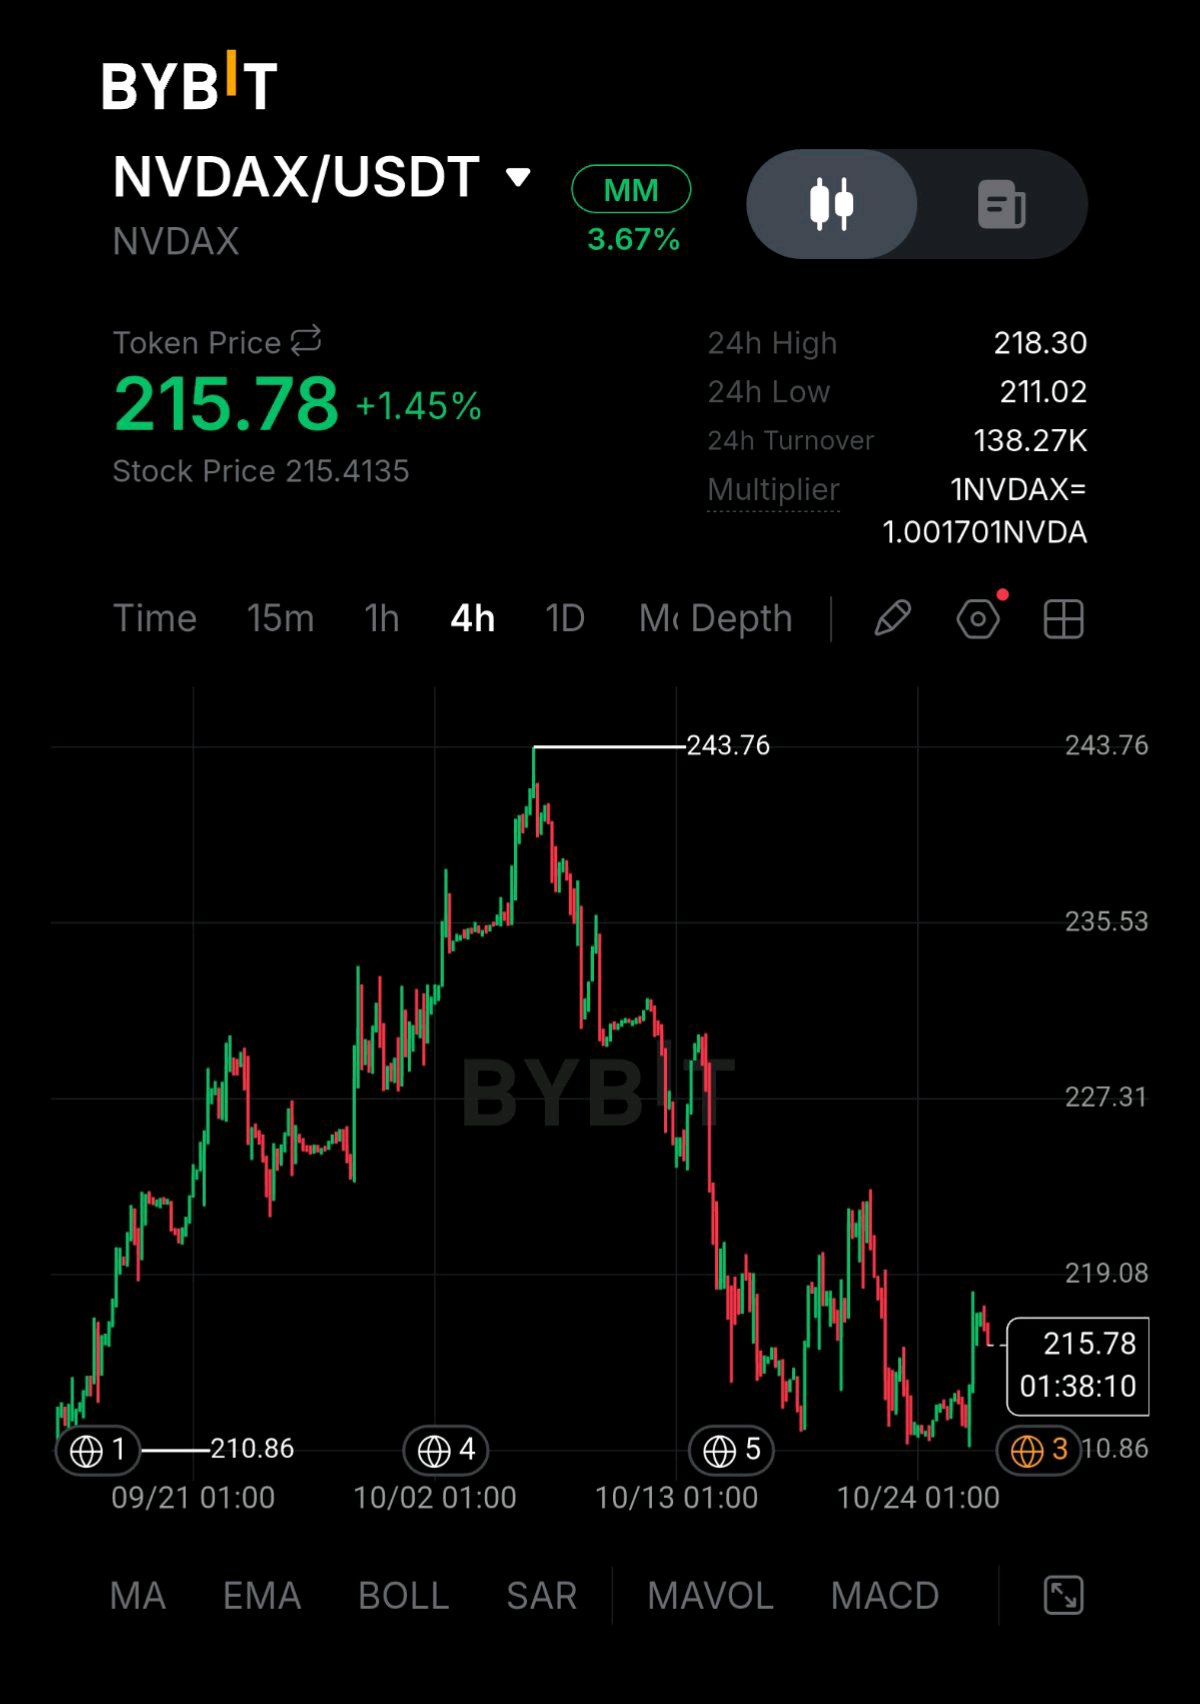
NVDAX is up 1.45% at $215.78 extending the bounce off the $211.02 double bottom that held through last week slide Zoomed out this move is now part of a much bigger clearer story than a single day candle The full month tells it well. From the $243.76 peak NVDAX fell in a sustained near uninterrupted slide down to $211 an eight session selloff that on the underlying stock side wiped out roughly $2 trillion in semiconductor market value as AI infrastructure financing fears spread across the sector That's not noise that's a real repricing of risk What makes today's bounce meaningful is the catalyst behind it Anthropic IPO filing and Meta plan to raise up to $95 billion in share sales with Nvidia itself named as a cornerstone investor alongside AMD and Broadcom reignited the AI trade just as the stock was testing its lows. That combination matters A technical bounce off a double-bottom is one thing a bounce backed by a fresh demand side catalyst is another and this chart has both Turnover at 138.27K is picking up from the quiet consolidation days before it consistent with real buying returning rather than a weak reflex bounce. The level that matters now is $219.08-227.31. That's the shelf this chart broke down through on the way to the lows, and reclaiming it would be the first sign this bounce is turning into a real recovery rather than a pause inside a downtrend The $211.02 low remains the line that needs to hold losing it again would undo the double bottom structure that's formed there. What I'm watching: a push through $219-227 to confirm the recovery or a slip back toward $211 that would put the stabilization in question. $NVDAXUSDT #ByXIMPACT #IMPACTbyTrade #MyByXTake


ETH Tests $2,300 as Selling Pressure Builds
Ethereum is approaching a critical price zone as ETF outflows and broader market uncertainty weigh on sentiment. $ETHUSDT traded around $2,325 on October 27, after slipping below the $2,400 psychological level. The question now is whether buyers can defend the $2,300 area or whether another wave of selling will push prices lower. One source of pressure is institutional demand. U.S. spot Ethereum ETFs recorded approximately $224.96 million in net outflows during the week of October 19–23, marking a fourth consecutive negative week. Persistent redemptions do not guarantee further declines, but they weaken one potential source of spot-market support. Ethereum also faces a network-development question. The planned Glamsterdam upgrade on the Hoodi testnet was postponed after compatibility issues were identified. This is not evidence of a mainnet failure, but it highlights why upgrade readiness and security reviews matter as Ethereum continues evolving. Key levels to watch: ETH is trading near $2,325, with support around $2,300–$2,320 and the October 24 low near $2,276. A decisive break below that low could expose the $2,220 area. On the upside, reclaiming $2,360–$2,400 would help show that buyers are regaining control. These are technical reference levels, not guaranteed turning points. The wider market adds another variable: the Federal Reserve’s October 27–28 meeting. Any shift in rate expectations could affect risk appetite across crypto, although the policy outcome and market reaction remain uncertain. Derivatives positioning also deserves attention because leveraged liquidations can accelerate moves in either direction. ETH’s setup is currently fragile, but a bearish conclusion is not automatic. ETF flows, price confirmation and the market’s response around support will provide a clearer signal than headlines alone. Key questions: 1. Can ETH defend the $2,300 support zone? 2. Will ETF outflows continue to pressure prices? 3. Can buyers reclaim $2,400 before the Fed decision? #IMPACTbyTrade

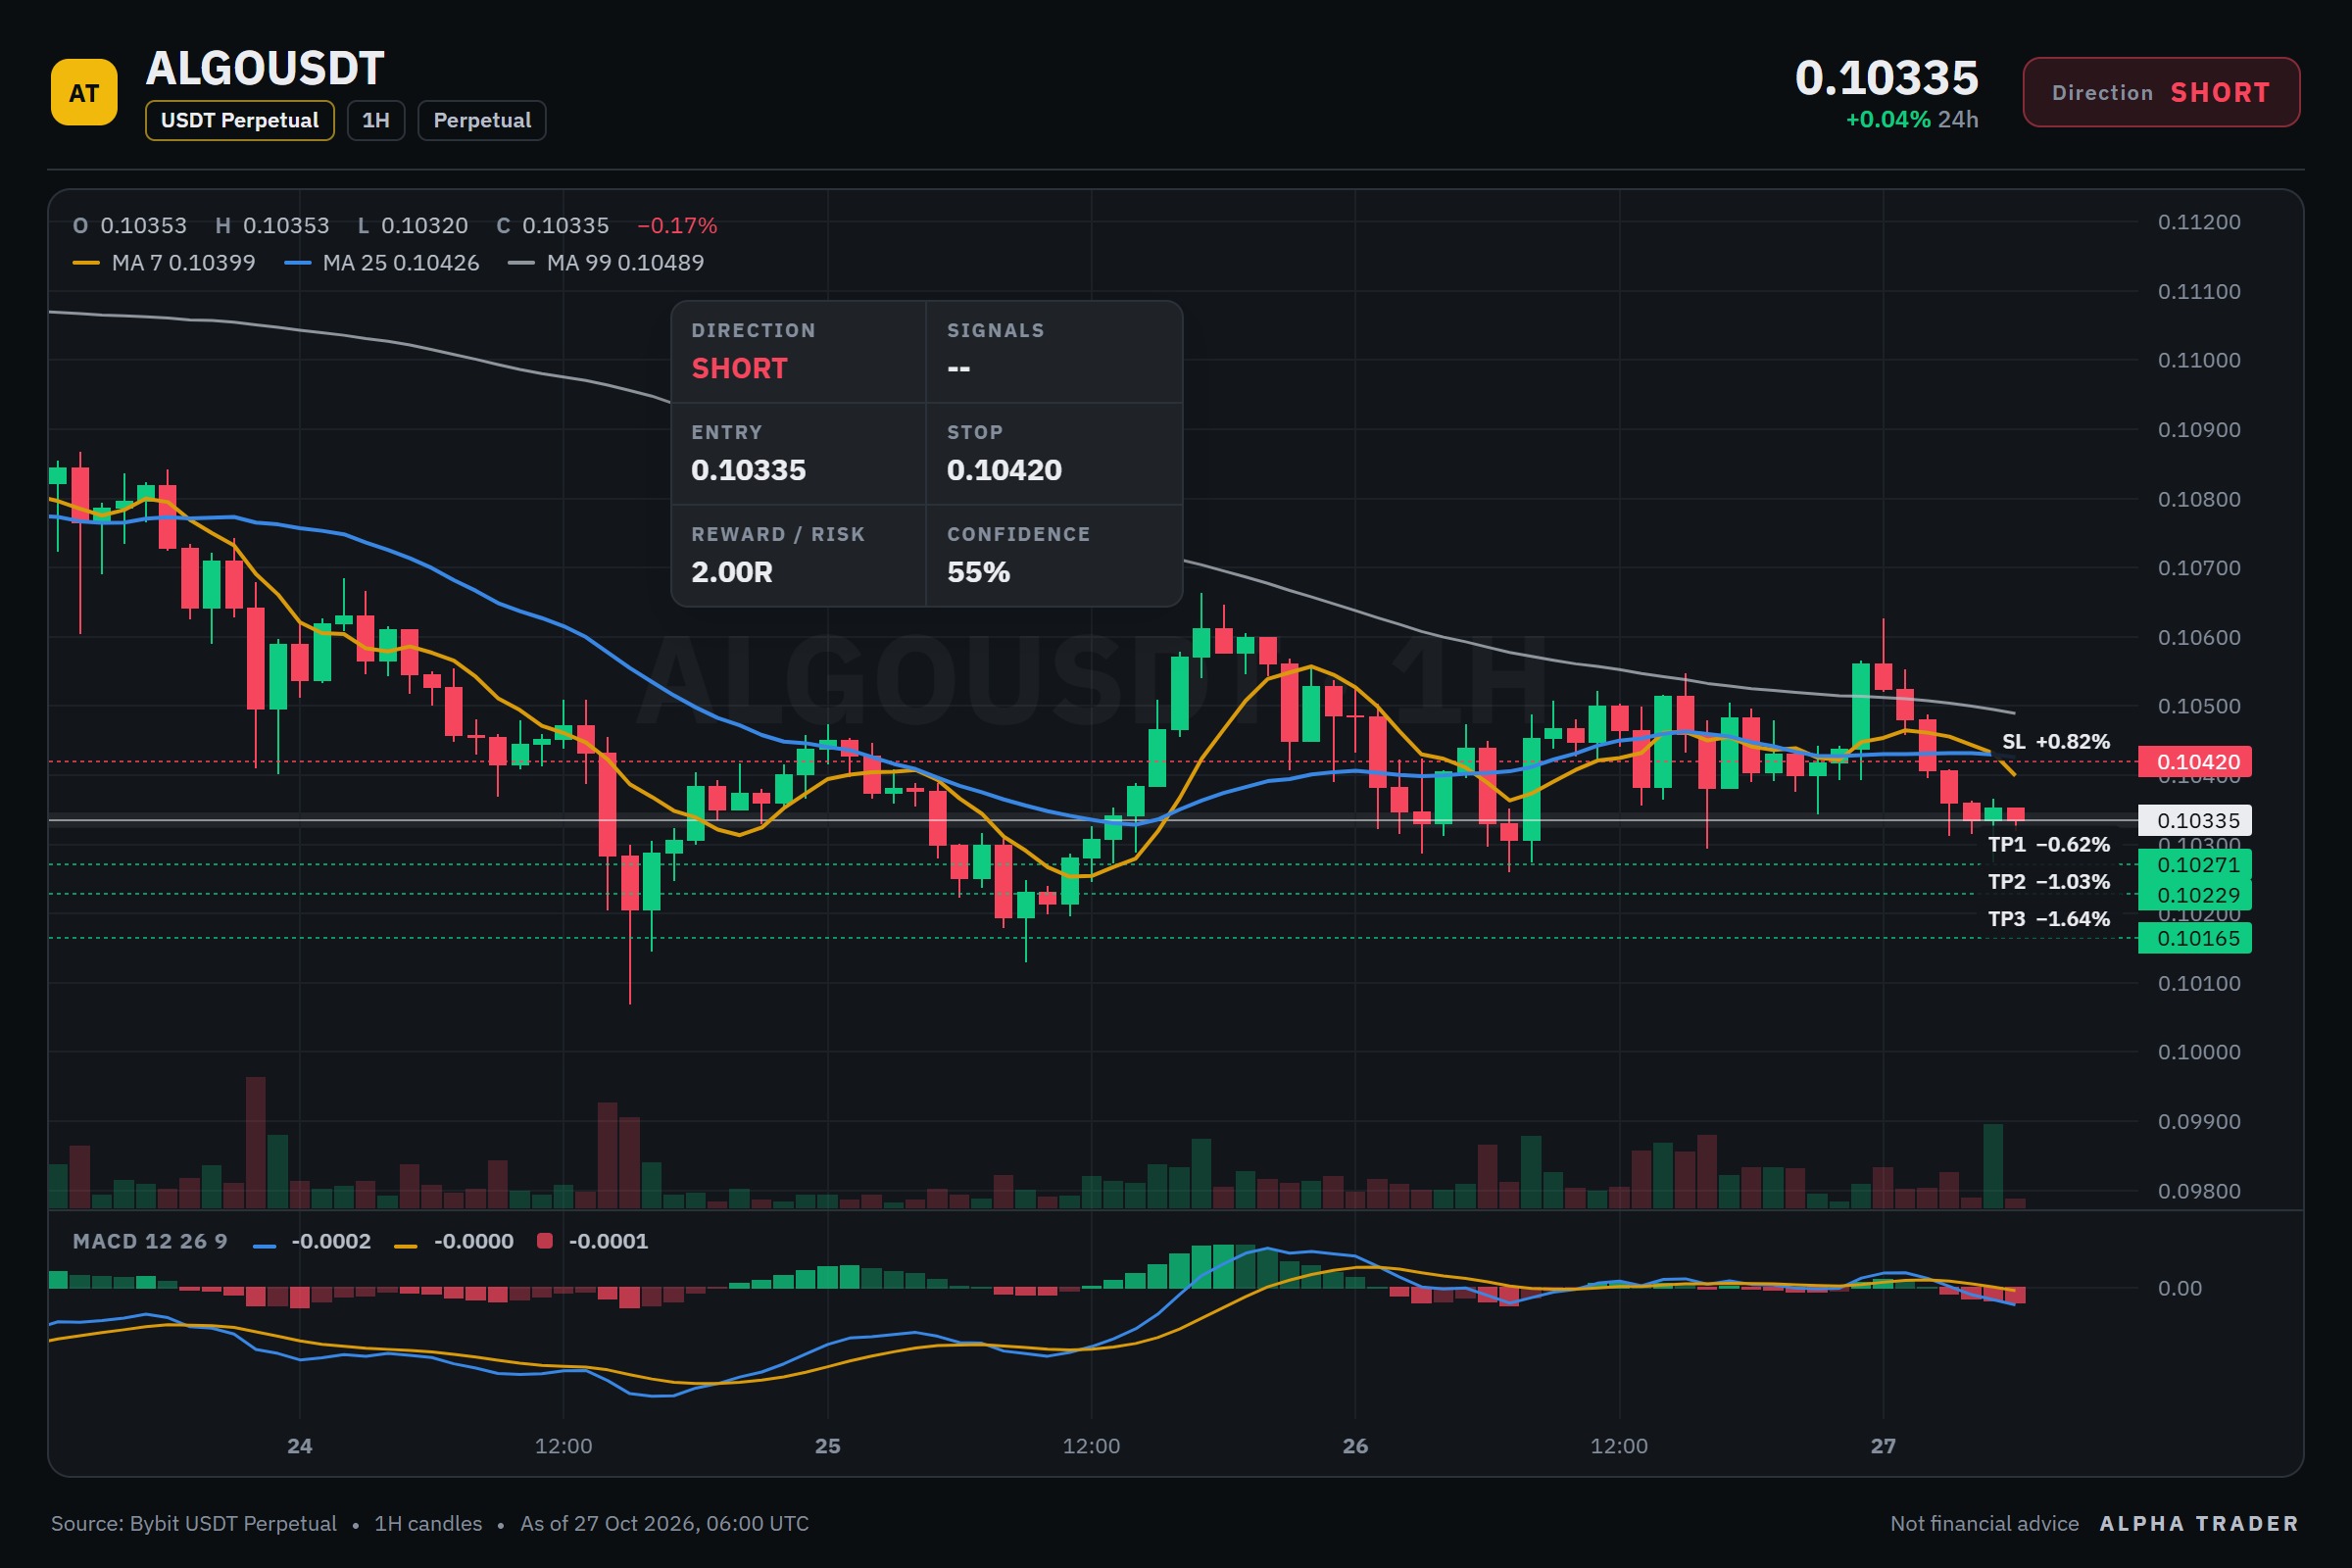
Why $ALGOUSDC ’s latest price movement is catching attention. — SHORT Entry: 0.10324 - 0.10346 SL: 0.10420 TP1: 0.10271 TP2: 0.10229 TP3: 0.10165 Watching hold its current range while $BTCUSDC stays neutral, the 15m RSI reading around 41 suggests room for continued downside momentum. The setup aligns with a short bias if price breaks below the entry zone, with SL and TP levels clearly defined for risk management. Do you see finding support before the next TP, or is the short still in play? ⚠️ Personal market analysis only. NFA — manage risk and DYOR. Educational content, not investment advice or a recommendation to buy, sell, deposit, or withdraw any asset. No paid promotion or referral/affiliate links.

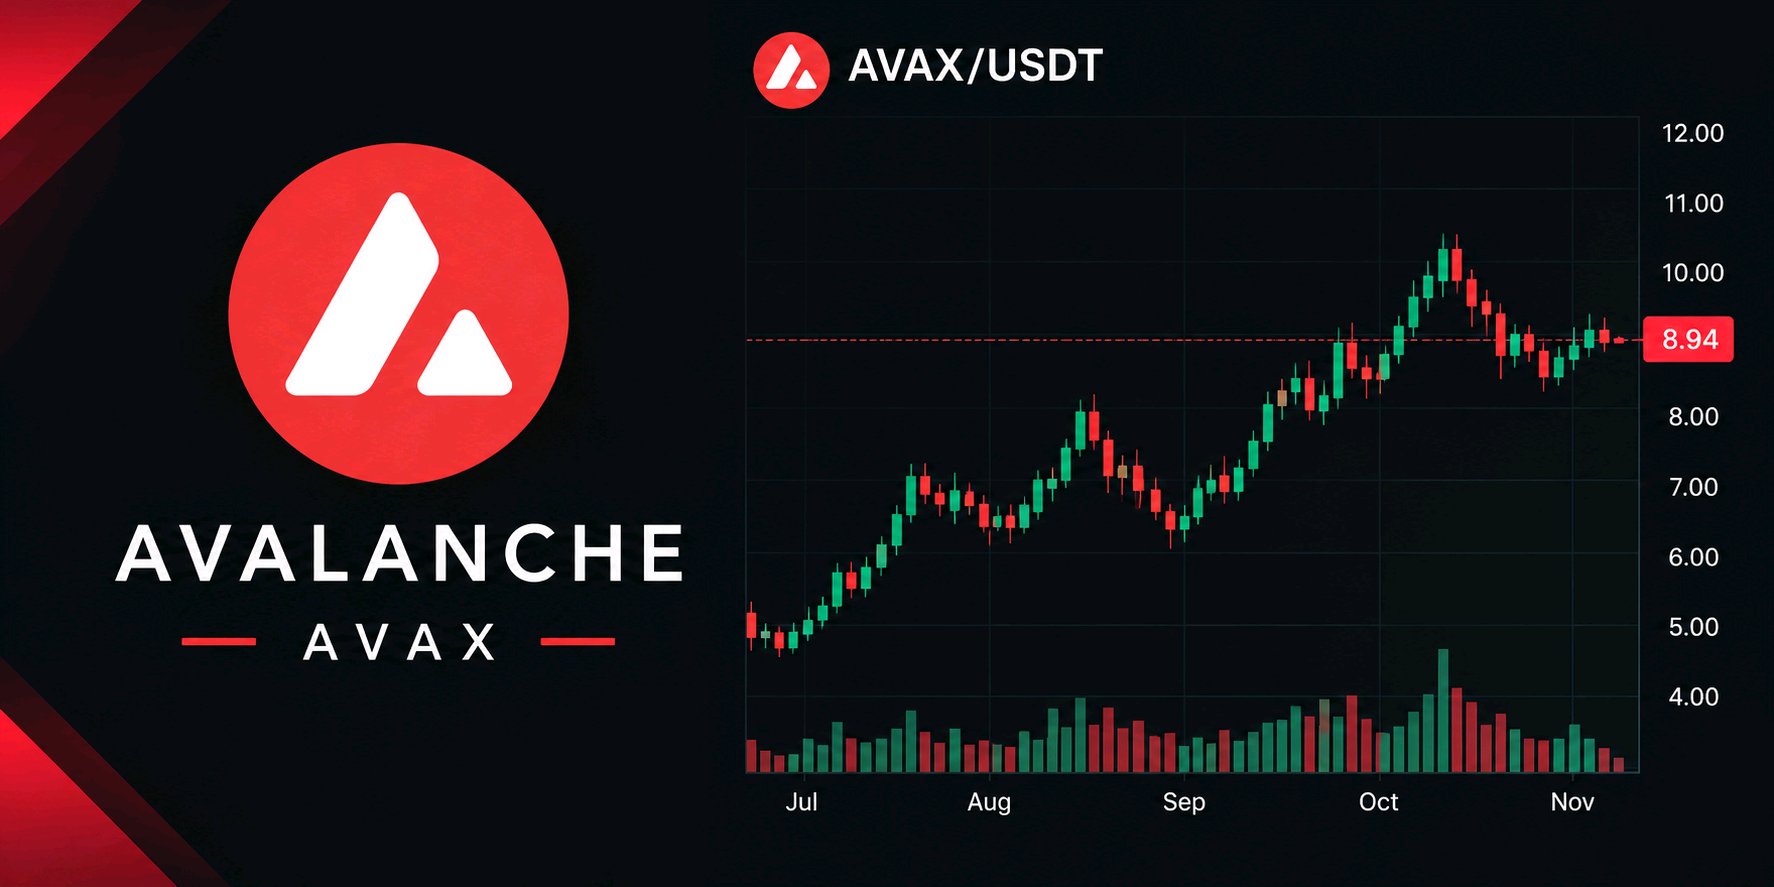
🔺$AVAXUSDT WILL SUPPORT HOLD OR SELLERS TAKE CONTROL? Avalanche (AVAX) is approaching a critical decision zone. The key question is whether buyers can reclaim resistance or sellers will trigger another downside move. 📊 KEY PRICE LEVELS 🔴 Resistance: $9.05–$9.15 A confirmed breakout with strong volume could open the way toward $9.25–$9.35. 🟡 Recovery Zone: $9.25–$9.35 Holding above this area could strengthen short-term bullish momentum. 🟢 Critical Support: $8.75–$8.85 Buyers need to defend this zone to maintain recovery potential. ⚠️ Breakdown Level: Below $8.68 A confirmed breakdown could expose AVAX to further downside. 🌍 MACRO FACTOR The October 27–28 Federal Reserve meeting could increase crypto volatility. A supportive outlook may help buyers, while hawkish guidance could pressure AVAX. 📈 BULLISH SCENARIO: Reclaim $9.15 with strong volume and hold the retest. 📉 BEARISH SCENARIO: Lose $8.68 and fail to reclaim it. 🎯 MY MARKET STANCE: WAIT I would rather wait for confirmation than chase an uncertain move. These levels are reference zones, not guaranteed outcomes. Verify the live Bybit chart before trading. Question: Will AVAX reclaim $9.15, or will sellers push it below $8.68? #ByXIMPACT #WSOT2026

XRP is sitting at an interesting point right now. The recovery is still alive, but I would not call it a confirmed breakout yet. Price is holding around $1.30 after recovering from the $1.273 area. On the 4H chart, however, the bigger structure is still fragile. With Ripple’s Swell event running Oct. 27–29 and the Fed decision coming on Oct. 28, XRP could see a sharp move in either direction. The level I am watching most is $1.313–$1.314. This is the recent 24H high and the main ceiling. If XRP can close a 4H candle above this area and then hold the retest, that would be the first convincing sign that buyers are starting to take control. For now, $1.300–$1.303 is the recovery area. Staying above it keeps the short-term rebound intact. Losing it would weaken the current momentum. Below that, $1.285 is the next level I would watch closely. A strong reaction there could give buyers another chance to push toward $1.313. The bigger risk comes below $1.273. A clean break under this level would weaken the recovery structure and could bring $1.255 into focus. From a buyer-versus-seller perspective, I still see sellers having the advantage below $1.313. That changes only when XRP breaks above the ceiling and proves it can hold there with real volume. The upcoming catalysts also matter. Ripple Swell could create XRP-specific volatility, while the Oct. 28 Fed decision could move the entire crypto market. ETF flows have improved recently, but exchange inflows and the broader market weakness are still reasons to stay cautious. For me, the cleaner setup is not in the middle of this range. If XRP breaks $1.313–$1.314, closes above it and successfully retests the level, the next areas I would watch are $1.328 and $1.350. On the other side, rejection from the $1.303–$1.314 area followed by a break below $1.285 would shift attention back toward $1.273 and potentially $1.255. So I would rather wait for the market to show its hand than chase the move in the middle. The real question is: can XRP turn $1.313 into support, or will sellers defend that level once again? $XRPUSDT #ByXIMPACT

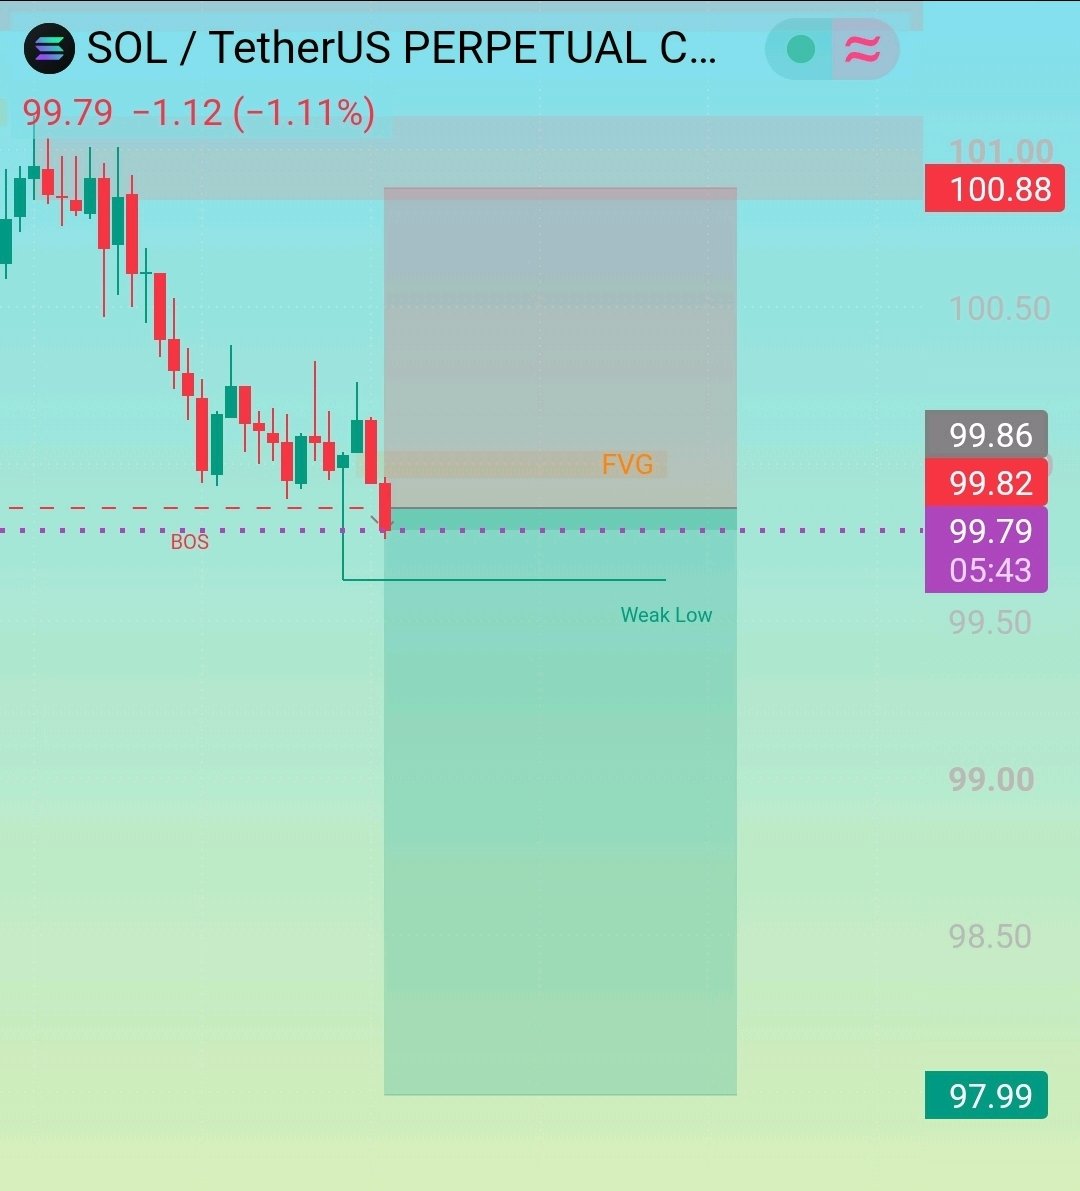
After a clear BOS, $SOLUSDT trading below the FVG zone, keeping sellers in control. A move toward the weak low is possible, with 97.99 as the downside target. Trade Setup Short: 99.79–99.86 SL: 100.88 TP: 97.99

🚨 NEAR PROTOCOL: THE PULLBACK MAY BE TELLING US SOMETHING IMPORTANT Most traders notice the price drop. Fewer ask what happens after a strong rally loses momentum. NEAR climbed toward $6 in early October before pulling back into the $4–$5 region. Recent market reporting also highlighted a test of its 50-day moving average. 🔎 What deserves attention now? • Can buyers defend the recent support area? • Will trading volume increase during the next recovery? • Can NEAR reclaim resistance with genuine buying pressure? A pullback alone does not prove that a rally is finished—or that a new rally is starting. Confirmation matters more than speculation. My focus: Watch how price behaves around support and whether buyers can establish a stronger recovery structure. NEAR's ecosystem is exploring a key question for the AI era: how can AI applications provide useful services while protecting sensitive information? According to the NEAR AI blog, a partnership with Levanto Labs announced on October 26, 2026, focuses on verifiably private decision models and confidential computing. Why could this matter? 🔹 Privacy is an important consideration for AI applications. 🔹 Verifiable computing may help users assess whether systems follow defined security guarantees. 🔹 Practical adoption—not announcements alone—will determine the significance of these developments The market question: Can technical progress translate into sustained usage and meaningful ecosystem activity? A technology announcement is not proof that the NEAR token must rise. Traders should evaluate price action and market conditions separately from the project's development progress. #ByXIMPACT #AnthropicS1Filing #WSOT2026 #MyByXTake #IMPACTbyTrade $NEARUSDT


NVIDIA (NASDAQ: NVDA) has become one of the central companies in the global artificial intelligence economy. Its importance extends beyond graphics cards: NVIDIA supplies the computing hardware, networking technologies, software tools and development ecosystem that power large-scale AI training and inference. The fundamental investment thesis is that AI computing demand may continue expanding as businesses, cloud providers and governments invest in AI infrastructure. NVIDIA is positioned to benefit from that spending through its GPU platforms, integrated systems and CUDA software ecosystem. However, a strong company is not automatically a good investment at every price. NVIDIA's future stock performance will depend on earnings growth, customer spending, competition, supply capacity and the valuation investors are willing to pay. The central research question: Can NVIDIA sustain enough profitable growth to justify its market valuation while the AI industry evolves? NVIDIA (NASDAQ: NVDA) has become one of the central companies in the global artificial intelligence economy. Its importance extends beyond graphics cards: NVIDIA supplies the computing hardware, networking technologies, software tools and development ecosystem that power large-scale AI training and inference. The fundamental investment thesis is that AI computing demand may continue expanding as businesses, cloud providers and governments invest in AI infrastructure. NVIDIA is positioned to benefit from that spending through its GPU platforms, integrated systems and CUDA software ecosystem. However, a strong company is not automatically a good investment at every price. NVIDIA's future stock performance will depend on earnings growth, customer spending, competition, supply capacity and the valuation investors are willing to pay. The central research question: Can NVIDIA sustain enough profitable growth to justify its market valuation while the AI industry evolves? $NVDAXUSDT #ByXIMPACT


ACTUALIZACIÓN DE TRX
$TRXUSDT Actualmente, su precio está en los $0.3290. En las últimas 24 horas ha bajado un 0.40%. A largo plazo, el movimiento apunta al alza; la verdad el precio ha disminuido. Sin embargo, la zona de los $0.3290 es una zona importante; es decir, mantenerse por encima de este nivel es clave para buscar un rebote. A corto plazo, el movimiento ha perdido fuerza, por lo que a primera vista sería bueno retomar la zona de los $0.3324; de esta manera, los compradores terminan ganando la batalla y tomando el dominio nuevamente. Zonas clave: • Línea de soporte: Se encuentra entre los $0.3290 y los $0.3275. La clave es mantenerse por encima de este bloque. • Línea de resistencia: Se encuentra en la zona de los $0.3444. Romper este nivel nos abrirá espacio al alza. $TRXUSDC

XAUT FACES REJECTION AT 4,025: WHAT COMES NEXT?
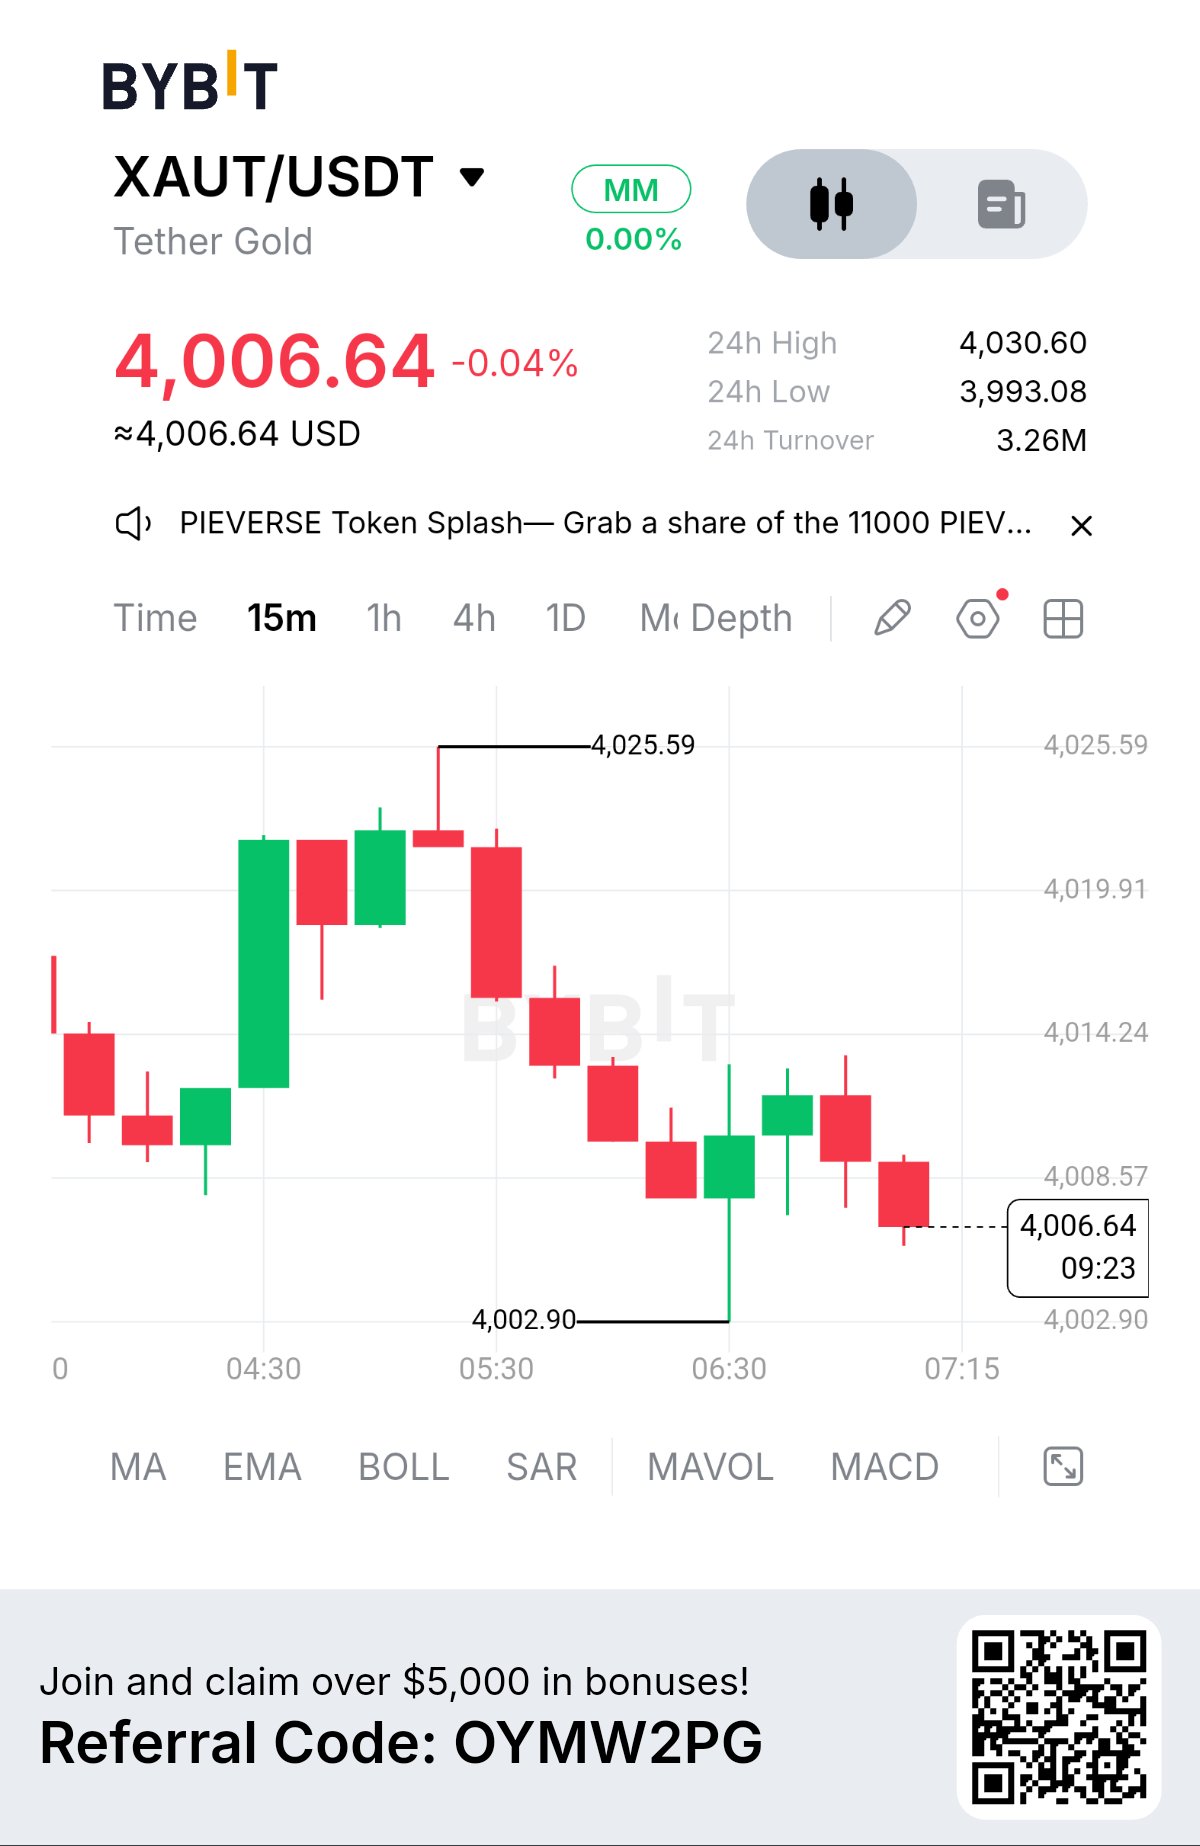
Market Snapshot • Price: 4,006.64 • 24H Change: -0.04% • 24H High: 4,030.60 • 24H Low: 3,993.08 • 24H Turnover: 3.26M Market Structure $XAUTUSDT is showing short-term weakness on the 15-minute chart after failing to hold its upward move. Price climbed from around 4,002.90 but faced strong rejection near 4,025.59. Since then, lower highs and lower lows have developed, suggesting that sellers currently have the advantage. However, price is approaching an important support zone where buyers may attempt to regain control. Key Levels • Resistance: 4,025.59 • Recovery Threshold: 4,014.24 • Immediate Support: 4,002.90 • Deeper Support: 3,993.08 Bullish Scenario If buyers regain momentum and push XAUT above 4,014.24 with a strong 15-minute close, price could move toward another test of 4,025.59. A confirmed break above resistance would provide stronger evidence of recovery. Bearish Scenario If price fails to recover and closes below 4,002.90, selling pressure could increase toward the 24-hour low of 3,993.08. A break of support would weaken the case for an immediate bullish recovery. Market Insight A strong rally followed by a steady pullback can indicate that buying momentum is fading. But a pullback does not automatically mean the next move must be downward. The important signals are whether buyers defend 4,002.90 and whether price can reclaim 4,014.24. Until one of these levels is convincingly broken, patience and confirmation remain essential. Discussion Is XAUT preparing for another recovery toward 4,025.59, or could a break below 4,002.90 bring further downside? #ByXIMPACT #MyByXTake $GRAMUSDT


TSLA: Bulls Are Testing the Next Big Wall
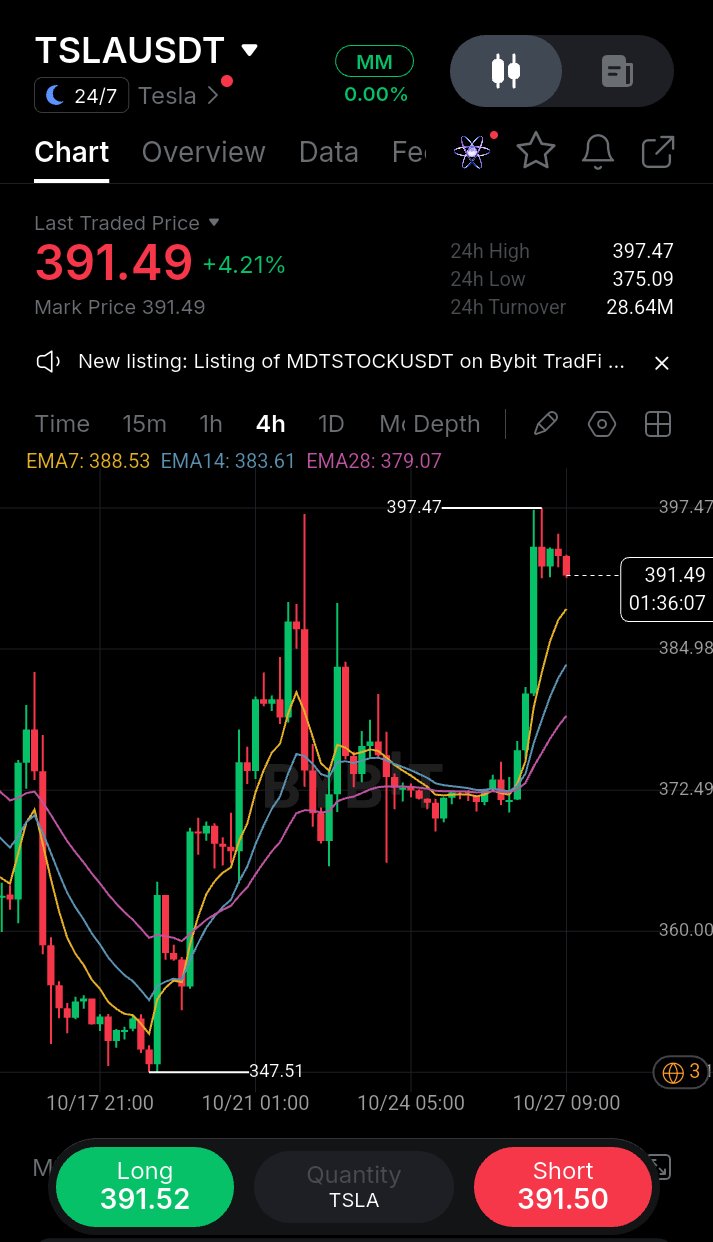
Tesla is making a statement on the 4-hour chart. After spending several sessions struggling around the $370–$373 region, TSLAUSDT has finally broken out with a powerful upward move, pushing the price to $391.49 and recording a gain of approximately 4.21%. But here is where the real battle begins: Can buyers turn this breakout into a sustained rally, or will the $397.47 resistance zone trigger another round of profit-taking? The structure is becoming increasingly interesting. Price has climbed above all three exponential moving averages, with EMA7 at $388.53, EMA14 at $383.61, and EMA28 at $379.07. Their bullish alignment suggests that buyers currently have the short-term advantage. What makes this move particularly notable is the transition from sideways trading to aggressive upside momentum. Instead of gradually grinding higher, price accelerated through resistance, suggesting that buying pressure increased significantly during the breakout. Now, the market needs to prove that this strength can hold. If TSLAUSDT maintains support above $388–$389, buyers may attempt another push toward $397.47. A convincing 4-hour close above that high could open the door toward the $400 psychological level, followed by the $405 area if momentum continues. However, a rejection near $397.47 should not be ignored. After such a sharp rally, a pullback toward $384 or even $379 would not automatically destroy the bullish structure. These areas could become important for determining whether the breakout has genuine staying power. 📍 Levels shaping the next move Current price: $391.49 Immediate resistance: $397.47 Breakout objective: $400.00 Extended upside area: $405.00 First support: $388.50 Secondary support: $383.60 Trend support: $379.00 For a potential LONG, I would prefer to see price hold the $388–$390 area and produce fresh bullish confirmation rather than chase the existing rally. 🚀 Entry: $389.00–$391.00 after confirmation 🎯 TP1: $397.00 🎯 TP2: $400.00 🎯 TP3: $405.00 🔴 SL: $384.00 These are conditional technical levels, not guaranteed outcomes. If price loses support and selling pressure increases, the bullish setup may need to be reconsidered. My focus right now is not simply on how much TSLAUSDT has already gained. It is on what happens when the price challenges $397.47 again. Strong acceptance above resistance would tell a very different story from another rejection followed by a move beneath the short-term averages. The breakout has caught attention. The next confirmation will determine whether it deserves continuation. Stay patient, respect the levels, and never let a strong green candle replace a proper trading plan. $TSLAXUSDT #WSOT2026 #AnthropicS1Filing #IMPACTbyTrade #MyByXTake #ByXIMPACT

$CCUSDT just recovered toward $0.10 after a brutal shakeout, and I’m watching whether buyers can hold this level rather than give back the rebound. The part that caught my attention is that Canton’s institutional adoption story is expanding while the token is still struggling to establish a stable price structure. Canton is built for financial institutions that need privacy and controlled access when moving assets on-chain. The network’s institutional momentum includes DTCC’s planned tokenization service targeting U.S. Treasury securities, alongside settlement experiments involving major financial institutions. That gives CC a concrete infrastructure narrative beyond ordinary speculation. But adoption headlines alone do not guarantee token appreciation. CC’s value proposition depends on whether real network usage translates into sustained demand for the token through its fee and incentive mechanisms. 5 figures worth watching - $0.100 — Key psychological price zone - $0.1077 — Recent resistance - $0.0780 — Recent selloff low - $24M — Aggregate futures open interest - +13.6% — Seven-day OI growth The derivatives picture needs attention: open interest has eased over the latest 24-hour period but remains higher over seven days. That suggests some positions have been cleared, although leverage has not disappeared entirely. Bullish confirmation: CC reclaims $0.103–$0.108 and holds that zone on a retest. That would strengthen the recovery and bring $0.115 back into focus. Bearish confirmation: another rejection followed by a loss of $0.095 would weaken the rebound and expose the market to renewed selling pressure toward $0.078. I’m watching one thing above all: can CC turn its institutional adoption narrative into sustained buying after this volatility? Until price confirms it, Canton’s progress and the token’s performance remain two different stories. #ByXIMPACT